DEEPAK FERTILIZER - Breaking Out in DTF, New ATHDEEPAKFERT has resistance weakening on the Daily charts and has given a breakout with good volume and making a new ATH.
The target of this pattern signals an upside potential of 20% from the current price level in the medium term.
The stock is trading above its 50- and 100-day exponential moving averages (EMAS). The range is more than 1.5X, and the Volume is also 1.5X the average.
CMP- Rs. 1449.80
Target Price- Rs. 1650 (~20% upside)
SL- 1356
Disclaimer: This is not a buy/sell
recommendation. For educational purpose only. Kindly consult your financial advisor before entering a trade.
Support

PNUTUSDT – Breakout Brewing from Bullish Pennant!PNUT Bullish pennant Formation – 200%+ Potential Incoming?! 👀🔥
Hey Traders! If you're all about high-conviction plays and real alpha, smash that 👍 and tap Follow for more setups that actually deliver!
PNUT is consolidating inside a bull pennant after a massive 200%+ rally earlier this month. Currently, it's sitting near the lower support zone, forming higher lows—a sign of growing pressure for an upside move.
🔍 Setup Highlights:
Bull Pennant forming
Strong bounce zone (green box)
Potential breakout path marked in projection
📌 Trade Idea:
Entry: $0.31–$0.28 support zone
Targets: $0.39 / $0.46 / $0.55 / $0.72
SL: Below $0.27
Leverage: 5x–10x (only for experienced traders)
Keep a close eye—once PNUT clears the triangle resistance, things could move fast.
What are your thoughts?

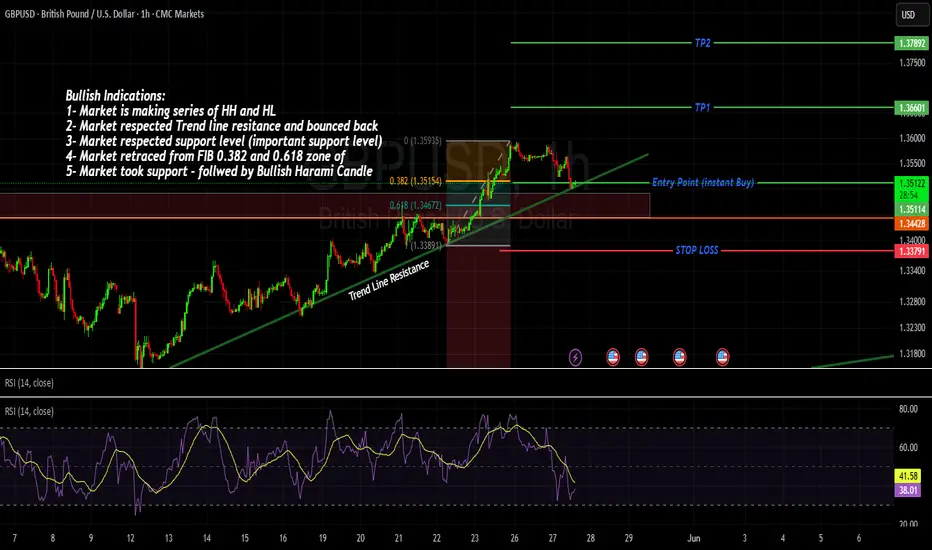
GBPUSD - SO MANY BULLISH CONFLUENCES ! Bullish Indications:
1- Market is making series of HH and HL
2- Market respected Trend line resistance and bounced back
3- Market respected support level (important support level)
4- Market retraced from FIB 0.382 and 0.618 zone of
5- Market took support - followed by Bullish Haram Candle
Entry point - Instant Buy
SL below last LH (Although too much, but safe play)
TP1 and TP11 (with 1:1 and 1:2)
JTO Approaching Breakout Point – Watch This Wedge!🚀 JTO Falling wedge Formation – 100%+ Potential Incoming?! 👀🔥
Hey Traders! If you're all about high-conviction plays and real alpha, smash that 👍 and tap Follow for more setups that actually deliver! 💹💯
JTO has been consolidating within a falling wedge on the daily timeframe for months and is now approaching the apex of the structure.
The price has shown strong demand around the $1.85–$2.00 support zone and is now attempting to push above the wedge resistance trendline.
Technical Highlights:
Falling wedge formation, typically a bullish pattern
Support holding firm at the $2.00 psychological level
Potential for a breakout retest and continuation if volume confirms
Trade Setup
Entry: CMP and add more in the green box(up to $1.8)
Targets: $2.48 / $2.84 / $3.30
Stop Loss: Below $1.85
Risk-to-Reward: Well-structured setup with defined invalidation
A confirmed breakout from this structure could open the door for a strong upside move. Keep an eye on volume and market momentum for confirmation.
What do you think about this? Share your views in the comment section.

Potential NEO 1H ScalpBITGET:NEOUSDT is currently testing resistance around $6.66 with RSI in overbought territory, which could trigger a short-term pullback.
A 0.5–0.618 retracement into the unmitigated hourly FVG ($6.39–$6.47) could provide a compelling long entry, while allowing an RSI reset and potentially forming an IH&S pattern.
The measured target for a breakout above ~$6.66 would be ~7.00 (still valid in case of a direct breakout without a pullback).
Setup 1
• Trigger: Pullback to $6.39–$6.47 and reversal
• Invalidation: Sustained break below $6.39
Setup 2
• Trigger: Break above $6.66 with volume
• Invalidation: Failure to hold $6.66 after breakout

Everybody loves Gold Pt1Everyone loves gold.
With sufficient pips in the bag, we start week 22 with the analysis on gold as highlighted on the chart.
Trade parameters:
SL: 50pips
dtp : dynamic Take profit as momentum leads.

Cardano (ADA) Rectangle + Internal Uptrend (1D)BINANCE:ADAUSDT has spent months ranging between ~$0.51 and ~$1.15, and the structure now clearly qualifies as a rectangle pattern.
After a 3rd touch on support in April, Cardano is showing strength with steady higher lows and a reclaim of a key High Volume Node (HVN).
Key Levels to Watch
• Main Demand: ~$0.51-$0.58
• Rectangle Support: ~$0.51
• Rectangle Resistance: ~$1.15
• Internal Uptrend Support: Rising diagonal from April
• HVN Zone: ~$0.75 — key volume cluster
• Rectangle Midline: ~$0.83 — also a previous S/R
• Main Supply: $1.10–$1.32
Measured Target
If price breaks above $1.15 with volume, the rectangle measured move points to ~$1.80.
Context
ADA has respected this range for nearly half a year. A breakout could mark the start of a macro bullish leg.
Triggers
• Bullish: Clean daily close above $1.15 with volume → $1.80 target activated. For a safer entry, it could be worth waiting a full breakout from the main supply above $1.32.
• Bearish: Breakdown of the ascending trendline and HVN → Potential return to ~$0.51. Failure to hold that level could lead to further downside to the previous ~$0.30 demand zone.

LTC (Litecoin) – Swing Long Setup from Support ZoneLTC is currently pulling back into a key support area between $89 – $96, which has historically provided strong bullish reversals. The zone aligns with a potential higher low on the daily timeframe, making it a solid area for a risk-reward favorable swing long.
🔹 Entry Zone:
$89 – $96 (structural support and previous demand zone)
🎯 Take Profit Targets:
🥇 $133 – $146 (key resistance and prior local highs)
🥈 $180 – $190 (macro range highs and psychological barrier)
🛑 Stop Loss:
Hard stop at $80 (clear break of structure and invalidation of higher low)

MASA Ascending Triangle (1D) + Key LevelsBITGET:MASAUSDT is currently forming an ascending triangle on the daily chart, with horizontal resistance around $0.040 and rising support.
This structure typically leans bullish and suggests accumulation under resistance.
Structure & Zones
• Resistance: ~$0.040 (triangle top, within flipped demand → supply zone)
• Support: Rising diagonal since early May
• Demand: ~$0.013
• Main Supply: $0.06-$0.09 (High Volume Node, with $0.075 as a key S/R)
Breakout Target
A breakout with strong volume could trigger a measured move toward ~$0.060, aligning with the lower boundary of the High Volume Node (HVN) and the previous price cluster.
Context
The grey $0.06-$0.09 HVN has acted as a pivotal area — both as support and resistance — and could become the next key level if price breaks out.
Triggers
• A clean daily close above $0.040 with volume would be a strong bullish signal
• A breakdown below the ascending support would invalidate the pattern and likely lead to a retest of ~$0.013

JUP/USDT: Classic Inverse Head & Shoulders Breakout!🚀 JUP Inverse Head and Shoulder Breakout – 80% Potential Incoming?! 👀🔥
Hey Traders! If you're all about high-conviction plays and real alpha, smash that 👍 and tap Follow for more setups that actually deliver! 💹💯
JUP is breaking out of a textbook Inverse Head and Shoulders pattern on the 12H timeframe — signaling a strong bullish reversal after a long downtrend.
🟢 Pattern: Inverse H&S
📊 Breakout Confirmation: Neckline flipped into support
🎯 Target Zone: $1.05+
🛡️ Invalidation: Close below $0.534
Momentum is shifting, and bulls seem to be back in charge. If this pattern plays out fully, we’re looking at a potential 70%+ move from current levels.
Let the chart speak. Keep this one on your radar!

FORM/USDT: LONG SCALP SETUP!!🚀 FORM Bull Pennant Breakout – 15% Potential Incoming?! 👀🔥
Hey Traders! If you're all about high-conviction plays and real alpha, smash that 👍 and tap Follow for more setups that actually deliver! 💹💯
FORM is consolidating within a bullish pennant on the 1H chart after a strong 15% impulse move — classic continuation setup.
Price is hugging the triangle resistance and sitting above the 100 EMA, showing strength and reducing downside pressure.
📈 Entry: CMP and add more up to $2.83
🎯 Targets: $3.21 / $3.28 / $3.35
🛑 Stop-Loss: Below $2.78
📊 Risk-Reward: Excellent
💥 Bias: Bullish
📉 Leverage: Use low leverage (max 5x) for safer exposure
Keep your eyes on volume confirmation. A decisive move above the triangle could lead to another explosive leg up.
Agree with the setup? Drop your thoughts below! 👇

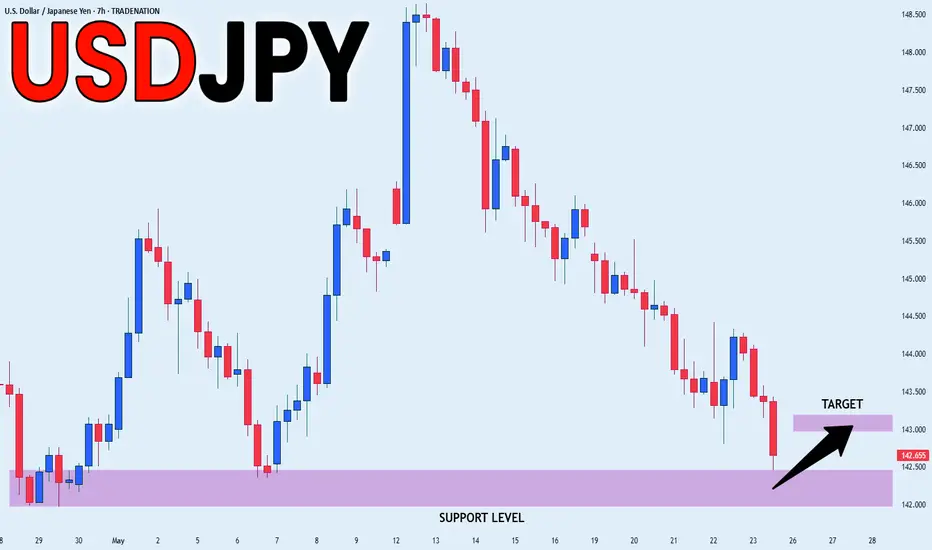
USD_JPY SUPPORT AHEAD|LONG|
✅USD_JPY is going down now
But a strong support level is ahead at 142.000
Thus I am expecting a rebound
And a move up towards the target of 143.000
LONG🚀
✅Like and subscribe to never miss a new idea!✅
Disclosure: I am part of Trade Nation's Influencer program and receive a monthly fee for using their TradingView charts in my analysis.
UNI – Long Spot Trade Setup Following Breakout and RetestUniswap (UNI) has recently broken out of resistance and successfully retested it as support, forming a strong bullish structure. If Ethereum (ETH) continues upward, UNI is likely to benefit from correlated momentum, potentially kicking off a larger rally.
🔹 Entry Zone:
$5.46 – $5.95 (post-breakout retest zone)
🎯 Take Profit Targets:
🥇 $7.50 – $8.00
🥈 $10.00 – $10.50
🛑 Stop Loss:
$4.10

Gold will continue to rise after a false breakdown The price is trying to consolidate above the key support zone 3290 - 3300. As part of the correction, gold makes a false breakdown and the market starts to show a bullish reaction.
The only confusing thing is the coming news. If the buyers are able to keep the price above 3300, the gold will surely continue its upward trend
Scenario: price consolidation above 3300 after a false breakdown of support will be a good signal for a swing impulse towards the intermediate high of 3345.

BTC traffic update and channel exit.As we can see, the BTC price is moving according to the previously mentioned rules. Here we can see how the price left channel number 1 at the top, and the increase after leaving the channel gave an upward movement at the level of the height of the channel itself.
In this situation, it is worth paying attention to channel number 2, from which we also previously got an exit at the top with a strong upward movement, currently we can see how the price is fighting with strong resistance at the level of $ 111,500, however, taking into account the height of channel number 2, we can mark the level of around $ 121,500 as another very strong resistance.

Will BTC endure and continue to reach further highs?As we can see, the BTC price has broken the previous ATH and established a new one at $ 109,886, but here we have to see that we had a slight breakout and the price immediately returned below the previous peak. At this point, we should observe whether it will positively break out from the previous peak and whether it will stay above it so that it can gather energy for a strong move towards strong resistance at $ 130,000.
However, if we see a correction, it may first go down to $ 101,500, then we can see support at $ 96,000, and then we may have a drop to around $ 87,000.
When we look at the Stoch RSI indicator, we will see that despite the current increases, the indicator remains around the middle of the range, which could potentially give room for another upward move.

DOG Rectangle + Structure AnalysisBITGET:DOGUSDT has been trading in a rectangle since June 2024, with well-defined boundaries.
After a downside deviation in March, it managed to reclaim the range and it's now attempting to break above $0.0040, a key S/R throughout its price history.
Key Levels to Watch
• $0.0018-$0.0020: Main demand zone
• $0.0040: Key S/R in place since May 2024
• $0.0058-$0.0060: Rectangle midline and previous S/R
• $0.0095-$0.0099: Main supply zone
• $0.0170: Measured rectangle target in case of a breakout
A successful daily close above $0.0040 should set the next target around ~$0.0060. Above that, there isn't much separating DOG from another retest of the main demand zone and ATH.

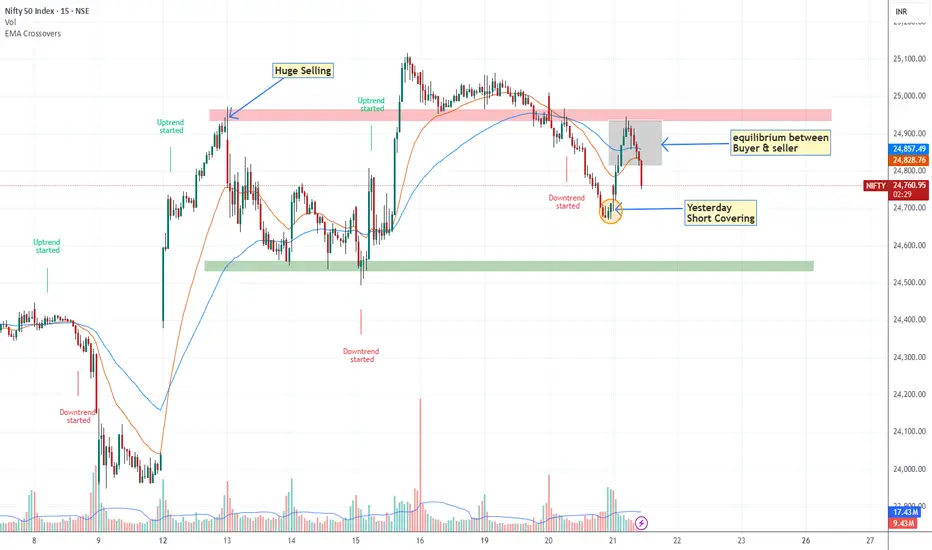
Nifty Might Range-Bound until it doesn't break 24950 levelToday 21/05/2025 around 11 O clock Nifty Tested 24950 the push was not above average volume driven that's why market was going to pullback although something absence of sellers comparatively had seen on 13 may u can see on chart but still it required to break 24950 level with good volume for being upward journey, until we expect market may range between 24500-25000.
strong Resistance- 24950-25000
Strong Support -24500
AAVEUSD 1D ChartHello everyone, I invite you to review the current situation of AAVE in the USD pair. When we enter the one-day interval, we can see how the AAVE price will see a return above the main upward trend line, but here we can see that we are still below the formed downward trend line, which in the event of further increases may prove to be a strong resistance.
Here we can see how the current rebound is fighting the resistance at $ 256, only when the level is positively tested, resistance will be still visible at the price of $ 290, this will be a strong resistance right next to the downward trend line, only a positive exit from the top and staying above this trend line can lead to movement towards resistance at $ 339.
Looking the other way, we can see that when the trend reverses, we first have a support zone from $ 233 to $ 211, however, if this zone is broken, we can see a quick return of the price to the support area at $ 174.
The Stoch RSI indicator shows that despite the current upward movement, there is still room for the upward movement to continue.

Google is about to rise by atleast 10% in coming days!I expect Google share price to rise by atleast 10% within the next 2 weeks.
Reasons;
Monthly is massively bullish.
Weekly is also bullish.
Daily is also bullish.

LINK (Chainlink) – Breakout Setup Aligned With BTC Macro MoveWith BTC on the verge of a new all-time high, the market is poised for high-beta altcoins like LINK to follow with strength. LINK is currently testing the 200-day EMA — a critical momentum indicator. If BTC confirms breakout and LINK holds this zone, it sets up a high-probability continuation play.
🔹 Entry Zone:
$16 (on confirmation of support at 200-day EMA)
🎯 Take Profit Targets:
🥇 $20 (prior range high / psychological resistance)
🥈 $25 (multi-month breakout level)
🥉 $30 (macro extension target)
🛑 Stop Loss:
Daily close below $14.50 (breakdown of EMA support and invalidation of current structure)

Xrp - Prepare for at least a +50% move!Xrp - CRYPTO:XRPUSD - will head much higher:
(click chart above to see the in depth analysis👆🏻)
Xrp has perfectly been respecting market structure lately and despite the significant volatility, the overall crypto market remains bullish. Especially Xrp is about to perform a bullish break and retest, which - if confirmed by bullish confirmation - could lead to a rally of about +50%.
Levels to watch: $3.0
Keep your long term vision!
Philip (BasicTrading)

BTC - Will the trend continue?Since the beginning of April, BTC has been on a notable upward trajectory, showing impressive strength with minimal retracements. This sustained momentum has captivated market participants and built a narrative of continued bullish pressure. Along this journey, BTC has carved out two distinct consolidation zones, periods of relative price stability, characterized by equal highs and lows. Each time, these consolidations were followed by a decisive breakout to the upside, reinforcing the prevailing bullish sentiment in the market.
Another consolidation phase
At the present moment, BTC appears to be entering yet another consolidation phase. The price is coiling, showing signs of compression that often precede significant moves. This naturally leads to the question: are we about to witness another breakout to the topside, continuing the pattern established over the past several weeks?
Bullish scenario
In a bullish scenario, a breakout to the upside would likely see BTC pushing towards the 106,000 level. This zone is a key target for traders watching in this consolidation. Should momentum carry the price beyond this threshold, Bitcoin would be well-positioned to challenge its all-time high near 109,000. A clean move through these resistance levels could spark a new wave of optimism, potentially attracting fresh capital into the market and confirming the strength of the current uptrend.
Bearish scenario
However, it’s important not to ignore the risks. The bearish scenario involves BTC breaking down below the current support zone, which sits around the 101,000 mark. A decisive move beneath this level would undermine the bullish structure and signal a shift in market sentiment. In this case, Bitcoin might find itself revisiting the 97,000 to 98,000 range, an area that previously acted as resistance during the last consolidation phase and may now serve as a potential support zone if tested from above.
Conclusion
In essence, the market is at a critical juncture. BTC’s recent behavior suggests a buildup toward a significant move, but the direction remains uncertain. Whether it continues its march toward new highs or corrects to retest lower levels, this period of consolidation is likely to define the next phase of Bitcoin’s trend. Traders and investors alike are watching closely, as the next breakout, up or down, could set the tone for the weeks to come.
Thanks for your support.
- Make sure to follow me so you don't miss out on the next analysis!
- Drop a like and leave a comment!
