Silver Finds Its Footing—Are the Bulls Back? (Elliott Waves)Silver rebounded quite aggressively in April, following Trump’s decision to impose a 90-day tariff pause. At the time, there was still a lot of uncertainty, so many investors turned to metals as a safe haven—particularly during periods of trade tensions.
More importantly, we can see silver forming five waves up from the 28.34 low. In Elliott Wave terms, when we see a strong directional move that can be counted in five waves, it often represents the beginning of a new trend. That means the current pause is likely just a correction, and more upside should follow.
The 31.00–31.50 area is a very interesting support zone for silver—an area from which we could see a rebound, possibly after a completed A-B-C setback from the 33.70 region.
Support

NZDJPY may end its rally with a correctionNZDJPY almost without pullbacks, with one impulse forms a strong fall. The potential is starting to run out and the market will need a breather. The current wave may test the zone of interest at 85.268 and move into the correction phase
The price is ready to test the strong support at 85.268, the limit level is most likely still in the market and may hold the support area and thus trigger a correction and pullback to 0.5 fibo
Scenario: fall to 85.268, false breakdown and rebound to the first zone of interest (imbalance) 86.500

$U $20 support, flagging in ascension Interesting setup here. Looks pretty good IMO. Software is a great name to look at in this market environment. It has a nice support at $20, even at large volume here it’s holding nicely so it shows relative strength. This name is definitely bullish long term. I’m in $21.5c for 2 weeks out, this is a high IV% name. Can run 10% in a day, 20% in a week, etc. We will see how it plays out.
WSL.

XRP – Long Swing Trade Setup Near Key SupportXRP is pulling back toward a major support zone around $2.25, a level that previously acted as a breakout region. With the market showing signs of rotating into strength across large caps, this could offer a solid risk-reward entry for a medium- to long-term swing trade.
🔹 Entry Zone:
$2.25 support zone
🎯 Take Profit Targets:
🥇 $2.60 – $2.75 (prior supply zone & range mid-point)
🥈 $3.15 – $3.40 (macro resistance / high timeframe target)
🛑 Stop Loss:
Just below $2.15 (invalidates the reclaim thesis & opens risk to deeper correction)

ONDO (Ondo Finance) – Long Swing Trade Setup Near Key SupportONDO is retracing alongside broader market weakness and is approaching a key support zone around $0.95, which previously acted as a breakout base. This area now presents a potential high-reward swing trade if buyers step in to defend the level.
🔹 Entry Zone:
$0.95 (critical horizontal support & potential demand zone)
🎯 Take Profit Targets:
🥇 $1.15 – $1.25 (prior local highs and resistance)
🥈 $1.40 – $1.55 (macro range extension)
🛑 Stop Loss:
Just below $0.83 (breakdown below previous structural low)

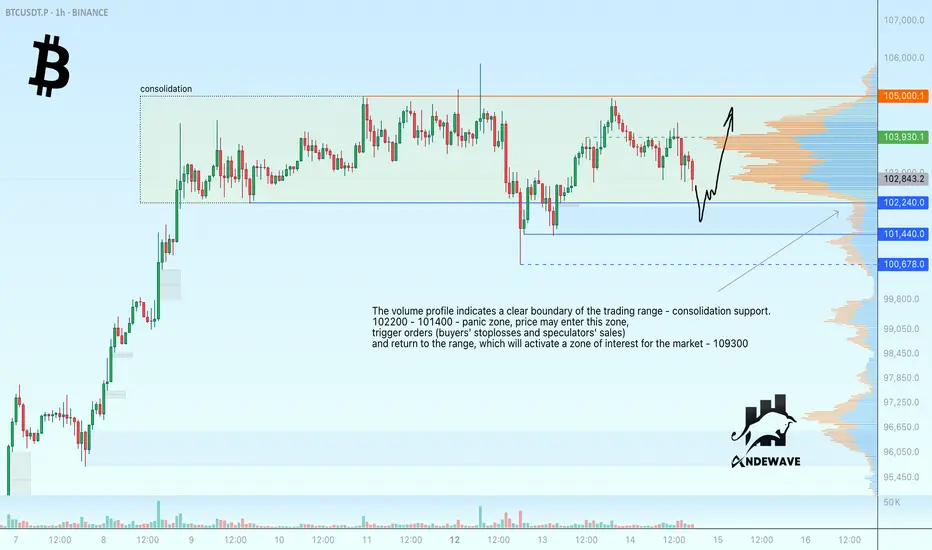
Bitcoin ready to test support before risingThe volume profile indicates a clear boundary of the trading range - consolidation support as a target for the current local movement.
102200 - 101400 - panic zone, price may enter this zone, provoke bids (buyers' stoplosses and speculators' sales) and return to the range, which will activate a zone of interest for the market - 103930.
Scenario: the price is trading inside the consolidation with clear boundaries - support and resistance. The price is aiming for the support within a bullish trend. False breakdown of support may trigger a rebound and growth. Target 103930 - 105000
Axie (AXS) Structure Analysis (1W - Log)After retesting the ~$2.0 demand zone, BINANCE:AXSUSDT broke out of its recent downtrend and could be headed for an attempt to reclaim the ~$4.0 S/R.
Key Levels to Watch
• ~$2.0: Demand zone dating back to May 2021, and current support. Any sustained break below it would invalidate any bullish TA.
• ~$4.0: Previous multi-year key support, and likely a strong resistance. Reclaiming it would flip the bias to bullish. It also aligns with the 200-day EMA, which has been very relevant for AXS in the past.
• ~$13.0: Multi-year S/R, and a reasonable target if ~$4.0 is reclaimed.
Still in a No-Trade Zone for me, until ~$4.0 is successfully reclaimed.

BTC - Will we repeat last year price action?Bitcoin (BTC) has recently been trading within a relatively wide range, fluctuating between the $108,000 and $74,000 levels. Over the past several months, the asset experienced a notable decline from its local high of $108,000 down to a low of around $74,000. However, since reaching that bottom, BTC has been on a recovery trajectory, climbing back up toward the $106,000 region as of May. This rebound has brought renewed optimism to the market, but the key question now arises: is this upward momentum sustainable, or is it merely another temporary relief rally within a larger consolidation phase?
To evaluate the potential sustainability of this move, it is insightful to compare the current price action with that of exactly one year ago. In the same May period last year, BTC was also trading within a defined range, between $73,000 and $56,000. The pattern that unfolded then may offer clues as to what might happen next.
At that time, Bitcoin formed a double top, a classic technical pattern that often signals weakening bullish momentum. This structure developed over two distinct peaks, let's call them Point 1 and Point 2. Following the double top formation, the market began to retrace, initiating a decline that led to the creation of Point 3. This low established a key trendline, marking the beginning of a longer-term structural setup.
After bouncing from Point 3, BTC managed to rally once more, approaching a new all-time high but falling just short. This rally formed what can be referred to as Point 4, and notably, this occurred in May, exactly where we are now on the calendar. However, this attempt to break to new highs ultimately failed. The market lost momentum, and BTC turned downward once again, culminating in another test of the established trendline. This next low, which we can label Point 5, occurred in July and served as the third touchpoint of the trendline, reinforcing its significance.
Fast forward to the present, and it appears that Bitcoin may be following a similar structural path. The current price action suggests that Points 1, 2, and 3 have already been formed in recent months. The bounce that we’re witnessing now could potentially be developing into Point 4, mirroring the rally seen last May. If history were to repeat or even slightly rhyme, we may be approaching a local high, after which the market could face renewed downward pressure.
Such a move would align with a third touch of the longer-term trendline, potentially occurring in the coming months, perhaps around July, just as it did the previous year. Furthermore, this prospective downside move would also serve to close a daily Fair Value Gap (FVG) that has remained largely unfilled, a technical factor that many traders are currently watching.
In summary, while the recent price recovery in Bitcoin is encouraging, a closer examination of past market structure and recurring seasonal patterns suggests caution. The market may be setting up for a local high in May, followed by a potential retracement that would once again validate key support levels and trendlines. Whether this scenario plays out in full remains to be seen, but the parallels with last year’s behavior are worth noting for any trader or investor closely monitoring the charts.
Thanks for your support.
- Make sure to follow me so you don't miss out on the next analysis!
- Drop a like and leave a comment!

Ripple Potential UpsidesHey Traders, in today's trading session we are monitoring XRP/USDT for a buying opportunity around 2.50 zone, XRP/USDT is trading in an uptrend and currently is in a correction phase in which it is approaching the trend at 2.50 support and resistance area.
Trade safe, Joe.

Solana - This just faked out literally everybody!Solana - CRYPTO:SOLUSD - just faked out literally everybody:
(click chart above to see the in depth analysis👆🏻)
Over the course of the past 25 days, Solana dropped a significant -30% and wiped out a ton of bulls before creating a complete reversal. Especially with the current horizontal support level, bulls are taking over again, offering us another major crypto trading opportunity.
Levels to watch: $120, $250
Keep your long term vision!
Philip (BasicTrading)

VIRTUALUSDT can derail support with momentumVIRTUAL is consolidating after the rally, but it cannot continue its growth yet. A descending triangle with a clear base support and a fourth retest relative to 1.877 is being formed, which in general only increases the chances of support breakout and decline
Scenario: if the compression of this format (within the descending triangle) continues and the price continues to compress to the support at 1.877, then in this case it will be possible to catch a breakout through a limit order. A sharp impulse is possible. As the first target I will wait for a decline to 0.5 fibo (1.73)

Bitcoin Flips $94K Into Support — Bullish Momentum BuildsStructure Strengthens:
Bitcoin's technical structure has improved significantly, with price now holding firmly above the $94,000 level — a former resistance that has flipped into solid support after multiple successful retests.
Bullish Trend Confirmation:
This move reinforces the ongoing bullish trend, driven by a broad bottoming formation from February to April and a clear series of higher lows since March.
Investor Confidence:
The consistent accumulation signals strong buying interest from long-term investors, suggesting that market participants are positioning for further upside.
Outlook & Targets:
As long as Bitcoin maintains levels above $94,000, the bullish outlook remains intact. The next near-term targets lie in the $110,000–$115,000 range.
Bitcoin appears well-positioned for the next leg of its rally. 🚀📈
#Bitcoin #BTC #Crypto #TechnicalAnalysis #BullishTrend #Support #Breakout #MarketUpdate #PriceAction #CryptoMarket

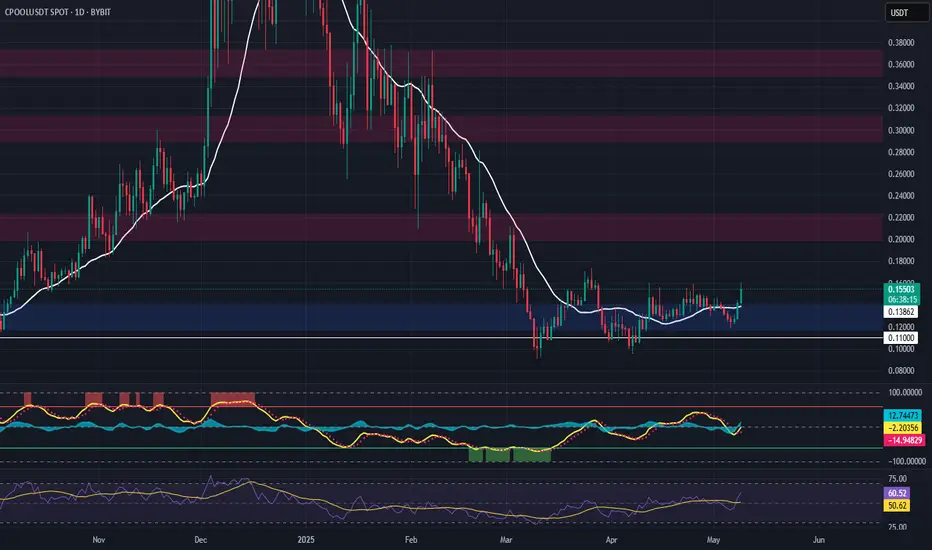
CPOOL (Clearpool) – Momentum Reversal Trade SetupCPOOL is flashing signs of a potential early trend reversal, supported by a strong bounce off a key support zone around $0.140. Price action suggests a reclaim of market structure, positioning this trade for a momentum shift with healthy upside targets.
🔹 Entry Zone:
Around $0.140 (support level)
🎯 Take Profit Targets:
🥇 $0.20 – $0.22
🥈 $0.29 – $0.31
🥉 $0.35 – $0.37
🛑 Stop Loss:
Daily close under $0.11
Support and Resistance Levels: A Beginner Trader's GuideSupport and Resistance Levels: A Beginner Trader's Guide
Hello!
If you’re just starting your journey in trading, you’ve probably already heard about "support" and "resistance." These terms might sound intimidating, but their essence is simple. Think of an asset’s price as a ball bouncing between a floor and a ceiling. The floor is support , and the ceiling is resistance . Let’s break down how this works and how to use these levels in your trading.
1. What Are Support and Resistance?
- Support is a price level where buyers (bulls) are strong enough to halt a decline.
→ Example: Suppose the GBP/USD price drops to resistance line multiple times but bounces back each time. This line is a strong support level.
- Resistance is a level where sellers (bears) take control, preventing the price from rising further.
Why is this important?
These levels help you anticipate where the price might reverse or continue moving. They’re like road signs on your chart!
2. How to Identify Support and Resistance on a Chart
Start by analyzing price history. Support and resistance levels form where the price has repeatedly stalled.
- Step 1: Open a daily or hourly chart . The larger the timeframe, the more significant the level.
- Step 2: Look for points where the price reversed . For example, lows (for support) and highs (for resistance).
- Step 3: Draw horizontal lines through these points.
→ Visual Example:
On the GBP/USD chart, the price tested the level multiple times and bounced. This is clear support. The resistance level, where upward momentum stalled, acts as resistance.
3. How to Trade Using Support and Resistance
There are two main scenarios: *bouncing off a level* and *breaking through a level*.
Scenario 1: Bouncing Off Support or Resistance
- If the price approaches support, consider opening a long position (buying), expecting a rebound.
- If the price nears resistance, consider opening a short position (selling), anticipating a drop.
Scenario 2: Breaking Through a Level
If the price breaks support or resistance with high volume, it’s a signal to act:
- Breaking resistance → Buy.
- Breaking support → Sell.
→ Example:
GBP/USD breaks above resistance at 2.01050. You enter a short position, placing a stop-loss below 2.04040 order-block.
4. Common Beginner Mistakes to Avoid
- Overloading the chart with lines . Don’t mark every minor swing—focus on key levels.
- Ignoring volume . A breakout without increasing volume is often a false signal.
- Impatience . The price may test a level repeatedly—wait for confirmation before trading.
5. Practice Is the Key to Success
1. Study historical data . Open past charts and practice identifying levels retrospectively.
2. Use a demo account . Test your strategies risk-free.
3. Keep a trading journal . Note why you chose specific levels and analyze your mistakes.
6.Conclusion
Support and resistance levels are your best allies in trading. They reveal market structure and guide your decisions. Don’t get discouraged if it feels challenging at first—practice will sharpen your intuition. Remember, even professionals make mistakes. Focus on risk management and continuous learning.
Good luck! You’ve got this!

GOOGL (Alphabet Inc.) – Medium-Term Position Trade SetupNASDAQ:GOOGL is showing strength as it revisits its previous all-time high, now aligning with the 50% Fibonacci retracement of the current wave. The price action suggests a bullish flip of resistance into support at the $153 zone, with clear signs of buyer defense—offering a compelling medium-term opportunity.
🔹 Entry Zone:
Around $153 (support zone)
🎯 Take Profit Targets:
🥇 $200
🥈 $230
🛑 Stop Loss:
Weekly close below $130

ETH is fighting in a strong resistance zone!Hello everyone, I invite you to review the current situation on ETH. When we enter the one-day interval, we can see how the ETH price came out on top from a strong downward trend.
Here we can see how the current bounce brought the movement closer to a very strong resistance zone from $ 2,090 to $ 2,310, in which we can currently observe a fight for further upward movement. Only when the price comes out on top, it can go towards resistance at $ 2,740, and then move towards strong resistance at $ 3,070.
Looking the other way, we can see that when the trend reverses, we first have support at $ 1,837, then a very strong support zone from $ 1,610 to $ 1,404 is visible, however, if this zone is broken, we can see a quick decline to the support area at $ 1,071.
On the RSI indicator we can see how strong the ETH price movement is visible intensively on the indicator and here we can see how we are approaching the upper limit, which could potentially slow down the movement or give a temporary relief.

AAPL – Long Trade Setup (Support-Based Reversal Opportunity)Apple (AAPL) is pulling back toward a key support zone between $197–$198, aligning with both previous structural support and potential demand zone behavior. This setup offers a favorable risk-to-reward profile for a swing long entry.
🔹 Entry Zone:
$197 – $198
🎯 Take Profit Targets:
🥇 $210 – $215
🥈 $225 – $233
🛑 Stop Loss:
Just below $190

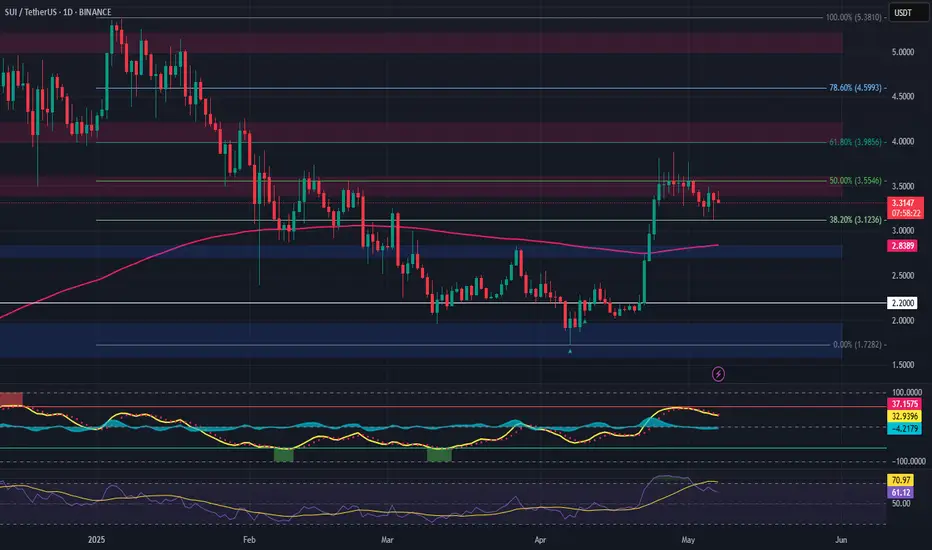
SUI – Long Trade Setup After Trend ReversalSUI has broken out of its downtrend, hitting all prior upside targets and now pulling back toward a key support area and the 200-day EMA, potentially forming a higher low—an ideal spot for re-entry.
🔹 Entry Zone:
Around $2.80
🎯 Take Profit Targets:
🥇 $3.40 – $3.60
🥈 $4.00 – $4.20
🥉 $5.00 – $5.20
🛑 Stop Loss:
Daily close below $2.20
📌 Strategy Notes:
Look for bullish confirmation (e.g., wick rejections, bullish engulfing candle) near $2.80
Structure remains intact as long as price holds above $2.20
EMA retests often precede strong continuation if trend strength remains
ADA (Cardano) – Long Spot Trade Setup at SupportCardano has pulled back to a key support zone around $0.66, providing a potential entry opportunity for a long spot position as the broader structure attempts to hold.
🔹 Entry Zone:
$0.66
🎯 Take Profit Targets:
🥇 $0.80 – $0.84
🥈 $0.98 – $1.02
🛑 Stop Loss:
Just below $0.59 (to protect against deeper breakdowns)

GMT Daily Analysis | Bearish Continuation Toward Key Support👀 Welcome to my Trading View Analysis and Trading Channel Here , we share the latest market analysis, trading signals, and key insights together .
Ready for smarter trades ? ⭐️
🧠 Technical Analysis of GMT Coin – Daily Timeframe
This analysis reviews the recent price behavior of GMT coin on the daily chart. Based on the current market structure, there are multiple technical signals suggesting the continuation of the downtrend and a possible entry into a consolidation phase.
1. 🚀 Sharp Uptrend Followed by a Correction Phase
Initially, GMT experienced a sharp bullish rally, accompanied by a noticeable surge in trading volume, pushing the price to higher levels. However, after the rally peaked, the price entered a corrective phase that still appears to be ongoing.
2. ❌ Breakdown of the Key $0.058 Support Level
One of the most critical developments during the correction was the breakdown of the $0.058 support zone. This level had previously acted as a strong support area. Its failure signals growing selling pressure and increases the likelihood of the downtrend continuing.
3. 📉 Bearish Reaction to the 3 SMA Indicator
During its downward movement, the price encountered the 3 SMA indicator (a combination of three Simple Moving Averages). The key observations are:
All recent candlesticks have closed below the SMA lines
This is considered a strong bearish confirmation in technical analysis
It also highlights the dominance of sellers at this stage of the market
4. 🛡 Major Support Area at $0.043
Given the ongoing bearish pressure, the $0.043 support level has become a critical area to watch. Historically, this level has successfully prevented further declines and may act as a strong support once again.
If the price reaches this zone, it may:
Show a supportive reaction (respect the level)
Enter a short-term consolidation range
Or potentially initiate a new bullish wave, depending on candlestick formations and trading volume around that level
✅ Final Summary:
The overall trend remains bearish for now
The break of $0.058 and candlestick closures below the 3 SMA confirm ongoing selling pressure
The $0.043 level is a critical support zone that could trigger a potential reversal or consolidation
🗞 Recent GMT Weekly Highlights
Here are the key developments from the past week in the GMT ecosystem:
1️⃣ 🔥 Buyback & Burn of 600M GMT Tokens
GMT DAO announced a massive buyback of 600 million tokens worth around $100M. After a community vote, these tokens may be burned — a move expected to reduce supply and potentially support price growth.
2️⃣ 👟 Adidas Partnership & NFT Sneakers
The STEPN project partnered with Adidas to launch 1,200 limited edition physical sneakers tied to NFTs. This collaboration aims to boost brand visibility and attract new users.
3️⃣ 🎁 Massive Community Airdrop
An additional 600 million GMT tokens will be distributed via airdrop to increase community engagement and encourage participation in DAO governance.
I love you all so much . 👀
don't forget about capital management and risk management .
Be careful with your positions . 🥇

MOG (Mog Coin) Bounce Trade Setup – Early Recovery in PlayMOG is showing early reversal signs by reclaiming a key HTF support zone and forming a higher low near the 21-day moving average. This indicates a potential momentum shift and a solid bounce opportunity if follow-through volume confirms.
🔹 Entry Zone:
$0.00000060
🎯 Take Profit Levels:
🥇 $0.00000084
🥈 $0.00000110
🛑 Stop Loss:
$0.00000050 (below structure, protects against invalidation)

#M30 BUYING MODULEIn this analysis we're focusing on M30 time frame for GOLD. Here we see clearly that price creates Bullish trendline and also price give respect to the trendline. According to price action and my analysis I'm expecting that price come back and retest my zone, and observe the reaction of price. If price give any bullish confirmation than we'll execute our trade. This is M30 time frame analysis once price reaches our zone switch to the lower time frame to find perfect entry point. Let's delve deeper into these levels and potential outcomes.
Always use stoploss for your trade.
Always use proper money management and proper risk to reward ratio.
This is my analysis.
#XAUUSD 30M Technical Analysis Expected Move.

#GBPJPY UPDATES AND ANALYSISGBPJPY 4H Chart Analysis
GBPJPY is exhibiting strong bullish structure on the 4H timeframe, with price currently forming higher lows and holding above a key ascending trendline. The marked demand zone around 189.94 has acted as a support area, suggesting potential accumulation before the next leg up.
A bullish continuation is anticipated with three structured targets aligned at:
Target 1: 191.773
Target 2: 193.320
Target 3: 194.832
The setup provides a favorable risk to reward scenario. A break and close below the demand zone and ascending trendline support would invalidate this bias. This is a higher time frame key levels. When price enters in our zone, look for confirmation in smaller time frame before executing your trades. Confirmation is key.
This just my analysis. Use proper stoploss and proper money management for your trade.
#GBPJPY 4H Technical Analysis Expected Move.
