EURUSD - Mark up for the rest of the weekAfter the CPI data was released today we had a lovely upside move. The move has caused us to trade into the previous weak higher timeframe high which I am hoping we can break and close above before the day is out.
I am now focusing on what kind of pullback we may get into out POI's. Because there is no buy side liquidity on the first POI I will need to see a structural shift on the 15min TF to confirm that internal structure swing to move back towards the upside.
If the 1st POI fails to hold I will be more aggressive with my secondary POI as that will be the premium discount price in order for us to move higher.
If that POI fails and we break the 4H structure swing then this could signal we are about to move lower.
If I can be of any assistance to anyone don't be shy to give me a message
Support_and_resistance

USD/JPY – Short-term bullish structure within a larger downtrendThe USD/JPY pair has been in a well-established downtrend on the daily timeframe, showing consistent weakness over recent weeks.
Daily timeframe
The pair recently bounced from a significant and well-respected support zone around the $140.00 level. This area has historically provided a strong base for price, and once again, it appears to be holding as reliable support. Although the overall daily trend remains bearish, this bounce introduces the potential for a short-term retracement or consolidation phase.
Clear Rising Trendline on the 4H Chart
Zooming into the 4-hour timeframe, the price action shows a notable shift in momentum. A clear rising trendline has formed, acting as a dynamic support level and guiding the pair higher in the short term. As long as this trendline remains intact and unbroken, the bullish bias on the 4H remains valid. This upward move suggests a corrective phase within the broader daily downtrend, supported by increasing demand at higher lows.
Approaching Key Resistance — FVG and 0.786 Fibonacci Level
The pair is currently approaching a key resistance area near the $145.50 level. This zone aligns with the 4-hour Fair Value Gap (FVG) left by the previous strong downward move and coincides with the 0.786 Fibonacci retracement level, measured from the most recent swing high to swing low. A few days ago, price action briefly tested the lower boundary of this FVG but failed to fully fill the imbalance. Given the current momentum, another attempt to fill the entire FVG and test the 0.786 Fibonacci level is likely. This confluence of technical factors creates a strong resistance zone that could trigger significant price reactions, potentially resuming the broader downtrend.
Target Levels — Where to Look for Reversal or Profit-Taking
A sensible short-term target would be the previous lower high around the $144.00 level. This zone may serve as an initial resistance or take-profit area before price challenges the $145.50 resistance region. Additionally, if the pair breaks below the rising trendline on the 4H, this $144.00 zone could become a support level from which the pair might attempt another move higher.
Conclusion
To summarize, the USD/JPY pair remains in a broader daily downtrend but has shown signs of short-term strength after bouncing from the $140.00 support zone. On the 4-hour timeframe, bullish momentum is evident, supported by a rising trendline and upward movement toward a significant resistance area. Traders should closely watch the $145.50 zone, as it represents a confluence of the FVG and 0.786 Fibonacci retracement — both of which could act as a strong ceiling for price. Until the rising trendline breaks, the short-term outlook remains cautiously bullish, but the medium-term bias leans bearish if resistance holds and selling pressure resumes.
Disclosure: I am part of Trade Nation's Influencer program and receive a monthly fee for using their TradingView charts in my analysis.
Thanks for your support.
- Make sure to follow me so you don't miss out on the next analysis!
- Drop a like and leave a comment!

GBPUSD - LongI missed the opportunity yesterday.
However, I've been lucky enough to get involved again as of this morning.
4H orderflow is still bullish so we will still look for the longs until the market tells us otherwise.
If I can help with anything do let me know

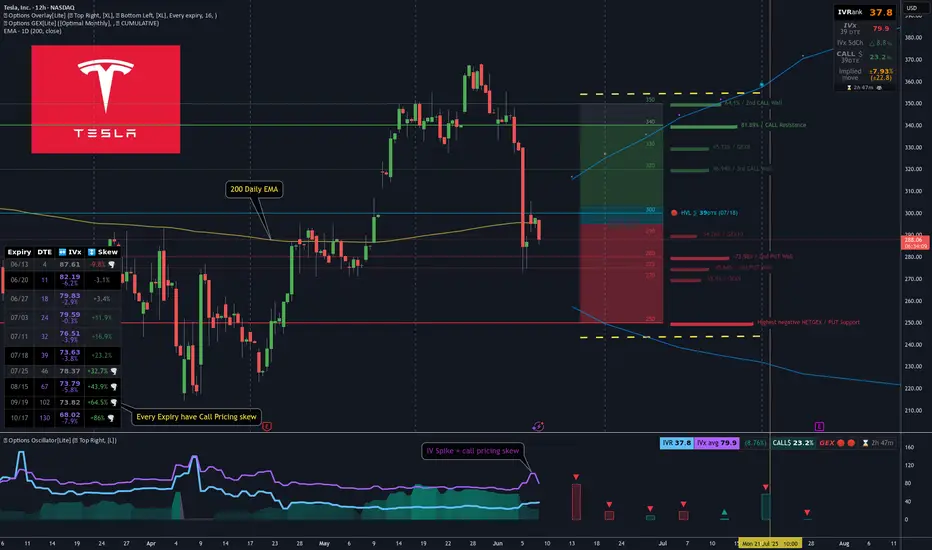
[GEX] TSLA Breakdown & Options Trade Idea for 39DTELast week, TSLA dropped hard, likely due to political tensions. Let’s not forget — just a month ago, their EVs were showcased at the White House entrance...
In the span of 30 hours, TSLA fell -22% (see red line below), while SPX barely reacted. Why? Because both realized and implied volatility dropped — remember VIX is around 17/18.
This sharp TSLA drop already seemed overdone, which helped fuel the +5% bounce on Friday.Most TSLA options positions are near-term and still show negative sentiment — but further expirations grow increasingly bullish.
🔍 If you use options GEX matrix , you’ll see the bearish hedging flow gradually turns more neutral-to-bullish.
Most cumulative support/resistance zones lie between 250–340, with spot currently just under the chop zone.
🧠 TSLA Trade Idea
It’s been a while since I posted a neutral Iron Condor, but TSLA might be an exception.
Despite last week’s IV spike, call pricing skew still dominates across expirations — as seen in our Options Overlay indicator.This tells me the market doesn’t fear TSLA crashing below 200. So, I’m aiming to capture premium on the July 18th expiry without day trading.
I’m thinking of something simple, well-manageable in either direction.To refine leg placement, I use visual GEX zones.
🐻🔴 Downside:
Strong put support at 250
Gradual support layers up to 280
🐂 🟢 Upside:
Target area: 340–350 for the July 18 expiry.
📅 Closing the Trade:I'll consider closing or adjusting at 21 DTE or when 50% max profit is hit — per TastyTrade’s studies.
🔁 Rolling Plan:IF short delta on one side drops below ~14 and price pulls away, I’ll roll the untested side to collect more credit.
🧑🏫 I’ll likely post trade management live in Discord for educational purposes.
~~~~~~~~~~~~~~~~~~~~~~~~~~~~~~~~~~~
🦋 Bonus Idea: TSLA Broken Wing Butterfly
If you think TSLA has more downside, a Put Broken Wing Butterfly — like the one shown in my previous YT video — is also a great way to structure this trade using the same GEX levels.
There’s no single way to use Gamma Exposure — it’s the most actionable hedging signal we have. Combine it with your knowledge of strategies and you can trade almost any scenario.
One thing’s for sure — this market moves faster than ever.A single day of internal conflict wiped -22% off TSLA…The next morning, the market already moved on, so as always:
Trade Safe Out There!
Once It Starts, It Might Be Too Late to Jump InHey guys, vacation’s over — time to get back behind the screen and into the reports. Naturally, I kicked things off with a deep dive into ETH options activity , because that’s where the real market whispers come from.
Here’s what stood out:
Over the past week, the biggest trading volume and open interest inflow came at strikes $3000–$3200–$3400 (see screenshot). Most of the action was in standalone calls , though a portion showed up as call spreads — meaning some players are betting on a controlled rally, not just blind bullishness.
The June 27, 2025 expiry remains the clear leader in open interest — still the date everyone’s watching.
With implied volatility at 67.9% , ETH has about a 68% probability (1σ) of reaching $2,950 by expiry — just 18 days away .
Key Takeaways:
$3000–$3200 looks totally within reach.
$3400 , though? Less than 15% chance based on current levels.
The sentiment among options traders is clearly bullish — they’re positioning for a breakout up from the sideways range, roughly by the full width of the pattern.

GOLD (XAU/USD) 4H Update GOLD (XAU/USD) 4H Update
Price is holding strong above the $3,250, $3,280 demand zone with trendline support intact.
A pullback into this area could trigger the next leg up toward $3,498.
Structure remains bullish unless this zone breaks.
Watching for a bounce Target: $3,499
DYRO, NFA

$ETH Pressing Resistance – A Break Above Could Fly!CRYPTOCAP:ETH Update
Ethereum is looking strong right now.
The price is pushing against a key resistance zone near $2,725 and forming higher lows showing pressure is building for a breakout.
If it breaks above this zone clearly, ETH could rally toward $4,000 (that’s a 55% upside).
Support to watch on the downside is around $2,465 if price pulls back.
Keep an eye on ETH, this breakout could be big.
DYOR, NFA
#ETH #Ethereum

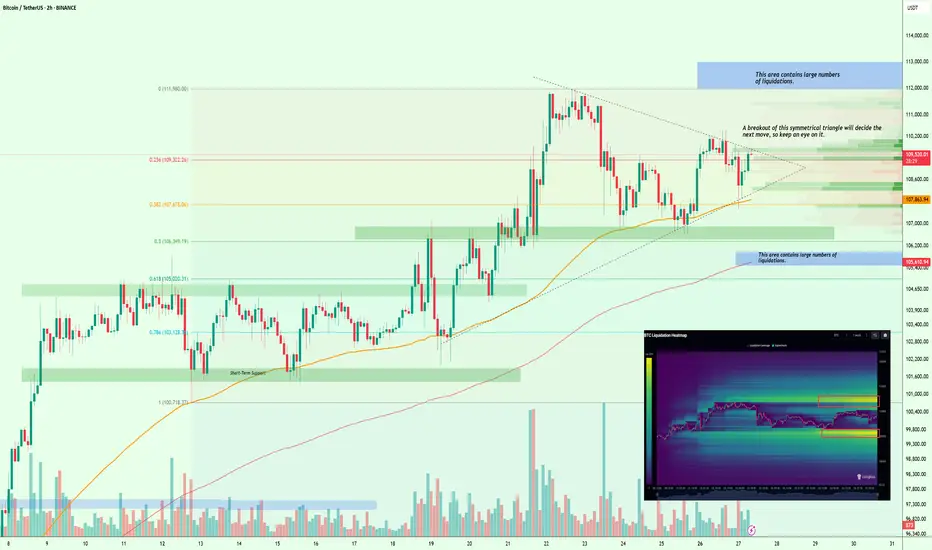
$BTC Liquidity Squeeze Incoming – Breakout or Breakdown?#Bitcoin
According to the liquidation heat map, CRYPTOCAP:BTC is building a large cluster of liquidations on both the upside and downside, creating some confusion in the market. However, the nearest major liquidation zone is around $112K–$113K, which increases the chances of a move toward that range.
Technically, BTC is forming a symmetrical triangle, and the breakout from this pattern will likely determine the next major move.
So keep a close eye on it.
I’ll keep you posted as things unfold.
If you find my updates helpful, don’t forget to like and follow for more!
Trade the Angle, Not the Chop: Angle of MA ExplainedNot all moving averages are created equal. While most traders rely on the slope of a moving average to gauge trend direction, the Angle of Moving Average script by Mango2Juice takes it a step further—literally measuring the angle of the MA to help filter out sideways markets and highlight trending conditions.
Let’s explore how this tool works, how we use it at Xuantify, and how it can sharpen your trend-following strategy.
🔍 What Is the Angle of Moving Average?
This indicator calculates the angle of a moving average (default: EMA 20) to determine whether the market is trending or ranging. It introduces a No Trade Zone , visually marked in gray, to signal when the angle is too flat—suggesting the market is consolidating.
Key Features:
Measures the slope of the moving average
Highlights ranging zones with a gray color
Helps filter out low-momentum conditions
Customizable MA type and length
🧠 How We Use It at Xuantify
We use the Angle of Moving Average as a trend filter —not a signal generator.
1. Trend Confirmation
We only take trades in the direction of a steep enough angle. If the MA is flat or in the gray zone, we stay out.
2. Entry Timing
We combine this with structure tools (like BOS/CHOCH) to time entries after the angle confirms a trend is underway.
🎨 Visual Cues That Matter
The script uses color to show when the market is:
Trending : Clear slope, colored line
Ranging : Flat slope, gray line (No Trade Zone)
This makes it easy to:
Avoid choppy markets
Focus on momentum-driven setups
Stay aligned with the dominant trend
⚙️ Settings That Matter
You can customize:
MA Type : EMA, SMA, etc.
MA Length : Default is 20
Angle Sensitivity : Adjust to define what counts as “flat”
⚙️ Higher timeframe alignment
You can look at HTFs for better and stronger entry and exit points.
Below a 1H and 4H chart where the 4H clearly adds strong buying power for a good long entry point.
🔗 Best Combinations with This Indicator
We pair the Angle of MA with:
Structure Tools – BOS/CHOCH for trend context
MACD 4C – For momentum confirmation
Volume Profile – To validate breakout strength
Fair Value Gaps (FVGs) – For sniper entries
⚠️ What to Watch Out For
This is a filter , not a signal. It won’t tell you when to enter or exit—it tells you when not to trade . Use it with price action and structure for best results.
🚀 Final Thoughts
If you’re tired of getting chopped up in sideways markets, the Angle of Moving Average is a simple but powerful filter. It helps you stay out of low-probability trades and focus on trending opportunities.
Try it, tweak it, and see how it fits into your system.

Higher High Higher Low intact!BFBIO Closed at 185.09 (25-05-2025)
Important to Cross & Sustain 188 - 189
o Monthly basis; only then it may move towards
215+
On the flip side, Important Support seems to be
around 164 - 169 and then 156 - 157

BTC - Can BTC push past $109k in this rising channel?Bitcoin has been trading within a clearly defined upward channel since the beginning of April. This rising channel is characterized by three touchpoints on both the upper and lower trendlines, indicating a consistent pattern of price movement within these boundaries.
Approaching key resistance
Currently, BTC is approaching a critical resistance level near the $109,000 mark, which coincides with its previous all-time high. This level represents a significant psychological and technical barrier, as it was the peak of the last major bull cycle. The price is now testing this resistance while still remaining within the rising channel. The confluence of the upper channel resistance and the historical all-time high makes this a decisive moment for Bitcoin's price action.
Bullish breakout
A rejection from this resistance zone could lead to a temporary pullback, potentially towards the lower boundary of the rising channel. This would not necessarily signal the end of the bullish trend, but rather a healthy consolidation within the established structure. However, a confirmed breakout above the $109,000 level, especially if supported by strong volume and bullish momentum, would likely signal a significant shift in market dynamics. Such a breakout would validate the strength of the current uptrend and could open the door for new all-time highs. In that scenario, the $109,000 level would likely flip from resistance to support, becoming a crucial area for bulls to defend on any future retests.
Bearish breakout
On the downside, traders should also be aware of the implications of a breakdown below the rising channel. The lower boundary of the channel, currently located around $104,000, is an important technical level to watch. A decisive break below this level could indicate a loss of short-term bullish momentum and may trigger a deeper retracement. In such a case, BTC would likely target the imbalance zone between $97,500 and $100,500, a region where price moved rapidly in the past without establishing strong support or resistance. This zone could serve as a critical area for buyers to step in and attempt to reestablish bullish control, potentially setting the stage for another rally toward the $109,000 resistance and a renewed attempt at a breakout.
Conclusion
In summary, Bitcoin is currently at a pivotal juncture. The upward channel that has guided price action since April remains intact, but BTC is now confronting a major resistance zone at its previous all-time high. Whether price breaks through to new highs or experiences a pullback will depend on the strength of market momentum and the behavior of buyers and sellers at these key levels. Traders and investors should remain vigilant and prepared for both scenarios, as the next move could set the tone for Bitcoin’s trajectory in the coming weeks.
Thanks for your support.
- Make sure to follow me so you don't miss out on the next analysis!
- Drop a like and leave a comment!

EURGBP: Potential sell setup towards 0.8500?OANDA:EURGBP has reached a notable resistance level, an area that has been a clear turning point in the past, leading to some notable reversals. Given this, there is once again potential for a bearish reaction if price action confirms rejection, such as a bearish engulfing candle, long upper wicks or increased selling volume.
If the resistance level holds, I anticipate a downward move toward 0.8500 , which for me is quite an achievable target now.
But if the price breaks above this zone and sustains above it, the bearish outlook may be invalidated, leading to further upside.
Just my take on support and resistance zones, not financial advice. Always confirm your setups and trade with solid risk management.

EURJPY Analysis: Range Bounces & BreakoutHello traders!
EURJPY is in a daily range and is offering three trading scenarios.
The first scenario suggests the pair may react bearishly from the currently approached zone, setting up a bounce opportunity that could drive price lower toward the 162.130 area.
The second scenario anticipates a bounce toward the 158.400 area, if price reaches the support zone of the range.
The third scenario anticipates a breakout above the resistance zone, followed by a retest, which could present a strong opportunity for continuation toward the 169.300 area.
Discretionary Trading: Where Experience Becomes the Edge
Discretionary trading is all about making decisions based on what you see, what you feel, and what you've learned through experience. Unlike systematic strategies that rely on fixed rules or algorithms, discretionary traders use their judgment to read the market in real time. It's a skill that can't be rushed, because it's built on screen time, pattern recognition, and the ability to stay calm under pressure.
There's no shortcut here. You need to see enough market conditions, wins, and losses to build that intuition—the kind that tells you when to pull the trigger or sit on your hands. Charts might look the same, but context changes everything, and that's something only experience can teach you.
At the end of the day, discretionary trading is an art, refined over time, sharpened through mistakes, and driven by instinct. It's not for everyone, but for those who've put in the work, it can be a powerful way to trade.

EURNZD Analysis: Bounce & BreakoutHello traders!
EURNZD is in a 1h range and is offering two trading scenarios.
The first scenario suggests the pair may react bearishly from the resistance zone, setting up a bounce opportunity that could drive price lower toward the 1.90000 area.
The second scenario anticipates a breakout above the resistance zone, followed by a retest, which could present a strong opportunity for continuation toward the 1.92000 area.
Discretionary Trading: Where Experience Becomes the Edge
Discretionary trading is all about making decisions based on what you see, what you feel, and what you've learned through experience. Unlike systematic strategies that rely on fixed rules or algorithms, discretionary traders use their judgment to read the market in real time. It's a skill that can't be rushed, because it's built on screen time, pattern recognition, and the ability to stay calm under pressure.
There's no shortcut here. You need to see enough market conditions, wins, and losses to build that intuition—the kind that tells you when to pull the trigger or sit on your hands. Charts might look the same, but context changes everything, and that's something only experience can teach you.
At the end of the day, discretionary trading is an art, refined over time, sharpened through mistakes, and driven by instinct. It's not for everyone, but for those who've put in the work, it can be a powerful way to trade.

EURGBP Analysis: Two Daily POIsHello traders!
EURGBP is offering two trading scenarios on the daily timeframe.
The first scenario suggests the pair may react bullishly from the next zone, setting up a bounce opportunity that could drive price higher toward the 0.84400 area.
The second scenario anticipates a bounce toward the 0.83800 area, where a mean reversion setup may come into play (if buyers step in and price action confirms bullish intent near that support).
Discretionary Trading: Where Experience Becomes the Edge
Discretionary trading is all about making decisions based on what you see, what you feel, and what you've learned through experience. Unlike systematic strategies that rely on fixed rules or algorithms, discretionary traders use their judgment to read the market in real time. It's a skill that can't be rushed, because it's built on screen time, pattern recognition, and the ability to stay calm under pressure.
There's no shortcut here. You need to see enough market conditions, wins, and losses to build that intuition—the kind that tells you when to pull the trigger or sit on your hands. Charts might look the same, but context changes everything, and that's something only experience can teach you.
At the end of the day, discretionary trading is an art, refined over time, sharpened through mistakes, and driven by instinct. It's not for everyone, but for those who've put in the work, it can be a powerful way to trade.

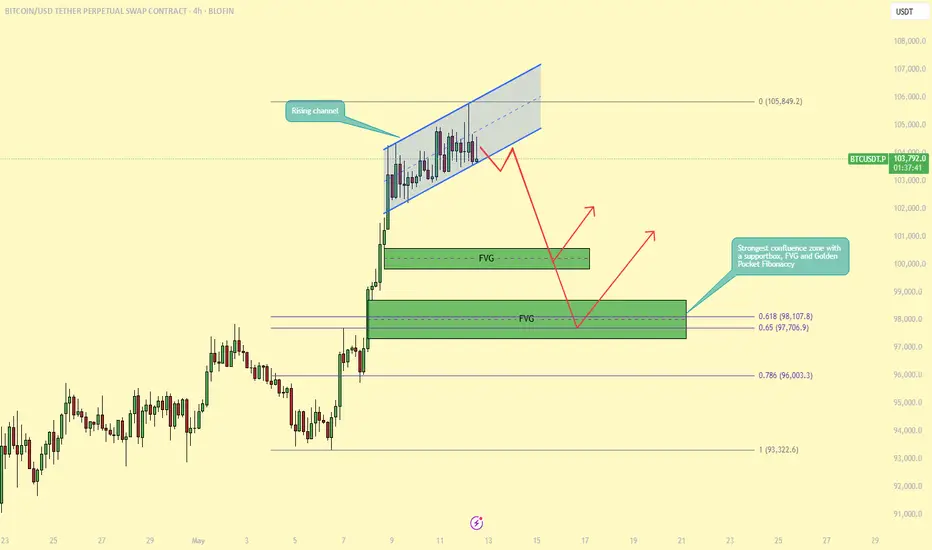
BTC Approaches All-Time High — But Signs of Weakness Emerge!BTC is once again approaching its all-time high (ATH) on the daily timeframe, generating excitement across the market. However, a closer look at the lower timeframes reveals signs of potential exhaustion as BTC encounters strong resistance. This suggests a pullback could occur before any continuation higher.
On the 4-hour and 1-hour charts, BTC is currently trading within a rising channel, which is often considered a bearish continuation pattern, especially when it forms directly below a key resistance level like the ATH. Price action within this structure is starting to lose momentum, and the presence of bearish divergences and decreasing volume further supports the likelihood of a near-term correction.
Where Could We Buy the Dip?
A pullback may offer a strategic entry opportunity for traders looking to ride the next leg up. Notably, two fair value gaps (FVGs) were created during the recent upward move. The first FVG could provide a minor bounce, but the second one is more compelling for a higher-probability long setup.
This second FVG aligns with a well-established support zone and coincides with the Golden Pocket of the Fibonacci retracement (between the 0.618 and 0.65 levels). This confluence of technical factors makes it a strong area of interest for bulls, and a potential springboard for price to retest, and possibly break, the ATH.
In summary, while BTC is showing strength on the higher timeframes, lower timeframe patterns suggest that a healthy correction is likely. Patience and proper level selection will be key. Watching how price reacts around the second FVG and the Golden Pocket zone may present one of the best opportunities for re-entry.
-------------------------------
Thanks for your support.
- Make sure to follow me so you don't miss out on the next analysis!
- Drop a like and leave a comment!
USDCHF Analysis: Break & Retest or Mean Reversion?Hello traders!
USDCHF is offering two trading scenarios on the daily timeframe.
The first scenario suggests the pair may react bearishly from the resistance zone, setting up a break-and-retest opportunity that could drive price lower toward the 0.80001 area.
The second scenario anticipates a bounce toward the 0.89100 region, where a mean reversion setup may come into play (if sellers step in and price action confirms bearish intent near that resistance).
Discretionary Trading: Where Experience Becomes the Edge
Discretionary trading is all about making decisions based on what you see, what you feel, and what you've learned through experience. Unlike systematic strategies that rely on fixed rules or algorithms, discretionary traders use their judgment to read the market in real time. It's a skill that can't be rushed, because it's built on screen time, pattern recognition, and the ability to stay calm under pressure.
There's no shortcut here. You need to see enough market conditions, wins, and losses to build that intuition—the kind that tells you when to pull the trigger or sit on your hands. Charts might look the same, but context changes everything, and that's something only experience can teach you.
At the end of the day, discretionary trading is an art, refined over time, sharpened through mistakes, and driven by instinct. It's not for everyone, but for those who've put in the work, it can be a powerful way to trade.

USDCAD Analysis: Three Bounce ScenariosHello traders!
USDCAD is offering three trading scenarios on the daily timeframe.
The first scenario suggests the pair may react bullishly from the currently approached zone, setting up a bounce opportunity that could drive price higher toward the 1.41600 area.
The second scenario anticipates a bounce toward the 1.37586 region, where a mean reversion setup may come into play (if buyers step in and price action confirms bullish intent near that support).
The third scenario anticipates a bounce toward the 1.34150 region, where a mean reversion setup may come into play (if buyers step in and price action confirms bullish intent near that support).
Discretionary Trading: Where Experience Becomes the Edge
Discretionary trading is all about making decisions based on what you see, what you feel, and what you've learned through experience. Unlike systematic strategies that rely on fixed rules or algorithms, discretionary traders use their judgment to read the market in real time. It's a skill that can't be rushed, because it's built on screen time, pattern recognition, and the ability to stay calm under pressure.
There's no shortcut here. You need to see enough market conditions, wins, and losses to build that intuition—the kind that tells you when to pull the trigger or sit on your hands. Charts might look the same, but context changes everything, and that's something only experience can teach you.
At the end of the day, discretionary trading is an art, refined over time, sharpened through mistakes, and driven by instinct. It's not for everyone, but for those who've put in the work, it can be a powerful way to trade.

US DOLLAR Analysis: Bullish Momentum Building?TVC:DXY is finally showing signs of stabilization. The index has successfully rejected a key support level, an area where price has historically attracted strong buying interest. This level closely aligns with the psychological $100 mark, which has once again acted as a pivotal point for market participants, reinforcing its relevance as a key technical level.
The recent price action confirms bullish interest, as evidenced by a strong rejection pattern within the zone, with long lower wicks and bullish follow-through candles. The support zone held firm, and buyers have stepped in, initiating an upward move.
Now that price has bounced from this level, the probability of a continued rally increases. If the bullish momentum sustains, the price could move toward the 102.500 level, a logical near-term target based on previous structure and minor resistance.
However, a failure to maintain above the 100.00 handle or a sudden shift in sentiment could still pose downside risks. A confirmed breakdown below the green support zone would invalidate this bullish outlook and potentially open the door for further declines.
Remember, always confirm your setups and use proper risk management.

Bitcoin Breaks Trendline-Is $109k Next?Technical Analysis: Ascending Channel Pattern
The asset is exhibiting an ascending channel pattern, indicative of sustained bullish momentum. Key observations include:
- Channel Boundaries: The price has consistently respected the channel's upper and lower boundaries, forming higher highs and higher lows.
- Breakout and Retest: Following a strong momentum breakout, the price is potentially retesting a key support level, previously acting as resistance.
- Support Zone: If buyers confirm support at this level, it may signal a continuation of the uptrend, targeting the upper boundary of the channel at $109,000.
Key Monitoring Points:
- Bullish Confirmation Signals: Look for bullish engulfing candles, strong wicks rejecting the support zone, or increased buying volume to confirm long positions.
- Risk Management: Failure to hold support could signal a bearish shift, emphasizing the importance of monitoring price action and adjusting strategies accordingly.

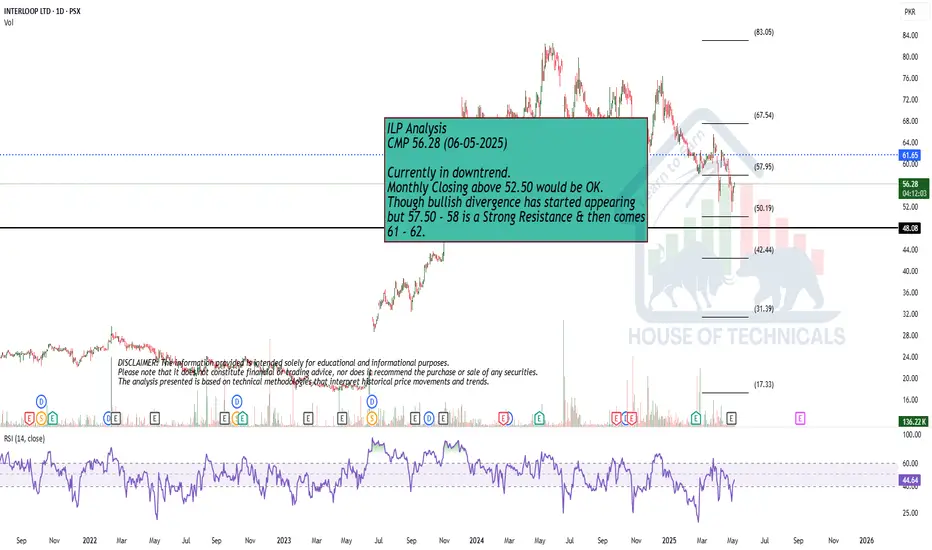
Currently in downtrend.Currently in downtrend.
Monthly Closing above 52.50 would be OK.
Though bullish divergence has started appearing
but 57.50 - 58 is a Strong Resistance & then comes
61 - 62.

GOLD Technical Analysis - Deeper Pullback in PlayOANDA:XAUUSD remains within a broader ascending channel, but recent price action suggests that the market is undergoing a deeper corrective phase. Following a prolonged bullish rally, price appears overextended and is now pulling back more decisively.
This correction aligns with expectations for a healthy retracement after such strong upward momentum. I anticipate that the pullback will extend further toward the $3,160 level, a key technical level defined by the confluence of horizontal support, ascending trendline support, and the 0.618 Fibonacci retracement of the latest bullish impulse.
This zone will be critical for determining whether the broader bullish structure remains intact. If price holds at this level and shows signs of reversal, it may present a strong re-entry opportunity for buyers. However, a decisive break below this zone would invalidate the current bullish structure and open the door to a deeper correction.
Always confirm your setups and trade with a proper risk management.
Best of luck!
