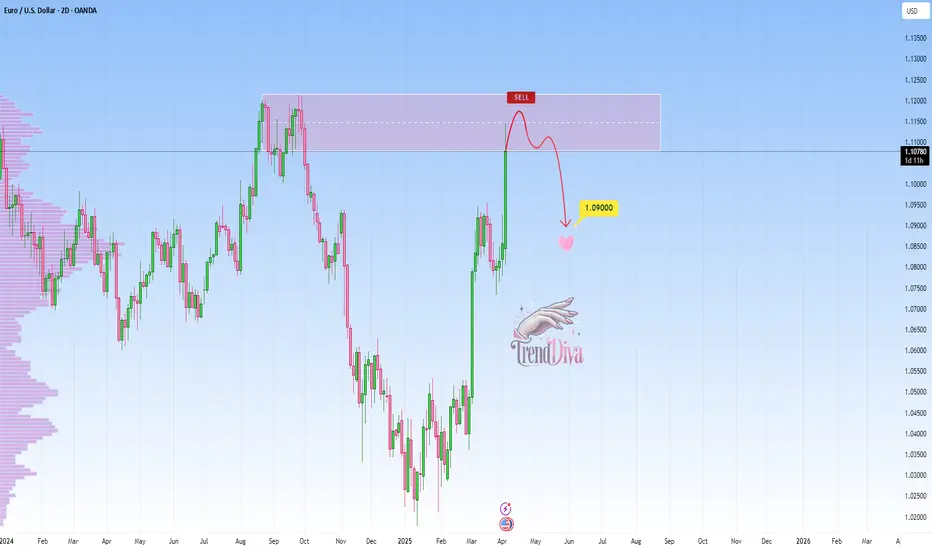
EURUSD at Major Resistance: Will it Drop To 1.09000?OANDA:EURUSD reached a major resistance level that has previously acted as a strong barrier, triggering bearish momentum in the past. This zone also aligns with prior supply areas where sellers have stepped in, making it a potential point of interest for those looking for short opportunities. Given its historical significance, how price reacts here could set the tone for the next move.
If bearish signals emerge, such as rejection wicks, bearish candlestick patterns, or signs of weakening bullish pressure, I anticipate a move toward the 1.09000 level. However, a clear breakout above this resistance could challenge the bearish outlook and open the door for further upside. It's a pivotal area where price action will likely provide clearer clues on the next direction.
Just my take on support and resistance zones, not financial advice. Always confirm your setups and trade with a proper risk management.
Best of luck!
Support_and_resistance
AUDCAD Discretionary Analysis: Next stop? Rock bottomIt’s more of a sixth sense (like when you just know your girlfriend's about to cancel plans). AUDCAD’s giving off that "Next stop? Rock bottom" kind of energy. I see it dropping hard, like it missed the elevator and took the shaft instead. If I’m right, I’ll be looking at some solid trades to take. If I’m wrong, well, I’ll just grab a coffee and wait for the next pair to make its move.
Just my opinion, not financial advice.

BITCOIN Outlook: Watch for a Drop Toward $85100COINBASE:BTCUSD has reached a key resistance level, an area that has been a key point of interest where sellers have regained control, leading to notable reversals in the past. Given this, there is potential for a bearish reaction if price action confirms rejection, such as a bearish engulfing candle, long upper wicks or increased selling volume.
If the resistance level holds, I anticipate a downward move toward 85,100$, which represents a logical target based on previous price behavior and market structure.
However, if the price breaks above this zone and sustains above it, the bearish outlook may be invalidated, leading to further upside.
Just my take on support and resistance zones, not financial advice. Always confirm your setups and trade with solid risk management.

GBPUSD Discretionary Analysis: Going Up Like TariffsI’m not entirely sure, but something(or some news) tells me GBPUSD is heading up like tariffs – quick and sharp. If not, guess it got delayed at the border. Profit if I’m right, lesson if I’m wrong!
Just my opinion, not financial advice.

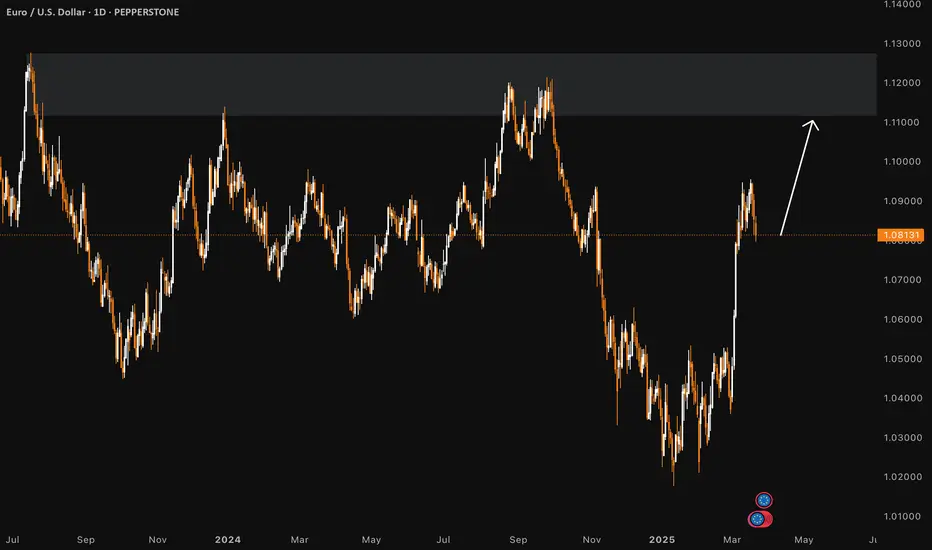
EURUSD Discretional Analysis: It's Going Up, BroIt's more of a gut feeling; I think it's headed up. If I'm right I'll make some money and if I'm wrong I'll lose some money.
Just my opinion, not financial advice.
NZDUSD Discretionary Analysis: No Parachute, Just GravityNo deep analysis here, just think it’ll fall without a parachute. If I’m right, I make some, if I’m not, I’ll just grab a coffee and wait for the next pair to make its move.
Just my opinion, not financial advice.

AUDCAD Discretionary Analysis: Taking the Elevator DownIt’s more of a sixth sense(like when you just know the milk is bad before you smell it). I think it’s headed down, like an elevator with a broken cable . If I’m right, I’ll make some money. If I’m wrong, well… guess I’ll take the stairs next time.
Just my opinion, not financial advice.

GOLD Technical Analysis - Correction Incoming?OANDA:XAUUSD is trading within a well-defined ascending channel, with price action now testing the upper boundary. This level could act as dynamic resistance, and a rejection here could trigger a corrective move toward the 3,035 support zone.
If buyers defend this support, the bullish structure remains intact, with a potential move back toward higher levels. However, if price breaks below this zone, a deeper pullback toward the lower boundary of the channel could come into play.
Monitoring candlestick patterns and volume at this critical zone is essential for identifying buying opportunities. Proper risk management is advised, always confirm your setups and trade with solid risk management.
If you have any thoughts on this setup or additional insights, drop them in the comments!

AUDUSD Discretional Analysis: It's Going Down, BroI don't know man, I have a feeling it's gonna go down. If I'm right I'll make some money and if I'm wrong I'll lose some money.
Just my opinion, not financial advice.

ALUMINIUM Discretionary Analysis: Sinking Like the TitanicI’m not entirely sure, but my gut says aluminium will sink even lower, faster than the Titanic. If not, guess it learned to float. Profit if I’m right, lesson if I’m wrong!
Just my opinion, not financial advice.

LEAP: GBPUSD Week 14 Swing Zone/LevelsWe'll stick with the same calculations as last week and before.
Price should follow the same logic as any mathematical principle—calculable, predictable, and consistent. The key variables are the broader market factors and the strength of the trend.
With that in mind, swing zones and levels are marked on the chart, and price will ultimately decide between option A or B.

EURJPY Approaching Key Resistance — Potential Sell SetupOANDA:EURJPY is approaching a key resistance level, an area that has been a key point of interest where sellers have regained control, leading to notable reversals in the past. Given this, there is potential for a bearish reaction if price action confirms rejection, such as a bearish engulfing candle, long upper wicks or increased selling volume.
If the resistance level holds, I anticipate a downward move toward 161.20, which represents a logical target based on previous price behavior and market structure.
However, if the price breaks above this zone and sustains above it, the bearish outlook may be invalidated, opening the door for further upside.
Just my take on support and resistance zones—not financial advice. Always confirm your setups and trade with solid risk management.
Best of luck!

NZDJPY Approaching Key Resistance — Potential Sell SetupOANDA:NZDJPY is approaching a key resistance zone, a level where sellers have consistently stepped in, leading to notable bearish reversals in the past. This area is marked by strong selling pressure, increasing the likelihood of a bearish move if sellers regain control.
The current price action suggests that if the pair confirms resistance through signals like bearish engulfing candles, long upper wicks, or increased selling volume, we could see a downward move toward 86.100, which represents a logical target based on previous price behavior and market structure.
However, if the price breaks above this zone and sustains, the bearish outlook may be invalidated, opening the door for further upside.
Just my take on support and resistance zones—not financial advice. Always confirm your setups and trade with solid risk management.
Best of luck!

NZDUSD Discretional Analysis: It’s Gonna Drop, BroNo deep analysis here, just think it’ll go lower. If I’m right, I make some, if not, I lose.
Just my opinion, not financial advice.

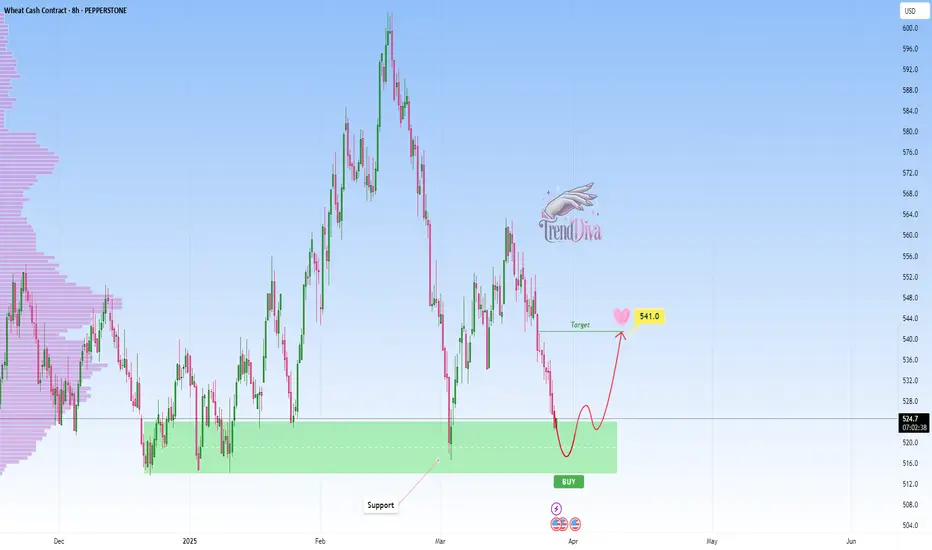
WHEAT at Key Support Level - Will Price Rebound to 541$?PEPPERSTONE:WHEAT has reached a major support level, an area where buyers have previously shown strong interest. This area has previously acted as a key demand zone, increasing the likelihood of a bounce if buyers step in.
A bullish confirmation, such as a strong rejection pattern, bullish engulfing candles, or long lower wicks, would strengthen the case for a move higher. If buyers step in, the price could rally toward the 541$ target. However, a decisive breakdown below this support would invalidate the bullish scenario and could lead to further downside.
This is not financial advice but rather how I approach support/resistance zones. Remember, always wait for confirmation, like a rejection candle or volume spike before jumping in.
Best of luck , TrendDiva
EURJPY Discretional Analysis: It's Gonna Go UpHonestly, I can’t fully explain it, but my intuition says it’s gonna go up. If I’m right, I’ll make a profit, and if not, I’ll take the loss and move on to the next trade.
Just my opinion, not financial advice.

CADCHF Discretionary Analysis: We're heading north!I don’t know how to explain it, but everything in me says, “this is going up!” 🚀 If I’m right—sweet profits! 💰 If not, I’ll take the loss like a champ and move on.
Just my opinion, not financial advice.

JPY/USD - Will we make a strong bounce?The JPY/USD is in a downward channel. Will it find support around 0.006 and rebound, or will it break below this key level?
The pair has nearly reached a major support zone—an area where buyers have previously shown strong interest. This level has historically acted as both strong resistance and support, increasing the likelihood of a bounce if buyers step in.
What do we want to see?
For a continuation to the upside, we need this level to hold as support. A bullish engulfing candle could signal a potential reversal.
If JPY/USD is to move lower, we need a clear break below support with high volume to confirm the breakout. In that case, lower prices could follow.
Thanks for your support.
- Make sure to follow me so you don't miss out on the next analysis!
- Drop a like and leave a comment!

SPY Technical Outlook - Will Buyers Step In?AMEX:SPY is experiencing a corrective move after rejecting the upper boundary of the ascending channel. This rejection led to increased selling pressure, bringing price back to the lower boundary of the channel, where buyers may step in to defend the trendline support.
If the price holds at this dynamic support level, a bullish reaction could send AMEX:SPY toward the midline of the channel, with the next target around 607.00. Holding above this level would reinforce the bullish trend structure and increase the probability of continuation toward the upper boundary of the channel.
However, a breakdown below the trendline support would weaken the bullish outlook and open the door for further downside. Monitoring price action, volume, and confirmation signals will be crucial in determining the next move.

META at Trendline Support - Will Buyers Push Toward $696?NASDAQ:META is currently undergoing a corrective phase following a sharp rejection at the upper boundary of its ascending channel. The recent pullback has driven the price back toward the lower boundary of the channel, where buyers are now looking to step in.
If buyers manage to defend this support level, we could see a move toward the midline of the channel, with the next key target at $696. A break above this midline would confirm the continuation of the bullish trend, potentially bringing the price back toward the upper boundary.
However, a failure to hold trendline support could weaken the bullish outlook, leading to a potential breakdown and further downside pressure. Price action near this critical zone will be key in determining the next directional move.
Traders should monitor candlestick formations and volume for confirmation. As always, managing risk effectively is essential when trading this setup.
If you have any thoughts on this setup or additional insights, drop them in the comments!

GOLD in a Bullish Flag – Breakout Incoming?OANDA:XAUUSD is undergoing a corrective move as it tests the lower boundary of the ascending channel, which serves as dynamic trendline support. The structure aligns with a bullish flag formation, indicating the potential for a continuation to the upside if buyers step in.
A successful rebound from this level could lead to a move toward the midline of the channel, with the next target at 3,100, aligning with the upper boundary of the channel. This scenario would preserve the broader bullish trend.
A confirmed breakdown below the trendline support, however, would invalidate the bullish outlook and open the door for further downside.
Monitoring candlestick patterns and volume at this critical zone is essential for identifying buying opportunities. Proper risk management is advised, always confirm your setups and trade with solid risk management.
If you have any thoughts on this setup or additional insights, drop them in the comments!

Dow Jones at trendline support: Will it bounce to 44,812$?CAPITALCOM:US30 is undergoing a corrective pullback after forming a double top near the upper boundary of the ascending channel. The rejection from this resistance zone triggered increased selling pressure, driving the price back toward the lower boundary of the channel, where buyers are now looking to step in.
If buyers step in and defend this support, we could see a move toward the midline of the channel, with the next key target at 44,812. Holding above this level would reinforce the bullish trend structure and increase the probability of continuation toward the upper boundary of the channel.
However, a failure to hold trendline support could weaken the bullish outlook, leading to a potential breakdown and further downside pressure. Price action near this critical zone will be key in determining the next directional move.
Traders should monitor candlestick formations and volume for confirmation. As always, managing risk effectively is essential when trading this setup.
If you have any thoughts on this setup or additional insights, drop them in the comments!

AUDCAD Approaching Key Support - Rebound Towards 0.90150?OANDA:AUDCAD is approaching a significant support zone, highlighted by previous price reactions and strong buying interest. This area has previously acted as a key demand zone, increasing the likelihood of a bounce if buyers step in.
The current market structure suggests that if the price confirms support within this zone, we could see a bullish reversal. A successful rebound could push the pair toward the 0.90150 level, a logical target based on previous price behavior and current market structure.
However, if the price fails to hold this support and breaks below the zone with momentum, the bullish outlook may be invalidated, potentially opening the door for further downside continuation. Monitoring price action and volume in this area will be crucial to confirm a valid setup.
Just my take on support and resistance zones—not financial advice. Always confirm your setups and trade with solid risk management.
Best of luck!
