EURUSD Maintains Bearish Momentum - Is 1.07500 the Next Target?OANDA:EURUSD is trading within a well-defined descending channel, with price action consistently respecting both the upper and lower boundaries. Recently, the price rejected a key resistance zone, reinforcing bearish momentum and signaling a potential continuation toward lower levels.
The current price action suggests that if price continues to respect this resistance, we could see further downside toward 1.07500, aligning with the lower boundary of the channel. However, if price breaks above the channel and sustains above it, the bearish outlook may be invalidated, potentially signaling a shift in momentum. Monitoring price action and volume at this level will be essential for confirmation.
Just my take on support and resistance zones—not financial advice. Always confirm your setups and trade with solid risk management.
Best of luck!
Support_and_resistance

Still BullishRetested the Previous Breakout Level
around 37 - 38.
Immediate Support is around 46 - 46.50 now.
Monthly Closing above 48.20 would be
very healthy sign; targeting around 55.
& then around 60.

GOLD Trending Higher - Will Buyers Push Toward 3,012?OANDA:XAUUSD is trading within a well-defined ascending channel, with price action consistently respecting both the upper and lower boundaries. The recent bullish momentum indicates that buyers are in control, suggesting a potential continuation.
The price has recently broken above a key resistance zone and may come back for a retest. If this level holds as support, it would reinforce the bullish structure and increase the likelihood of a move toward the 3,012 target, which aligns with the channel’s upper boundary.
As long as the price remains above this support zone, the bullish outlook stays intact. However, a failure to hold above this level could invalidate the bullish scenario and increase the likelihood of a pullback toward the channel’s lower boundary.
Remember, always confirm your setups and trade with solid risk management.
Best of luck!

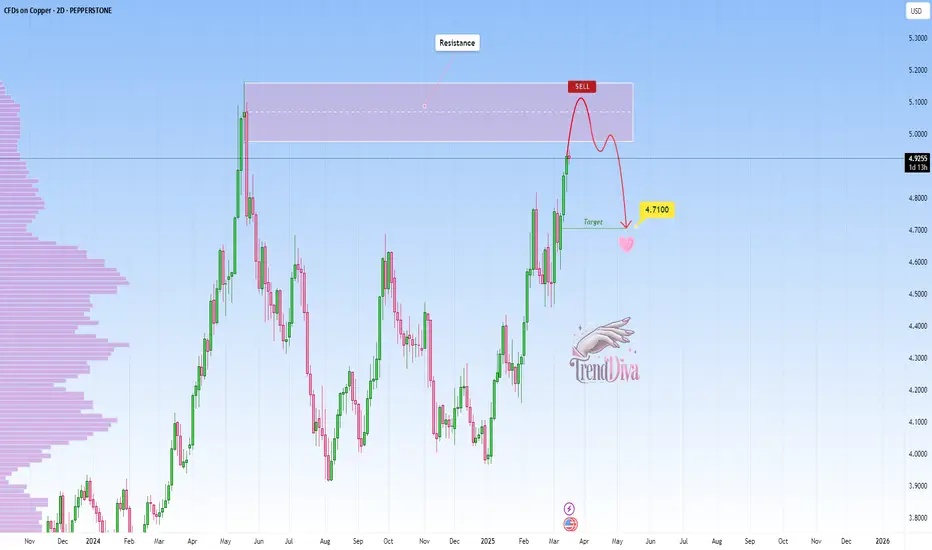
COPPER Approaching Key Resistance — Potential Sell SetupPEPPERSTONE:COPPER is approaching a significant resistance zone, highlighted by previous price reactions and strong selling interest. This area has previously acted as a key supply zone, increasing the likelihood of a bearish reversal if sellers step in.
The current market structure suggests that if the price confirms resistance within this zone, we could see a pullback toward the 4.7100 level, a logical target based on previous price behavior and current market structure. However, a clear breakout above this resistance could challenge the bearish outlook and open the door for further upside. It's a pivotal area where price action will likely provide clearer clues on the next direction.
Just my take on support and resistance zones—not financial advice. Always confirm your setups and trade with solid risk management.
Best of luck!
AUDCAD Approaching Key Resistance — Potential Sell SetupOANDA:AUDCAD is approaching a key resistance zone, highlighted by strong selling interest. This area has historically acted as a supply zone, increasing the likelihood of a bearish reversal if sellers step in.
The current market structure suggests that if the price confirms resistance within this zone, we could see further downside movement. A successful rejection could push the pair toward 0.90700, a logical target based on prior price behavior and the current structure.
However, if the price breaks and holds above this resistance, the bearish outlook may be invalidated, potentially leading to further upside.
Just my take on support and resistance zones—not financial advice. Always confirm your setups and trade with solid risk management.
Best of luck!

NZDJPY at Key Support Level - Rebound Towards 87.300?OANDA:NZDJPY has reached a significant support zone, highlighted by previous price reactions and strong buying interest. This area has previously acted as a key demand zone, increasing the likelihood of a bounce if buyers step in.
The current market structure suggests that if the price confirms support within this zone, we could see a bullish reversal. A successful rebound could push the pair toward the 87.300 level, a logical target based on previous price behavior and current market dynamics. Monitoring candlestick patterns and volume at this critical zone is essential for identifying buying opportunities.
Just my take on support and resistance zones—not financial advice. Always confirm your setups and trade with solid risk management.
Best of luck!

EURUSD at Key Resistance Level – Will Sellers Step In?OANDA:EURUSD has reached a key resistance level, marked by prior price rejections, suggesting strong selling interest. This area has previously acted as a key supply zone, increasing the likelihood of a bearish reversal if sellers step in.
If bearish signals emerge, such as rejection wicks, bearish candlestick patterns, or signs of weakening bullish pressure, I anticipate a move toward the 1.07400 level. However, a clear breakout above this resistance could challenge the bearish outlook and open the door for further upside. It's a pivotal area where price action will likely provide clearer clues on the next direction.
Just my take on support and resistance zones, not financial advice. Always confirm your setups and trade with a proper risk management.

AUDNZD at Key Support Level - Rebound Towards 1.10100?OANDA:AUDNZD has reached a significant support zone, highlighted by previous price reactions and strong buying interest. This area has previously acted as a key demand zone, increasing the likelihood of a bounce if buyers step in.
The current market structure suggests that if the price confirms support within this zone, we could see a bullish reversal. A successful rebound could push the pair toward the 1.10100 level, a logical target based on previous price behavior and current market dynamics. Monitoring candlestick patterns and volume at this critical zone is essential for identifying buying opportunities.
Just my take on support and resistance zones, not financial advice. Always confirm your setups and trade with solid risk management.
Best of luck!

GBPNZD Bullish Continuation - Will Buyers Push Toward 2.28000?OANDA:GBPNZD is trading within a well-defined ascending channel, with price action consistently respecting both the upper and lower boundaries. The recent bullish impulse suggests that buyers are maintaining control, indicating a potential continuation toward the upper boundary.
The price has recently broken above a key resistance zone and may come back for a retest. If this level holds as support, it would reinforce the bullish structure and increase the likelihood of a move toward 2.28000, which aligns with the channel’s upper boundary.
As long as the price remains above this support zone, the bullish outlook remains valid. However, a failure to hold the support zone would invalidate the bullish scenario and open the possibility for a deeper pullback toward the channel’s lower boundary.
Remember, always confirm your setups and trade with solid risk management.
Best of luck!

GBPAUD Approaching Major Resistance — Potential Sell SetupOANDA:GBPAUD is approaching a major resistance zone, highlighted by strong selling interest. This area has historically acted as a supply zone, increasing the likelihood of a bearish reversal if sellers step in.
The current market structure suggests that if the price confirms resistance within this zone, we could see further downside movement. A successful rejection could push the pair toward 2.03000, a logical target based on prior price behavior and the current structure.
However, if the price breaks and holds above this resistance, the bearish outlook may be invalidated, potentially leading to further upside.
Just my take on support and resistance zones—not financial advice. Always confirm your setups and trade with solid risk management.
Best of luck!

WHEAT Approaching Key Support - Will Price Rebound to 550$?PEPPERSTONE:WHEAT is approaching a key support level, an area where buyers have previously shown strong interest. The recent bearish movement suggests that price may soon be testing this level, potentially setting up for a rebound.
A bullish confirmation, such as a strong rejection pattern, bullish engulfing candles, or long lower wicks, would strengthen the case for a move higher. If buyers step in, the price could rally toward the 550$ target. However, a decisive breakdown below this support would invalidate the bullish scenario and could lead to further downside.
This is not financial advice but rather how I approach support/resistance zones. Remember, always wait for confirmation, like a rejection candle or volume spike before jumping in.
Best of luck , TrendDiva

Ethereum at Key Support: Will it bounce to 2,800$?COINBASE:ETHUSD price is moving inside a clear ascending channel , with the upper boundary acting as long-term resistance and the lower boundary providing dynamic support. After a steady climb, the price started showing weakness, confirmed by a head and shoulders pattern, a common sign that the trend might reverse. This led to a strong drop, bringing the price down to a key support zone around $2,000.
This support area is important because it meets with a major trendline, making it a likely spot where buyers could step in. The volume profile also shows a lot of activity in this zone, meaning traders have been interested in these levels before. If the price holds above this support, there’s a good chance it could bounce towards $2,800, which lines up with a previous resistance.
A breakdown below the trendline shifts the bias bearish toward 1,414. For now, as long as Ethereum stays above the support zone, a recovery toward $2,800 is on the table. But if it falls below, the bearish trend is likely to continue.
Just my take on support and resistance zones, not financial advice. Always confirm your setups and trade with solid risk management.

GOLD Daily Analysis: Is This the Start of a Deeper Correction?OANDA:XAUUSD is moving inside a clear ascending channel, with the upper boundary acting as long-term resistance and the lower boundary providing dynamic support. Price has been respecting this channel, with multiple touches on both the upper and lower boundaries, reinforcing its structure. Recently, the price formed a double top near the upper boundary, a classic reversal signal suggesting bullish exhaustion.
If the price continues to hold below this level, it could lead to further downside. The next major support is around 2,780 , which aligns with a previous support level and also falls within the golden pocket on the Fibonacci retracement, making it a significant area for a potential reaction.
However, if the price reclaims the double-top region and pushes above recent highs, it would invalidate the bearish outlook and suggest another attempt to break the channel’s upper boundary. For now, the structure remains bearish, with 2,780 as the main downside target.

USDCHF at Key Support Zone – Potential Rebound to 0.89000OANDA:USDCHF has reached a significant support zone, marked by prior price reactions and strong buying interest. This area has previously acted as a key demand zone, increasing the likelihood of a bullish bounce if buyers step in.
If the price confirms support within this zone through bullish price action—such as long lower wicks or bullish engulfing candles—we could see a reversal toward 0.89000, a logical target based on previous market structure and price behavior.
However, if the price breaks below this support zone and sustains, the bullish outlook would be invalidated, potentially leading to further downside.
Just my take on support and resistance zones—not financial advice. Always confirm your setups and trade with solid risk management.
Best of luck!

SPX500 at Key Support Level: Rebound Towards 5,860?FOREXCOM:SPX500 has reached a significant support zone, highlighted by previous price reactions and strong buying interest. This area has acted as a key demand zone, increasing the likelihood of a bullish bounce if buyers step in.
The current market structure suggests that if the price confirms support within this zone, we could see a bullish reversal. A successful rebound could push the price toward 5,860. However, if the price breaks below this zone, the bullish outlook may be invalidated, opening the possibility for further downside.
Just my take on support and resistance zones—not financial advice. Always confirm your setups and trade with solid risk management.
Best of luck!

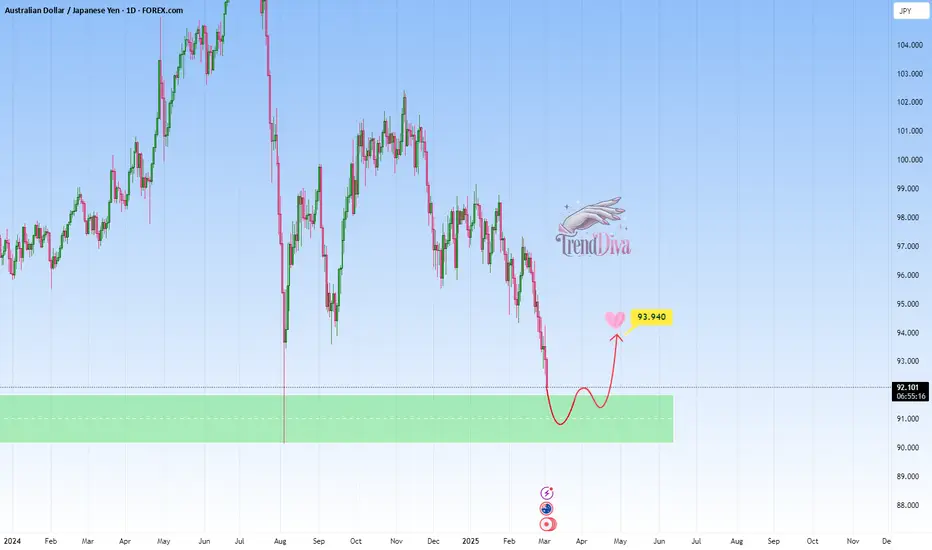
AUDJPY Approaching Key Support - Will Price Rebound to 93.940?OANDA:AUDJPY is approaching a key support level, an area where buyers have previously shown strong interest. The recent bearish movement suggests that price may soon be testing this level, potentially setting up for a rebound.
A bullish confirmation, such as a strong rejection pattern, bullish engulfing candles, or long lower wicks, would strengthen the case for a move higher. If buyers step in, the price could rally toward 93.940, aligning with the next key resistance level.
However, a decisive breakdown below this support would invalidate the bullish scenario and could lead to further downside.
This is not financial advice but rather how I approach support/resistance zones. Remember, always wait for confirmation, like a rejection candle or volume spike before jumping in.
Best of luck, TrendDiva.
NZDCAD — Sell Setup at Key Resistance ZoneOANDA:NZDCAD has reached a key resistance zone, marked by prior price rejections, suggesting strong selling interest. This area has previously acted as a key supply zone, increasing the likelihood of a bearish reversal if sellers step in.
If the price confirms resistance within this zone through bearish price action—such as wick rejections or lower timeframe weakness—we could see a move toward 0.81780, which aligns with a logical target based on recent market structure.
However, if the price breaks and holds above this resistance area, the bearish outlook may be invalidated, potentially opening the door for further upside.
Just my take on support and resistance zones—not financial advice. Always confirm your setups and trade with solid risk management.
Best of luck!

GBPZAR - Sell Setup at Key Resistance LevelOANDA:GBPZAR has reached a significant resistance zone, a level where sellers have consistently stepped in, leading to notable bearish reversals in the past. This area is marked by strong selling interest and historical price reactions, increasing the likelihood of a bearish move if sellers regain control.
The current price action suggests that if the pair confirms resistance through signals like bearish engulfing candles, long upper wicks, or increased selling volume, we could see a downward move toward 23.41160 — a logical target based on previous price behavior and market structure.
However, if the price breaks above this zone and sustains, the bearish outlook may be invalidated, opening the door for further upside.
Just my take on support and resistance zones—not financial advice. Always confirm your setups and trade with solid risk management.
Best of luck!

USDMXN at Key Support Level - Potential Buy SetupFOREXCOM:USDMXN has reached a significant support zone, highlighted by previous price reactions and strong buying interest. This area has historically acted as a key demand zone, increasing the likelihood of a bounce if buyers step in.
The current market structure suggests that if the price confirms support within this zone, we could see a bullish reversal. A successful rebound could push the pair toward the 20.49000 level, a logical target based on past price behavior and structural confluence.
Just my take on support and resistance zones—not financial advice. Always confirm your setups and trade with solid risk management.
Best of luck!

Platinum at Key Support Zone – Will Buyers Step In?OANDA:XPTUSD is approaching a significant support zone, marked by prior price reactions and strong buying interest. This area has previously acted as a key demand zone, increasing the likelihood of a bullish bounce if buyers step in.
If the price confirms support within this zone through bullish price action—such as long lower wicks or bullish engulfing candles—we could see a reversal toward 978.700, a logical target based on previous market structure and price behavior.
However, if the price breaks below this support zone and sustains, the bullish outlook would be invalidated, potentially leading to further downside.
Just my take on support and resistance zones—not financial advice. Always confirm your setups and trade with solid risk management.
Best of luck!

GBPUSD Approaching Key Resistance — Will It Drop to 1.27720?OANDA:GBPUSD is approaching a significant resistance zone, an area where sellers have previously stepped in to drive prices lower. This area has acted as a key supply zone, making it a level to watch for potential rejection.
If price struggles to break above and we see bearish confirmation, I anticipate a pullback toward the 1.27720 level.
However, a strong breakout and hold above resistance could invalidate the bearish outlook, potentially leading to further upside.
Just my take on support and resistance zones—not financial advice. Always confirm your setups and trade with solid risk management.
Best of luck!

GBPNZD Maintains Bearish Momentum - Is 2.23800 the Next Target?OANDA:GBPNZD is trading within a well-defined descending channel, with price action respecting both the upper and lower boundaries. The price has broken below a key support zone and has now pulled back for a potential retest. This level previously acted as support and may now turn into resistance, aligning with a bearish continuation.
If sellers confirm resistance at this zone, the price is likely to move downward toward the 2.23800 target, which aligns with the lower boundary of the channel. However, a breakout above the resistance zone would invalidate the bearish scenario and could open the door for a stronger bullish reversal.
Remember, always confirm your setups and trade with solid risk management. Best of luck!

EURJPY Approaching Major Support – Will Buyers Step In?OANDA:EURJPY is approaching a significant support zone, highlighted by previous price reactions and strong buying interest. This area has historically acted as a key demand zone, increasing the likelihood of a bounce if buyers step in.
The current market structure suggests that if the price confirms support within this zone, we could see a bullish reversal. A successful rebound could push the pair toward the 160.000 level, a logical target based on past price behavior and structural confluence.
Just my take on support and resistance zones—not financial advice. Always confirm your setups and trade with solid risk management.
Best of luck!
