GBPUSD - Bearish ValidationGBP completed HAS pattern and now is testing the Resistance cluster - what for me is the Bearish Validation of trend reversal to downtrend.
Yet the price is staying within the downtrend channel.
If price respects the Resistance and the channel - we are in the downtrend.
Jus my humble opinion
Support and Resistance

Gold is aiming at 3,440.00.Gold is aiming at 3,440.00.
Gold’s upward trend is poised to continue, driven by potential Federal Reserve rate cuts, ongoing central bank purchases, and increased ETF investments. Markets are betting on a 93% chance of a rate cut at the Fed’s next meeting. Central banks added 166 tons to global gold reserves in Q2, according to the World Gold Council, while gold-backed ETFs experienced robust inflows during the same period.
XAUUSD has been trading bullish during August 7 trading session. Уven the geopolitical relief did not prevent gold from continuing its upward path. On August 7 the price has successfully retested the 3,380.00 support and is currently heading towards the level of 3,440.00.

EURUSD stops at the SMA200, ready to pullback.EURUSD stops at the SMA200, ready to pullback.
The pair has been forming the bearish wedge since the April 2025 till July 2025. At the end of July the lower border of the pattern got broken and the price has rapidly reached the 1.14000 support level. Then the rebound from this level occurred and currently the price is retesting the lower border of the wedge from below. Additionally, the SMA200 is situated just above the current price, which is a fair argument for the price to pullback in the nearest future. The price is expected to decline with a first target of 1.14000.

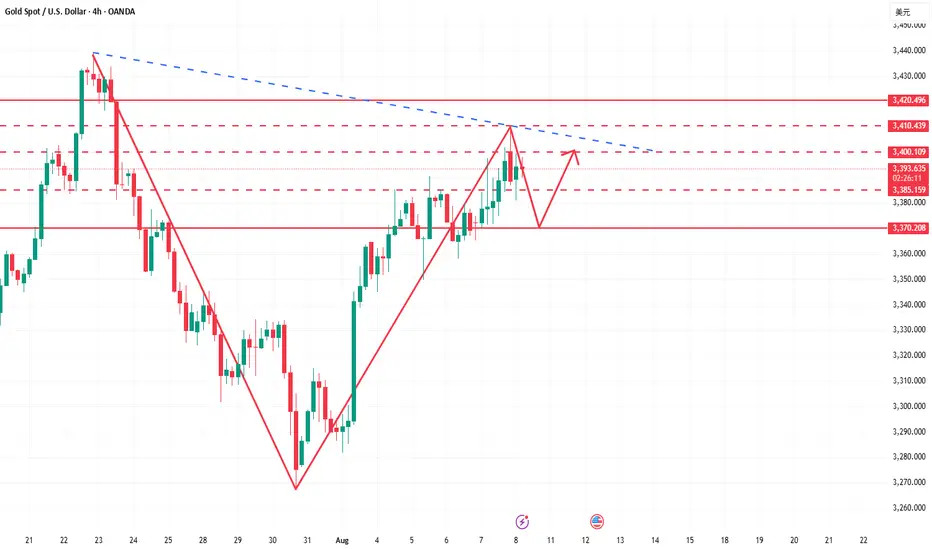
Bullish momentum weakens, and bearish opportunities emergeThe 4-hour gold chart shows a slow, volatile upward trend. While gradually climbing higher, it has failed to effectively break through key resistance areas. This suggests the market is not in a one-sided bullish trend, but rather in a state of sustained oscillation. Current price momentum is weakening, so it's not advisable to continue chasing higher prices. Today's strategy is to short on rallies, focusing on the key resistance area around 3410-3420. Opportunities are open for short positions. If prices trade within the 3400 range, this would be an ideal entry point for a short position. The main trend is to short on rebounds from higher levels, with strict risk management.
Gold Recommendation: Short in batches between 3400-3415, with a target of 3385-3370.
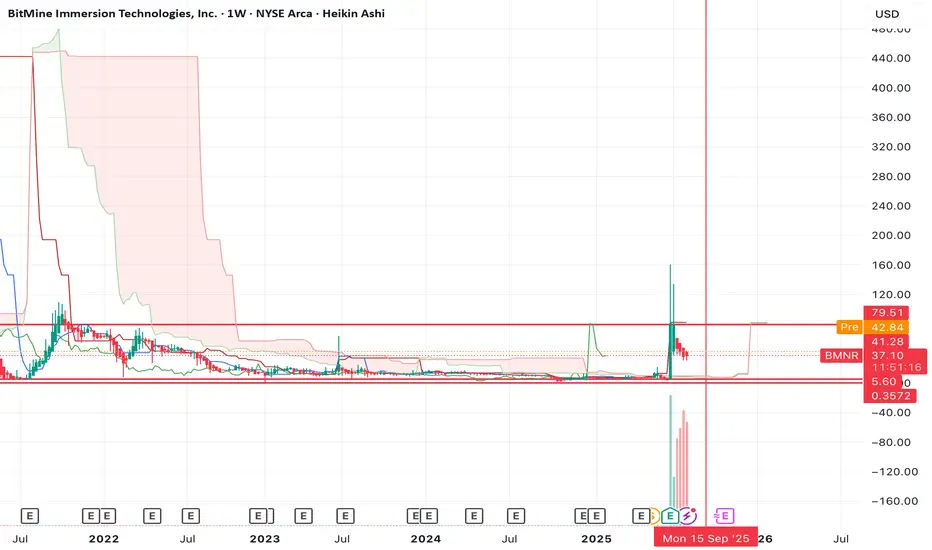
ETH is not having its "2017" moment, neither is BMNRDespite Tom Lee calling for ETH to $18k (which I happen to agree on btw), I think his timing is completely off. He's thinking that ETH is bullish here and that we're going to go to new highs this year.
I think the opposite. I think the top is already in for the year and that we're going to head to new lows first before we make our way to new highs.
BMNR doesn't look good either. The chart is bearish on the 3W and 1M timeframe with a bearish divergence on the RSI.
I think it's more likely that BMNR retests the lows before it sees any large pump.
Let's see how the chart plays out over the coming weeks/months.
Bitcoin (BTC/USD) – 15M Chart Analysis | Aug 8, 2025
Current Price Action:
BTC is trading at $116,953, hovering inside the yellow demand zone ($115,800–$117,000), showing short-term consolidation.
Immediate Resistance:
$117,681 is the key intraday resistance; repeated rejections here signal strong seller presence before the $118,800 zone.
Support Levels:
The yellow zone’s lower boundary near $115,800 is crucial; below this, the next major supports are $113,239 and $111,989.
Momentum Outlook:
After a sharp rally, price is ranging with reduced volatility — indicating a potential breakout setup in either direction.
Trading Bias:
Bullish: Break & hold above $117,681 → targets $118,809 and $119,862.
Bearish: Drop below $115,800 → downside toward $113,239 likely.

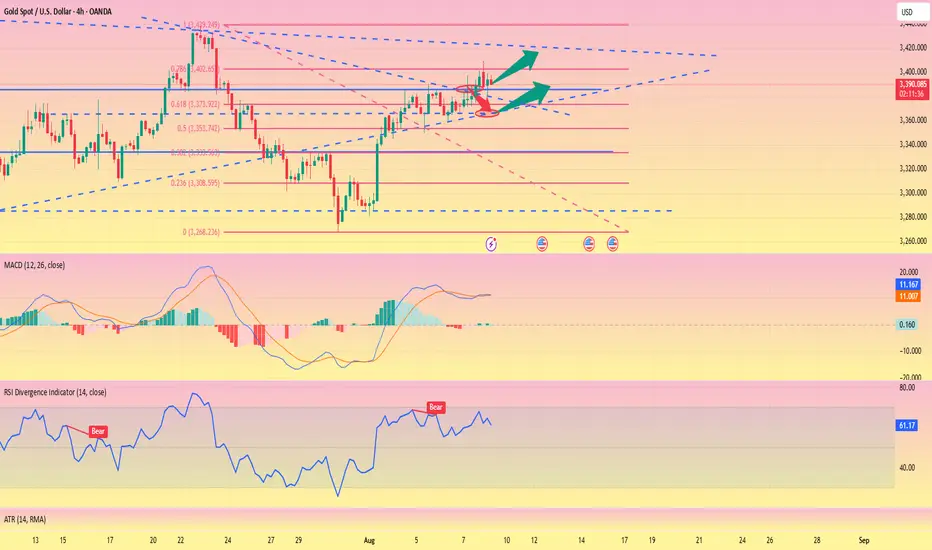
Gold Price Setup – Liquidity Grab Before Bullish Rally?Price is currently hovering above the 15M Order Block (OB) and testing the ascending trendline, aligned with the 200 EMA support.
📌 Key Points:
Price rejected from the higher channel boundary and entered the Rejection Area near 3,405 – 3,409 ($$$ liquidity zone).
Expecting a possible dip into the 15M OB for liquidity grab and trendline retest.
If bullish confirmation forms, a potential rally toward 3,405 and possibly 3,409 is on the table.
A break below 3,385 would invalidate the setup and could shift sentiment bearish.
🎯 Bullish Target: 3,405 – 3,409
🛡 Invalidation: Break below 3,385

The trend has not changed, go long and look for new highs#XAUUSD
Gold fluctuated at a high level in the Asian session, and the market has not yet taken a clear direction. Despite the current market conditions being extremely flat, caution remains regarding the potential for wider volatility after a breakout above key levels. The current short-term resistance area above gold is 3400-3410. With the breakthrough of yesterday's high today, the short-term support level will also move up. The middle track of the Bollinger band at the hourly level below has also risen to around 3390. The focus of the European session is whether gold can effectively break through the short-term suppression. If the European session is under pressure and encounters resistance, then gold may have a correction. It can be considered to retreat to the 3390-3378 area below and stabilize before lightly long gold to see new highs. Be wary of potential black swan events on Friday.
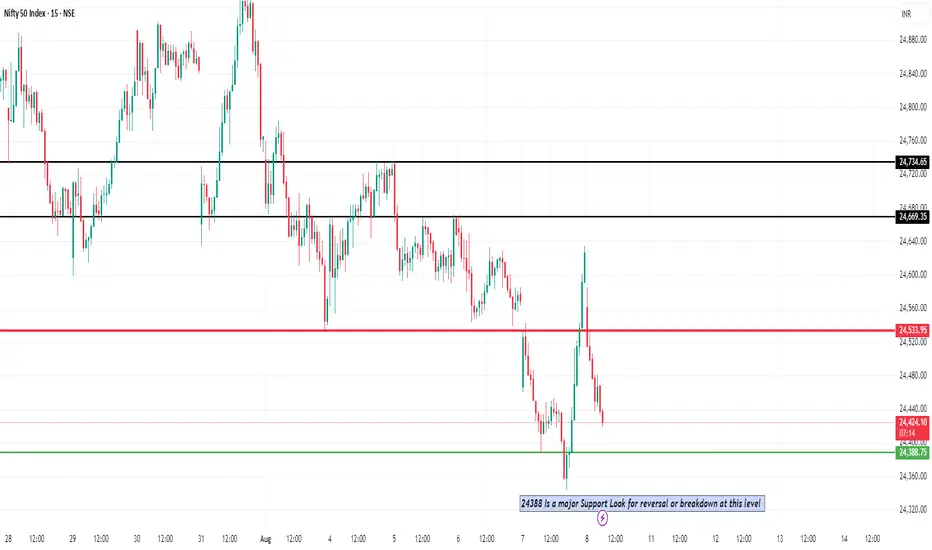
Nifty 50 Reversal / Breakdown ViewNifty 50 – Sharp Reversal from 24,388: What Really Happened Yesterday
Yesterday was a rollercoaster for the Nifty 50.
The day started on a sour note after news broke that the U.S. had slapped another 25% tariff on Indian exports, effectively doubling the total to 50%. The sentiment hit the floor right at the open, and we saw the index tumble to 24,388, marking a fresh three-month low.
But just when it looked like the selling would spiral, the market staged a dramatic turnaround. Strong buying — especially in the derivatives segment — kicked in during the second half. By the closing bell, Nifty had clawed its way back into the green, ending around 24,596. It wasn’t just a bounce; it felt like the bulls wanted to send a message: we’re still here.
Key Levels in Play
That 24,388 mark isn’t random. It lined up perfectly with a key support zone on the charts — one that also overlapped with short-term fair value gaps and EMA zones on the 15-minute chart. In other words, it was a prime area for a potential reaction.
Once the index got back above 24,450, buyers clearly had the upper hand. Now, 24,800 is the next hurdle. A strong break and hold above that could open the door for a test of 25,000. On the flip side, if we slip back under 24,450, we could be right back under pressure, staring at the 24,300–24,400 range again.
The Bigger Picture
Foreign flows: Global sentiment took a hit — foreign investors sold over ₹49,000 crore worth of equities yesterday, adding to the nervousness.
Sector moves: IT and pharma were the big drags early on, erasing some of their recent gains.
Domestic support: Local investors kept the faith, pumping in over ₹1 lakh crore — the strongest domestic inflows in four months — which likely helped cushion the fall.
Takeaway
Yesterday’s reversal wasn’t luck. It was a combination of technical support holding, aggressive short-covering, and steady domestic buying stepping in when the global mood was sour.
AUDJPY SELLAUDJPY SELL
trend Line is brake.
lower lower is accepted.
I think this is good for today may be it will be profitable for next week.
have a good weeked.

BUY USTEC 8.8.2025Confluence order: BUY at M15
Type of order: Limit order
Reason:
- The current top is not touching anything, expected to rise to the MAINKEY of H1~M15 above.
- M15~FIBO 0,5-0,618 (same position)
Note:
- Management of money carefully at the last bottom (23,459)
Set up entry:
- Entry buy at 23,438
- SL at 23,423
- TP1: 23,459 (~1R)
- TP2: 23,481 (~2R)
- TP3: 23,540 (~6R)
Trading Method: Price action (No indicator, only trend and candles)

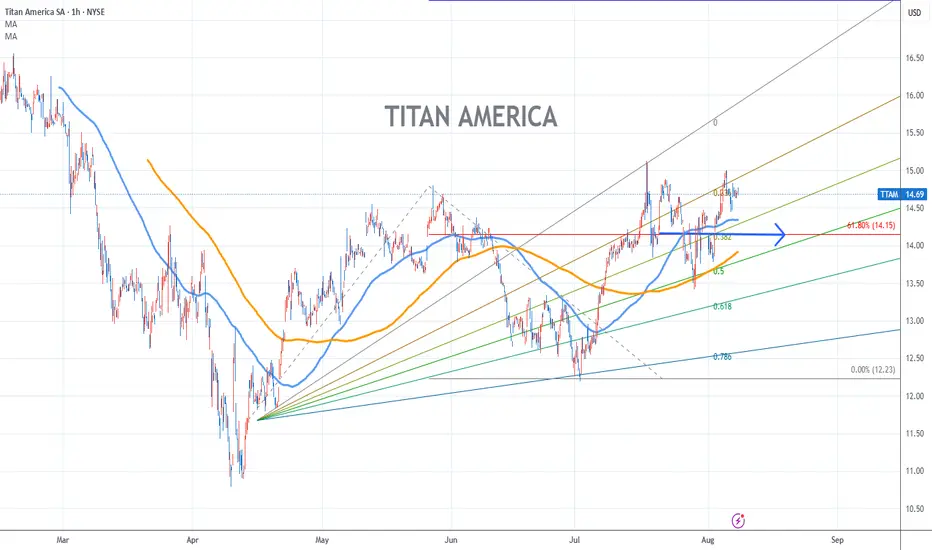
Titan America Stock Chart Fibonacci Analysis 080725Trading Idea
1) Find a FIBO slingshot
2) Check FIBO 61.80% level
3) Entry Point > 14.1/61.80%
Chart time frame:B
A) 15 min(1W-3M)
B) 1 hr(3M-6M)
C) 4 hr(6M-1year)
D) 1 day(1-3years)
Stock progress:A
A) Keep rising over 61.80% resistance
B) 61.80% resistance
C) 61.80% support
D) Hit the bottom
E) Hit the top
Stocks rise as they rise from support and fall from resistance. Our goal is to find a low support point and enter. It can be referred to as buying at the pullback point. The pullback point can be found with a Fibonacci extension of 61.80%. This is a step to find entry level. 1) Find a triangle (Fibonacci Speed Fan Line) that connects the high (resistance) and low (support) points of the stock in progress, where it is continuously expressed as a Slingshot, 2) and create a Fibonacci extension level for the first rising wave from the start point of slingshot pattern.
When the current price goes over 61.80% level , that can be a good entry point, especially if the SMA 100 and 200 curves are gathered together at 61.80%, it is a very good entry point.
As a great help, tradingview provides these Fibonacci speed fan lines and extension levels with ease. So if you use the Fibonacci fan line, the extension level, and the SMA 100/200 curve well, you can find an entry point for the stock market. At least you have to enter at this low point to avoid trading failure, and if you are skilled at entering this low point, with fibonacci6180 technique, your reading skill to chart will be greatly improved.
If you want to do day trading, please set the time frame to 5 minutes or 15 minutes, and you will see many of the low point of rising stocks.
If want to prefer long term range trading, you can set the time frame to 1 hr or 1 day.
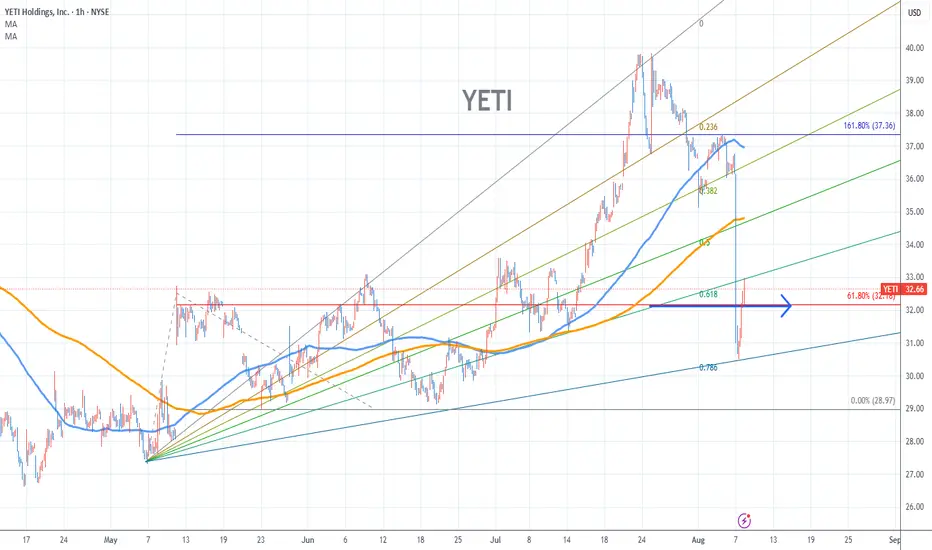
Yeti Stock Chart Fibonacci Analysis 080725Trading Idea
1) Find a FIBO slingshot
2) Check FIBO 61.80% level
3) Entry Point > 32/61.80%
Chart time frame:B
A) 15 min(1W-3M)
B) 1 hr(3M-6M)
C) 4 hr(6M-1year)
D) 1 day(1-3years)
Stock progress:C
A) Keep rising over 61.80% resistance
B) 61.80% resistance
C) 61.80% support
D) Hit the bottom
E) Hit the top
Stocks rise as they rise from support and fall from resistance. Our goal is to find a low support point and enter. It can be referred to as buying at the pullback point. The pullback point can be found with a Fibonacci extension of 61.80%. This is a step to find entry level. 1) Find a triangle (Fibonacci Speed Fan Line) that connects the high (resistance) and low (support) points of the stock in progress, where it is continuously expressed as a Slingshot, 2) and create a Fibonacci extension level for the first rising wave from the start point of slingshot pattern.
When the current price goes over 61.80% level , that can be a good entry point, especially if the SMA 100 and 200 curves are gathered together at 61.80%, it is a very good entry point.
As a great help, tradingview provides these Fibonacci speed fan lines and extension levels with ease. So if you use the Fibonacci fan line, the extension level, and the SMA 100/200 curve well, you can find an entry point for the stock market. At least you have to enter at this low point to avoid trading failure, and if you are skilled at entering this low point, with fibonacci6180 technique, your reading skill to chart will be greatly improved.
If you want to do day trading, please set the time frame to 5 minutes or 15 minutes, and you will see many of the low point of rising stocks.
If want to prefer long term range trading, you can set the time frame to 1 hr or 1 day.
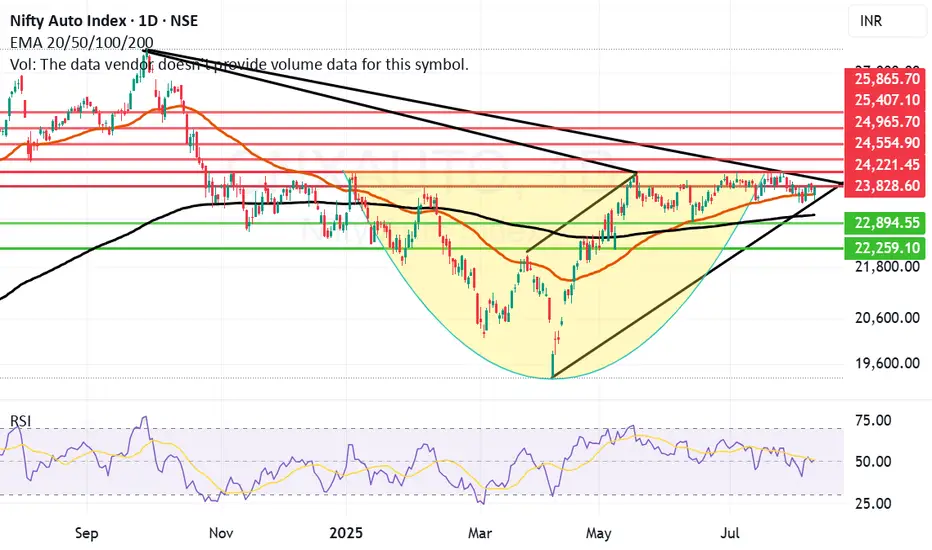
Auto Index has consolidated and might be in search of a BreakoutCNX Auto Index has consolidated for a long time in the range of 22800 and 24250 since May 25. If the index can cross the resistance zone between 23828 and 24221 and if we get a weekly closing above 24221 or 24250 then we might see a rally in this index towards 25K or even near 26K. Currently the index closed on Thursday at 23808. Lot of Auto and Auto component companies gave good results during the last quarter.
When the index is strong and gives a breakout it means that the undercurrent in majority of the companies which constitute the index is strong. There will be some companies which will obviously drag the index down as there can not be one way traffic. To know amongst these which companies to invest in an investor should look at fundamentals of the company, recent and past results, cash flows, Sales and order books, EPS and many other factors. While a Technical investor should look at charts of the companies before investing.
A smart investor would be a person who looks at both fundamentals and technicals of the company and invests in a fundamentally strong company which is giving a technical breakout. For this one has to learn Techno-Funda analysis. I have written a book on the subject called The Happy Candles Way To Wealth Creation. In this book you will learn the basics of Techno-Funda investing. The book is available on Amazon and is one of the highest rated books in its category. With an approval rating of 4.8/5 as on date. Lot of investors call it as a Hand book for Techno Funda investing. Most of the chapters are standalone and can be read at your own accord. It will be really helpful to you.
The companies that constitute this index are Maruti Suzuki, Tata Motors, M&M, MRF, TI India, Exide, Samvardhana Motherson, Ashok Leyland, Hero Moto, TVS Motors, Bharat Forge, Bosch, Balkrishna, Bajaj Auto and Eicher Motors. Amongst these companies due to Tariff uncertainties one should focus on companies which will be least dependent on export and have major market which caters to local consumption or exports not related to US. Two-Wheeler manufacturers and Two Wheeler component manufacturers are looking particularly strong in the index as most of them are consumed and sold locally. The rains so far this monsoon have been good so the Farm equipment and Tractor manufacturers also can try to push the index upwards if the monsoon remains strong in India.
If we get a closing above 24250 we can easily see index moving 1000 to 1500 points northwards if positivity in the index sustains. The resistances currently for the Auto index are at 23828, 24221, 24554, 24965, 25407 and 25865. The supports for Auto index remain at 23620 (Mother line support), 23087 (Father line support), 22894 (Below this level index becomes very weak) and 22259. To know more about Mother line, Father line and my Mother, Father and Small child theory you should once again I recommend, read my book the Happy Candles Way to Wealth Creation.
Disclaimer: The above information is provided for educational purpose, analysis and paper trading only. Please don't treat this as a buy or sell recommendation for the stock or index. The Techno-Funda analysis is based on data that is more than 3 months old. Supports and Resistances are determined by historic past peaks and Valley in the chart. Many other indicators and patterns like EMA, RSI, MACD, Volumes, Fibonacci, parallel channel etc. use historic data which is 3 months or older cyclical points. There is no guarantee they will work in future as markets are highly volatile and swings in prices are also due to macro and micro factors based on actions taken by the company as well as region and global events. Equity investment is subject to risks. I or my clients or family members might have positions in the stocks that we mention in our educational posts. We will not be responsible for any Profit or loss that may occur due to any financial decision taken based on any data provided in this message. Do consult your investment advisor before taking any financial decisions. Stop losses should be an important part of any investment in equity.
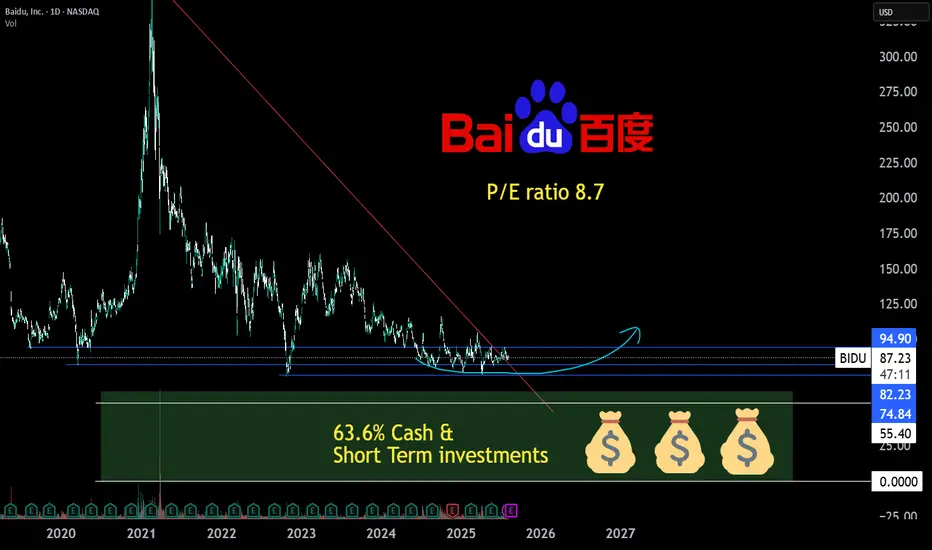
BAIDU 63.6% cash & short term inv., P/E 8.7,possible rotation TABaidu largest search engine in china but way less monopoly in china, there is also bing.
Baidu invests heavily in AI and autonomous driving by apollo go.
China economy is in deleveraging and seems to start growing again.
China devlation problems comapnies sitting on cash.
Baidu advertisment income will come back if the chinese economy improves.
600% falling wedge extension for VARA Network?On the above 4 day chart price action has corrected 90%. A number of reasons now exist for long entries, they include:
1) Price action and RSI resistance breakouts.
2) Support and resistance. Past resistance confirms support.
3) Point no. 2 confirms a “double bottom” in price action.
4) Notice the 4 day hammer candle?
5) The falling wedge confirmation forecasts a 600% move in price action.
Is it possible sellers keep selling? Sure, I hear their supplies are endless.
Is it probable? No.
Ww
Type: trade
Risk: small, tiny market cap.
Timeframe for long: Now
Return: 600%

TAKE A LOOK AT GBPAUD POSSIBLE BUY OPPORTUNITY!Bullish momentum resumes after laying low for couple of weeks now. Are we likely to see or continue back to resistance high? From the technical perspective, I anticipate it to continue trading bullish in couple of days/weeks to come

Nifty Analysis EOD – August 7, 2025 – Thursday🟢 Nifty Analysis EOD – August 7, 2025 – Thursday 🔴
A Trap, a Reversal, and a Breathless Rally — Did You Catch It?
🗞 Nifty Summary
Today was expected to be volatile, but few were prepared for how wildly Nifty behaved.
After a gap-down of 110 points on the back of negative global cues, Nifty immediately started filling the gap and reached the Previous Day Low (PDL). However, strong rejection at PDL sent prices tumbling — slicing below the Open, IB Low, and even the Current Day Low, marking a sharp low at 24,387.
Then came the bear trap.
A brief breakdown to 24,344.15 looked like a breakdown, but instead triggered a sharp liquidity grab, launching a vertical move upward. From that bottom, Nifty surged in a breathtaking rally — not a single 5-min candle broke its previous candle’s low, signaling relentless buying. Almost every resistance zone — Swing High, VWAP, PDL/S1, CPR, Weekly Low — got taken out in one single breath.
Did you ride it?
Honestly — I didn’t. I was frozen watching this dramatic reversal unfold.
Still, today’s super recovery puts the index back within its known range. Now, bulls need a close above 24,660–24,675 to confirm momentum.
📉 Intraday 5 Min Chart Overview
🧭 Intraday Price Action Flow
9:15 AM: Opens 110 points down at 24,467.10
9:15–10:30 AM: Recovers swiftly to PDL, but fails there.
10:25 AM – 11:05 PM: Sharp fall — breaches CDL & IB Low → makes new day low at 24,387
1:20 PM Onwards: Attempts consolidation; false breakdown at 24,344.15
2:00 PM – 3:30 PM: Monster rally → No candle breaks prior low; bulls dominate to close at 24,626.65
📉 Daily Time Frame Chart with Intraday Levels
🕯 Daily Candle Breakdown
Open: 24,464.20
High: 24,634.20
Low: 24,344.15
Close: 24,596.15
Change: +21.95 (+0.09%)
🔍 Candle Structure:
Real Body: Green → +131.95 pts
Upper Wick: 38.05 pts
Lower Wick: 120.05 pts
🧠 Interpretation:
Strong rejection from intraday lows near 24,344
Long lower wick shows dip buying strength
Closed near the highs = bulls dominated the end
Still within larger range → needs breakout above 24,675 for follow-through
🔥 Candle Type:
A bullish recovery candle, hammer-like, but within a sideways structure — shows aggressive buying near important demand zone (24,340–24,380).
📈 Updated Short-Term View – 7th August 2025
Support Zone: 24,340 – 24,380
Resistance Zone: 24,620 – 24,675
Bias: Neutral with a bullish tilt, unless 24,340 breaks decisively.
🎯 Trading Insight
A close above 24,660–24,675 may lead to further upside — possibly testing 24,735–24,780
Failure to hold above 24,460 will shift bias back to bearish
🛡 5 Min Intraday Chart
🥷 Gladiator Strategy Update
ATR: 205.09
IB Range: 82.85 → Medium
Market Structure: ImBalanced
⚔️ Trade Summary:
🕙 10:25 AM – Short Entry → Trail SL Hit (R:R = 1:1.8)
🧱 Support & Resistance Levels
🔼 Resistance Zones:
24,620
24,660 ~ 24,675
24,725 ~ 24,735
24,780 ~ 24,795
24,860 ~ 24,880
🔽 Support Zones:
24,542 ~ 24,535
24,500
24,470 ~ 24,460
24,380 ~ 24,344
💬 Final Thoughts
"Markets reward patience and punish rigidity."
Today was a masterclass in trap-reversal-breakout structure. While many were either trapped or missed the move, this type of price action reminds us — be ready, but never rigid.
Now all eyes on 24,675 — can bulls push above it and sustain?
✏️ Disclaimer:
This analysis reflects personal views and is not trading advice. Please consult your financial advisor before making decisions.

RENDER Approaching Key Support – Swing Trade OpportunityRENDER is currently retracing and approaching a significant support zone, offering a potential long swing trade setup. This level has historically acted as a demand area, and price action around it could provide a favorable risk-to-reward entry.
💰 Entry Zone: $3.280 – $3.030
🎯 Targets:
• TP1: $4.00
• TP2: $4.500
🛑 Stop Loss: $2.950
Trade management will be key – look for bullish reversal signals like strong volume, bullish engulfing patterns, or RSI confirmation before entry. Maintain disciplined risk control with your stop loss below the key zone.
#RENDER #CryptoTrading #SwingTrade #Altcoins #TechnicalAnalysis #CryptoSetup #Bullish #SupportZone #CryptoSignals #RENDERUSDT #RiskReward #CryptoMarket

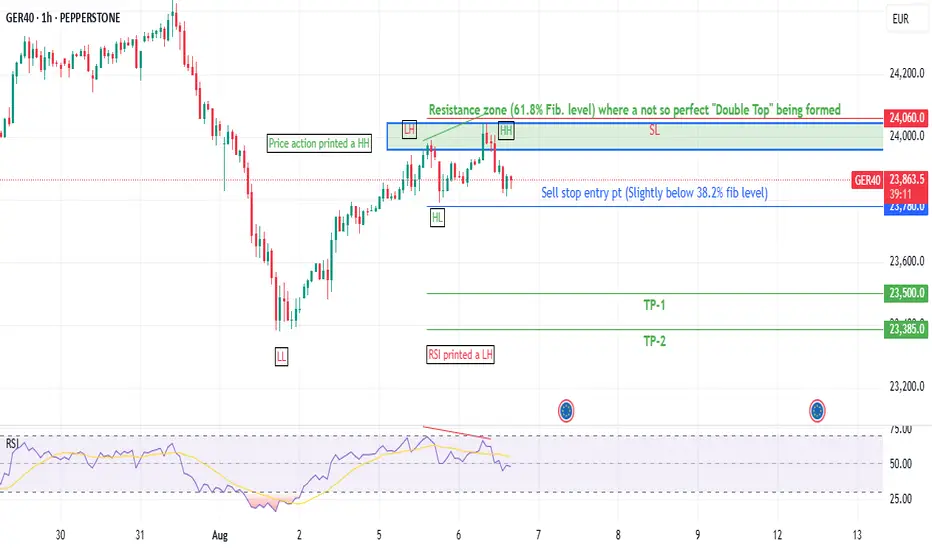
Potential GER40 (DAX) Short SetupHey everyone,
Just wanted to share my personal analysis and the trade plan I've put together for the GER40 on the 1-hour chart. I'm still learning, so a big part of my process is documenting my ideas to see how they play out. I would be grateful for any thoughts or feedback you might have.
What I'm Seeing on the Chart:
A Potential Double Top: I've spotted what appears to be a double top pattern forming up near the €24,000 - €24,060 area. To me, it looks like the recent rally might be showing signs of exhaustion here.
Bearish Divergence: What makes this setup more interesting to me is the bearish divergence on the RSI. Even though the price pushed to a slightly higher high, the RSI indicator made a lower high. My understanding is that this can suggest fading buying momentum.
Fibonacci Level: I also noticed that this rejection seems to be happening right around the key 61.8% Fibonacci retracement level from the last major down-move. When a few different signs seem to line up like this, I tend to pay closer attention.
My Personal Trade Plan:
My game plan is to be patient and only consider an entry if the price breaks below the recent lows, which would help confirm the bearish idea for me.
Entry (Sell Stop): $23,780
Stop Loss: $24,060 (I'll place this above the recent high, as a move above here would suggest my bearish idea is likely wrong).
Take Profit 1: $23,500
Take Profit 2: $23,385
Important: Please remember, I'm a humble trader from Pakistan still on my learning journey. This is simply me sharing my trade journal and thoughts, and it is not financial advice. Please always do your own analysis. Stay safe out there!
#GER40 #DAX #TechnicalAnalysis #Short #TradingJournal #LearningToTrade #Tradingidea #Sarmaaya
The bullish trend remains unchanged, seize the opportunityAfter today's opening, gold continued the bullish trend of yesterday. Judging from the daily line, gold has continued to rise, and it may only be a matter of time before it reaches a higher level. Judging from the 4H chart, the technical indicators are dead cross and shrinking, and the flexible indicators are repairing upward. The short-term middle track support is around 3372, and the upper side pays attention to the short-term pressure of 3395-3405. If the European session fails to effectively break through the short-term resistance, it will give the opportunity to test the 3380-3370 support again. If it is not broken, you can consider continuing to go long.
OANDA:XAUUSD

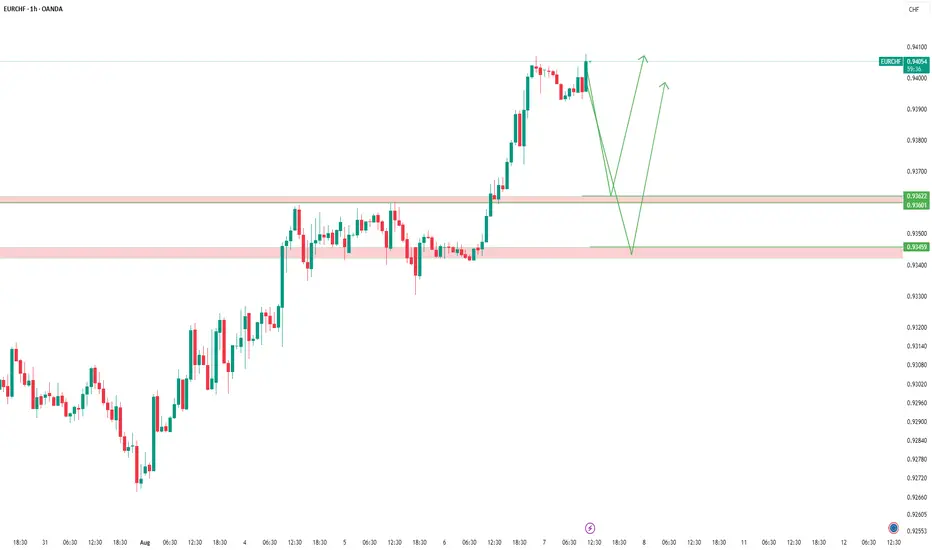
EURCHF – Pullback & New SetupIn my previous analysis (tagged below), I entered a short position. Price reached Reward 2, then pulled back and took me out at breakeven.
This is where you see the power of partial exit — it protects you from losses and keeps your risk low.
With this approach, I rarely see a 5% drawdown, but of course, nothing is guaranteed in trading.
The market broke my level strongly, and that’s okay. We don’t fight the market — we follow it.
Now I’m waiting for a pullback to the broken level, and I’ve also identified another nearby key zone.
If I get a valid signal at either level, I’ll enter a buy trade.
🧠 Remember: Trade with the market, not against it.
Drop the ego, drop the bias — let price lead.
Gold 15-Min Breakout: Eyes on M30 Supply Zone & FVG RetestPrice is currently approaching a key M30 Supply Zone after a strong bullish impulse from the ascending trendline support.
🔹 Key Observations:
The price broke above a previous short-term resistance zone and is now retesting the Fair Value Gap (FVG) area marked in pink.
The 200 EMA acted as dynamic support, further fueling bullish momentum.
Structure shows a series of higher lows, confirming buyers in control on intraday timeframes.
🔹 Potential Scenarios:
✅ Bullish Continuation:
If the price respects the FVG as demand and forms bullish confirmation, continuation toward the M30 Supply Zone and the 3,399–3,400 region is likely.
⚠️ Pullback Risk:
A deeper retracement below FVG could retest the trendline or the 3,371 support near the 200 EMA before any further upside.
🔹 Trade Plan:
Watching for price action reaction inside the FVG. A clean rejection could offer entries targeting the upper supply zone.
