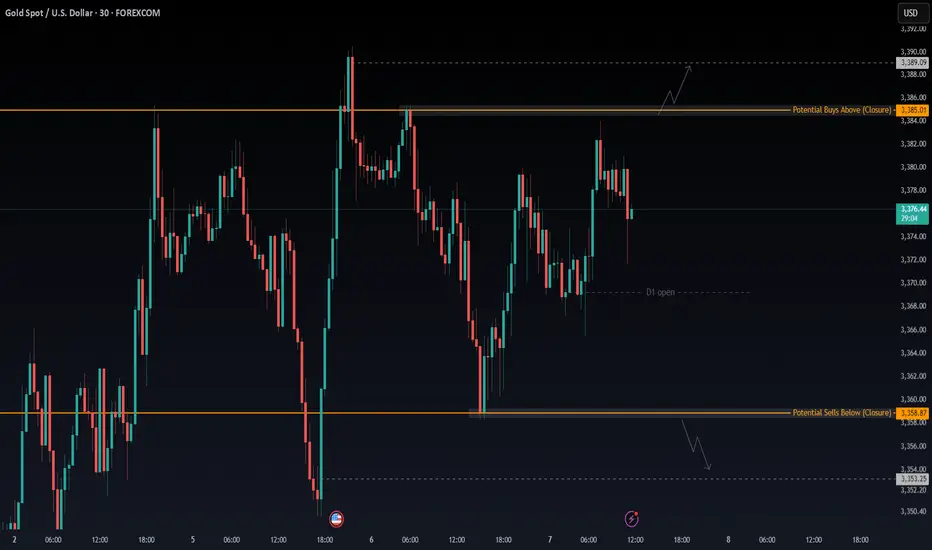
XAUUSD 30M – Stuck in a Range, Waiting for a Clean BreakGold is currently moving within a tight range between $3,385.01 (resistance) and $3,358.87 (support). Price has tested both edges multiple times, but without any clean follow through. The movement inside this zone is choppy and lacks momentum.
While trades inside the range are possible, they carry more risk due to inconsistent structure and quick reversals. The better setup is to wait for a confirmed break on either side.
Key Levels:
→ A 30 minute candle close above $3,385.01 could bring buyers in, with upside targets near $3,389.09 and beyond.
→ A clean break and close below $3,358.87 would shift momentum to the downside and may open the path toward $3,353.25 or lower.
For now, it’s a range with no clear dominance. Staying patient and waiting for a breakout gives better risk to reward.
#XAUUSD #Gold #PriceAction #RangeSetup #BreakoutTrade #SupportResistance #30mChart
Support and Resistance
XAUUSD H1 Chart – Elliott Wave ViewTrade Idea / Game Plan
-Intraday Long:
-Can scalp or swing long toward 3,393–3,400 (targeting completion of ⑤), but watch for exhaustion as price nears LZ.
-Short Setup:
-Look for rejection or reversal candles in the LZ (3,393+).
-If momentum stalls, this is your spot to hunt shorts, aiming back down to the blue zones (3,369 / 3,367 / 3,360).
-Risk:
-If price smashes through LZ without rejection, step aside and wait for new structure.
-3,393–3,400 Supply (LZ) Target for longs, look to short if reversal forms
-3,380–3,376 Minor S/R Watch for possible pause/retrace
-3,369–3,368 Support Bounce area if sharp pullback
-3,360–3,350 Major Demand Bigger bounce zone for bears

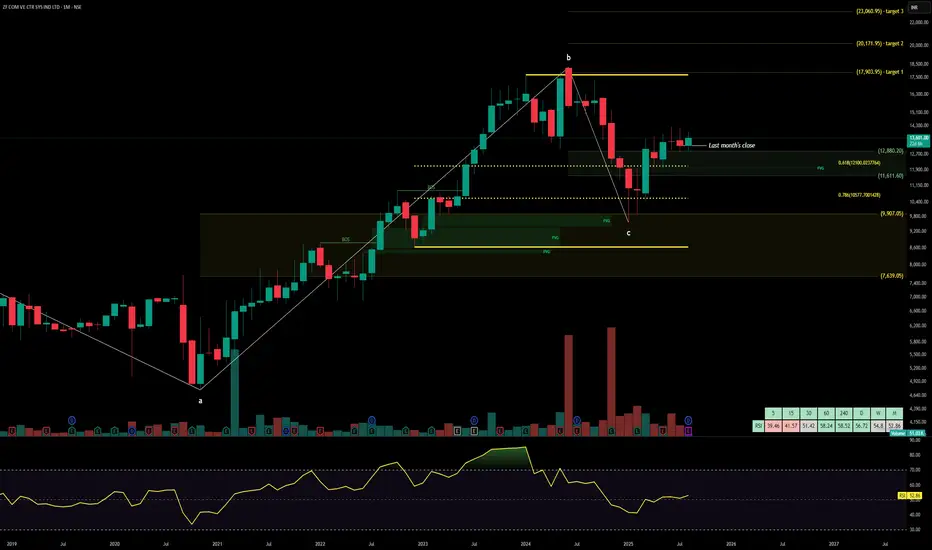
ZFCVINDIAZF Commercial Vehicle Control Systems India Ltd. is a leading manufacturer of advanced braking systems, air suspension modules, and electronic stability control solutions for commercial vehicles. Operating under the ZF WABCO brand, the company serves OEMs across trucks, buses, off-highway vehicles, and defense platforms. With strong R&D capabilities and multiple manufacturing sites, ZFCVINDIA plays a critical role in India’s commercial vehicle safety and automation landscape.
ZFCVINDIA – FY22–FY25 Snapshot
Sales – ₹3,150 Cr → ₹3,780 Cr → ₹4,320 Cr → ₹5,012 Cr Consistent growth driven by OEM demand and product diversification
Net Profit – ₹420 Cr → ₹520 Cr → ₹610 Cr → ₹725 Cr Margin expansion through high-value electronic systems
Operating Performance – Strong → Strong → Strong → Strong Efficiency gains from automation and platform integration
Dividend Yield (%) – 0.12% → 0.14% → 0.15% → 0.16% Modest payouts aligned with reinvestment strategy
Equity Capital – ₹9.00 Cr (constant) Lean capital structure with no dilution
Total Debt – ₹0 Cr (debt-free) Fully equity-financed operations
Fixed Assets – ₹1,120 Cr → ₹1,180 Cr → ₹1,240 Cr → ₹1,310 Cr Capex focused on automation and electronic module expansion
Institutional Interest & Ownership Trends
Promoter holding stands at 75.00%, reflecting strong strategic control. FIIs and DIIs have steadily increased exposure due to the company’s leadership in commercial vehicle safety systems. Delivery volumes indicate long-term accumulation by institutional desks focused on auto-tech and OEM-linked growth.
Business Growth Verdict
ZFCVINDIA continues to scale across braking and automation platforms Margins remain strong due to high-value product mix Debt-free structure enhances financial flexibility Capex supports long-term innovation and OEM integration
Management Con Call
Management emphasized strong demand visibility from OEMs and fleet operators for electronic braking and air suspension systems. New product launches include e-compressors, ESC modules, and electronically controlled air suspension for next-gen CV platforms. Export orders are gaining traction, especially in Southeast Asia and Europe. FY26 outlook includes mid-teen revenue growth and margin consistency, supported by automation, digital diagnostics, and retrofit solutions.
Final Investment Verdict
ZF Commercial Vehicle Control Systems India Ltd. offers a high-quality auto-tech play with strong financials, product leadership, and strategic OEM alignment. Its debt-free status, consistent profitability, and innovation-led growth make it suitable for accumulation by investors seeking exposure to commercial vehicle safety, automation, and electrification themes.
BUY USTEC 7.8.2025Confluence order: BUY at M15
Type of order: Limit order
Reason:
- The current top is not touching anything, expected to rise to the sub-key of H1~M15 above.
- M15~FIBO 0,5-0,618 (same position)
Note:
- Management of money carefully at the last bottom (23,,367)
Set up entry:
- Entry buy at 23,339
- SL at 23,317
- TP1: 23,367 (~1R)
- TP2: 23,403 (~3R)
- TP3: 23,459 (~5R)
Trading Method: Price action (No indicator, only trend and candles)

Bel intradat setup after neckline brekaout target 404Cup and handle formation in short duration
Neckline 390
After breakout target is 404.
Swing trade target SL will be 386
Take entry only after neckline breakout either with heavy volume or with heavy monemtum.

$ASAN looking for a swing to range highOn the day I'm writing this, NYSE:ASAN (3b mc) just announced a new CEO after hours. His name is Dan Rogers, an SAAS veteran, previously holding executive positions of companies like ServiceNow (208b mc), NYSE:RBRK (17.5b), and LaunchDarkly (3b, private) during key growth phases.
73% of Fortune 500 companies use ASANA's services. The company I work at uses this daily and is a key part of keeping operations going. If ASANA mystically stopped working, it would be a huge fire.
Looking for a mid-long term swing near $23 and potentially beyond.

07/08/25 Gold Swing Levels07/08/25 levels are marked; expecting a continuation down
Always, price action determines trade.
Trade parameters
Entry on 5 min chart
Sl: 30-50pips
TP: 2-4x SL

GBPUSD InsightWelcome, dear subscribers!
Please feel free to share your personal opinions in the comments. Don’t forget to like and subscribe!
Key Points
- Several key figures at the Federal Reserve continue to make dovish remarks.
Neel Kashkari, President of the Federal Reserve Bank of Minneapolis, stated that “it might be appropriate to adjust the federal funds rate in the short term.”
Federal Reserve Governor Lisa Cook noted that “large-scale revisions like those seen in the July jobs report typically occur when the economy is at an inflection point.”
Susan Collins, President of the Boston Fed, commented that “the July employment data sent concerning signals.”
- The White House revealed that Russian President Vladimir Putin has expressed interest in meeting with U.S. President Donald Trump.
Foreign media report that Trump is pushing for a “three-way meeting” involving President Zelensky, following his potential meeting with Putin next week.
Key Economic Event This Week
+ August 7: Bank of England interest rate decision
GBPUSD Chart Analysis
The GBPUSD pair eventually broke below the 1.34000 level, retreating to around 1.31500. Although it has since rebounded, it’s unclear whether the upward momentum will hold.
To sustain the bullish trend, the pair must break through the 1.34000 resistance zone. If it succeeds, further gains up to the 1.37000 level are likely.
However, failure to overcome this resistance could result in a further decline toward the 1.30000 level.

Fidelis Insurance Stock Chart Fibonacci Analysis 080625Trading Idea
1) Find a FIBO slingshot
2) Check FIBO 61.80% level
3) Entry Point > 15.5/61.80%
Chart time frame:B
A) 15 min(1W-3M)
B) 1 hr(3M-6M)
C) 4 hr(6M-1year)
D) 1 day(1-3years)
Stock progress:A
A) Keep rising over 61.80% resistance
B) 61.80% resistance
C) 61.80% support
D) Hit the bottom
E) Hit the top
Stocks rise as they rise from support and fall from resistance. Our goal is to find a low support point and enter. It can be referred to as buying at the pullback point. The pullback point can be found with a Fibonacci extension of 61.80%. This is a step to find entry level. 1) Find a triangle (Fibonacci Speed Fan Line) that connects the high (resistance) and low (support) points of the stock in progress, where it is continuously expressed as a Slingshot, 2) and create a Fibonacci extension level for the first rising wave from the start point of slingshot pattern.
When the current price goes over 61.80% level , that can be a good entry point, especially if the SMA 100 and 200 curves are gathered together at 61.80%, it is a very good entry point.
As a great help, tradingview provides these Fibonacci speed fan lines and extension levels with ease. So if you use the Fibonacci fan line, the extension level, and the SMA 100/200 curve well, you can find an entry point for the stock market. At least you have to enter at this low point to avoid trading failure, and if you are skilled at entering this low point, with fibonacci6180 technique, your reading skill to chart will be greatly improved.
If you want to do day trading, please set the time frame to 5 minutes or 15 minutes, and you will see many of the low point of rising stocks.
If want to prefer long term range trading, you can set the time frame to 1 hr or 1 day.

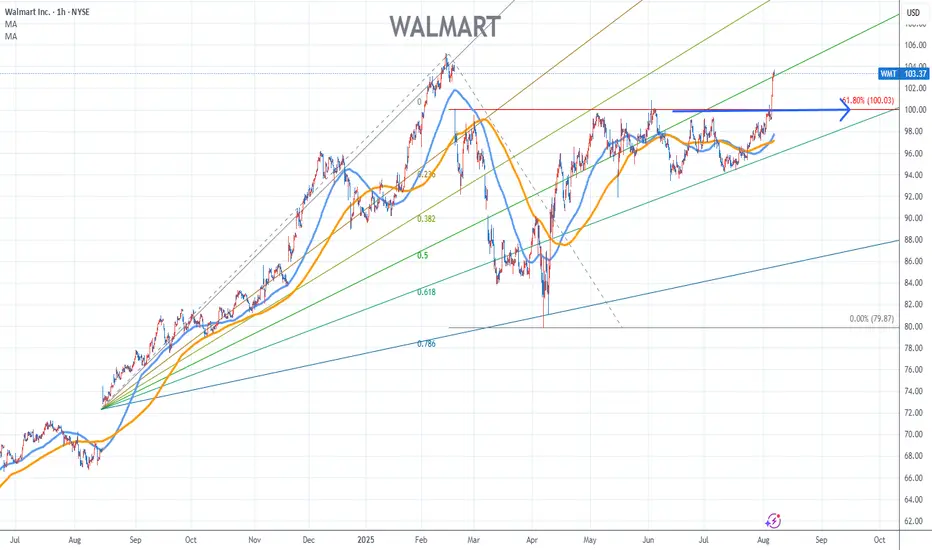
Walmart Stock Chart Fibonacci Analysis 080625Trading Idea
1) Find a FIBO slingshot
2) Check FIBO 61.80% level
3) Entry Point > 100/61.80%
Chart time frame:B
A) 15 min(1W-3M)
B) 1 hr(3M-6M)
C) 4 hr(6M-1year)
D) 1 day(1-3years)
Stock progress:A
A) Keep rising over 61.80% resistance
B) 61.80% resistance
C) 61.80% support
D) Hit the bottom
E) Hit the top
Stocks rise as they rise from support and fall from resistance. Our goal is to find a low support point and enter. It can be referred to as buying at the pullback point. The pullback point can be found with a Fibonacci extension of 61.80%. This is a step to find entry level. 1) Find a triangle (Fibonacci Speed Fan Line) that connects the high (resistance) and low (support) points of the stock in progress, where it is continuously expressed as a Slingshot, 2) and create a Fibonacci extension level for the first rising wave from the start point of slingshot pattern.
When the current price goes over 61.80% level , that can be a good entry point, especially if the SMA 100 and 200 curves are gathered together at 61.80%, it is a very good entry point.
As a great help, tradingview provides these Fibonacci speed fan lines and extension levels with ease. So if you use the Fibonacci fan line, the extension level, and the SMA 100/200 curve well, you can find an entry point for the stock market. At least you have to enter at this low point to avoid trading failure, and if you are skilled at entering this low point, with fibonacci6180 technique, your reading skill to chart will be greatly improved.
If you want to do day trading, please set the time frame to 5 minutes or 15 minutes, and you will see many of the low point of rising stocks.
If want to prefer long term range trading, you can set the time frame to 1 hr or 1 day.
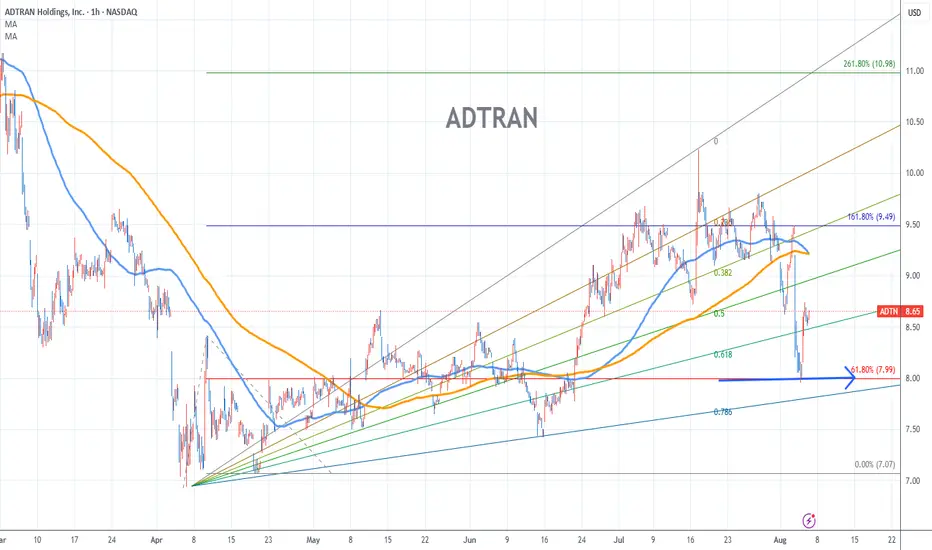
Adtran Stock Chart Fibonacci Analysis 080625Trading Idea
1) Find a FIBO slingshot
2) Check FIBO 61.80% level
3) Entry Point > 8/61.80%
Chart time frame:B
A) 15 min(1W-3M)
B) 1 hr(3M-6M)
C) 4 hr(6M-1year)
D) 1 day(1-3years)
Stock progress:C
A) Keep rising over 61.80% resistance
B) 61.80% resistance
C) 61.80% support
D) Hit the bottom
E) Hit the top
Stocks rise as they rise from support and fall from resistance. Our goal is to find a low support point and enter. It can be referred to as buying at the pullback point. The pullback point can be found with a Fibonacci extension of 61.80%. This is a step to find entry level. 1) Find a triangle (Fibonacci Speed Fan Line) that connects the high (resistance) and low (support) points of the stock in progress, where it is continuously expressed as a Slingshot, 2) and create a Fibonacci extension level for the first rising wave from the start point of slingshot pattern.
When the current price goes over 61.80% level , that can be a good entry point, especially if the SMA 100 and 200 curves are gathered together at 61.80%, it is a very good entry point.
As a great help, tradingview provides these Fibonacci speed fan lines and extension levels with ease. So if you use the Fibonacci fan line, the extension level, and the SMA 100/200 curve well, you can find an entry point for the stock market. At least you have to enter at this low point to avoid trading failure, and if you are skilled at entering this low point, with fibonacci6180 technique, your reading skill to chart will be greatly improved.
If you want to do day trading, please set the time frame to 5 minutes or 15 minutes, and you will see many of the low point of rising stocks.
If want to prefer long term range trading, you can set the time frame to 1 hr or 1 day.
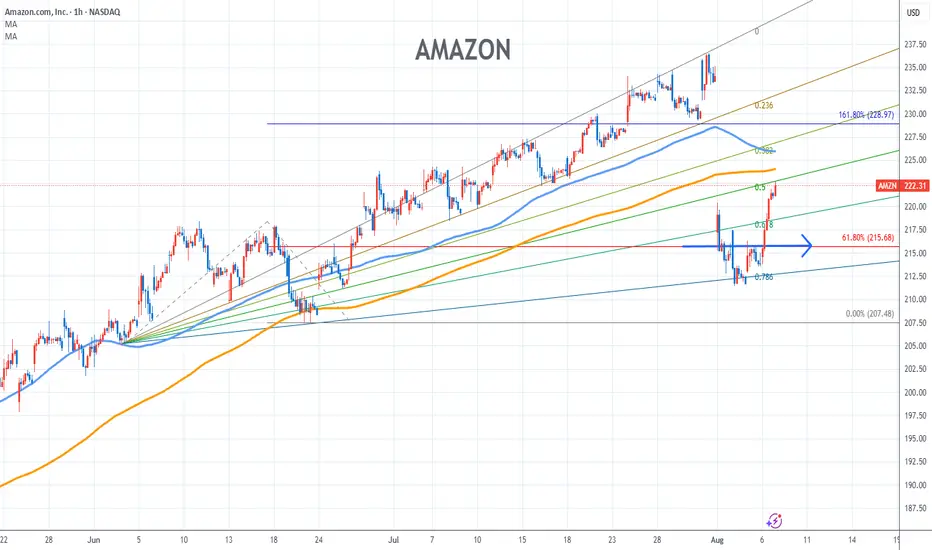
Amazon Stock Chart Fibonacci Analysis 080625Trading Idea
1) Find a FIBO slingshot
2) Check FIBO 61.80% level
3) Entry Point > 216/61.80%
Chart time frame:B
A) 15 min(1W-3M)
B) 1 hr(3M-6M)
C) 4 hr(6M-1year)
D) 1 day(1-3years)
Stock progress:A
A) Keep rising over 61.80% resistance
B) 61.80% resistance
C) 61.80% support
D) Hit the bottom
E) Hit the top
Stocks rise as they rise from support and fall from resistance. Our goal is to find a low support point and enter. It can be referred to as buying at the pullback point. The pullback point can be found with a Fibonacci extension of 61.80%. This is a step to find entry level. 1) Find a triangle (Fibonacci Speed Fan Line) that connects the high (resistance) and low (support) points of the stock in progress, where it is continuously expressed as a Slingshot, 2) and create a Fibonacci extension level for the first rising wave from the start point of slingshot pattern.
When the current price goes over 61.80% level , that can be a good entry point, especially if the SMA 100 and 200 curves are gathered together at 61.80%, it is a very good entry point.
As a great help, tradingview provides these Fibonacci speed fan lines and extension levels with ease. So if you use the Fibonacci fan line, the extension level, and the SMA 100/200 curve well, you can find an entry point for the stock market. At least you have to enter at this low point to avoid trading failure, and if you are skilled at entering this low point, with fibonacci6180 technique, your reading skill to chart will be greatly improved.
If you want to do day trading, please set the time frame to 5 minutes or 15 minutes, and you will see many of the low point of rising stocks.
If want to prefer long term range trading, you can set the time frame to 1 hr or 1 day.
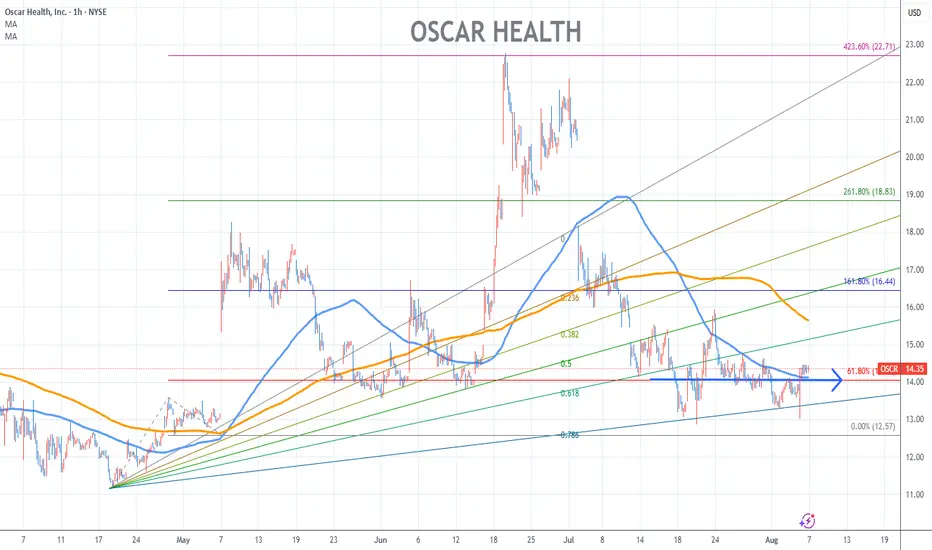
Oscar Health Stock Chart Fibonacci Analysis 080625Trading Idea
1) Find a FIBO slingshot
2) Check FIBO 61.80% level
3) Entry Point > 14/61.80%
Chart time frame:B
A) 15 min(1W-3M)
B) 1 hr(3M-6M)
C) 4 hr(6M-1year)
D) 1 day(1-3years)
Stock progress:A
A) Keep rising over 61.80% resistance
B) 61.80% resistance
C) 61.80% support
D) Hit the bottom
E) Hit the top
Stocks rise as they rise from support and fall from resistance. Our goal is to find a low support point and enter. It can be referred to as buying at the pullback point. The pullback point can be found with a Fibonacci extension of 61.80%. This is a step to find entry level. 1) Find a triangle (Fibonacci Speed Fan Line) that connects the high (resistance) and low (support) points of the stock in progress, where it is continuously expressed as a Slingshot, 2) and create a Fibonacci extension level for the first rising wave from the start point of slingshot pattern.
When the current price goes over 61.80% level , that can be a good entry point, especially if the SMA 100 and 200 curves are gathered together at 61.80%, it is a very good entry point.
As a great help, tradingview provides these Fibonacci speed fan lines and extension levels with ease. So if you use the Fibonacci fan line, the extension level, and the SMA 100/200 curve well, you can find an entry point for the stock market. At least you have to enter at this low point to avoid trading failure, and if you are skilled at entering this low point, with fibonacci6180 technique, your reading skill to chart will be greatly improved.
If you want to do day trading, please set the time frame to 5 minutes or 15 minutes, and you will see many of the low point of rising stocks.
If want to prefer long term range trading, you can set the time frame to 1 hr or 1 day.
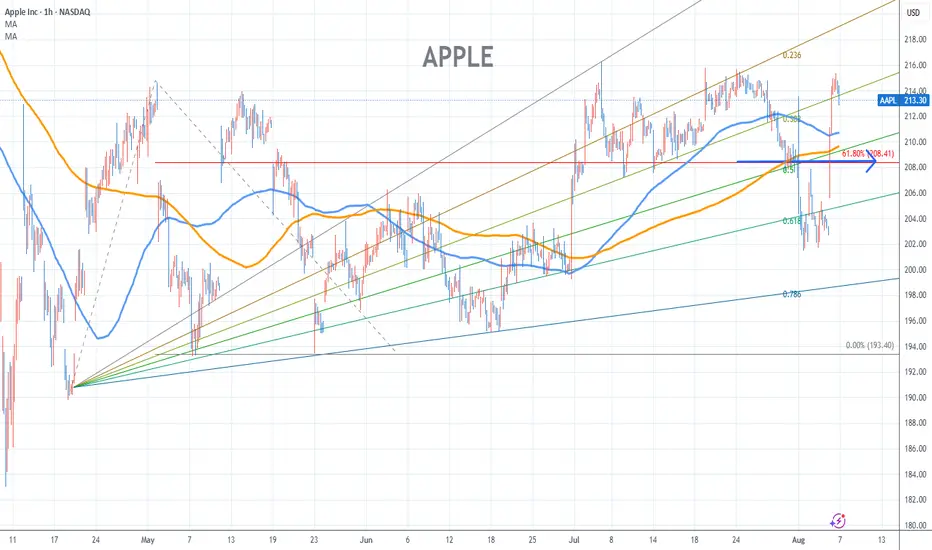
Apple Stock Chart Fibonacci Analysis 080625Trading Idea
1) Find a FIBO slingshot
2) Check FIBO 61.80% level
3) Entry Point > 208/61.80%
Chart time frame:B
A) 15 min(1W-3M)
B) 1 hr(3M-6M)
C) 4 hr(6M-1year)
D) 1 day(1-3years)
Stock progress:A
A) Keep rising over 61.80% resistance
B) 61.80% resistance
C) 61.80% support
D) Hit the bottom
E) Hit the top
Stocks rise as they rise from support and fall from resistance. Our goal is to find a low support point and enter. It can be referred to as buying at the pullback point. The pullback point can be found with a Fibonacci extension of 61.80%. This is a step to find entry level. 1) Find a triangle (Fibonacci Speed Fan Line) that connects the high (resistance) and low (support) points of the stock in progress, where it is continuously expressed as a Slingshot, 2) and create a Fibonacci extension level for the first rising wave from the start point of slingshot pattern.
When the current price goes over 61.80% level , that can be a good entry point, especially if the SMA 100 and 200 curves are gathered together at 61.80%, it is a very good entry point.
As a great help, tradingview provides these Fibonacci speed fan lines and extension levels with ease. So if you use the Fibonacci fan line, the extension level, and the SMA 100/200 curve well, you can find an entry point for the stock market. At least you have to enter at this low point to avoid trading failure, and if you are skilled at entering this low point, with fibonacci6180 technique, your reading skill to chart will be greatly improved.
If you want to do day trading, please set the time frame to 5 minutes or 15 minutes, and you will see many of the low point of rising stocks.
If want to prefer long term range trading, you can set the time frame to 1 hr or 1 day.
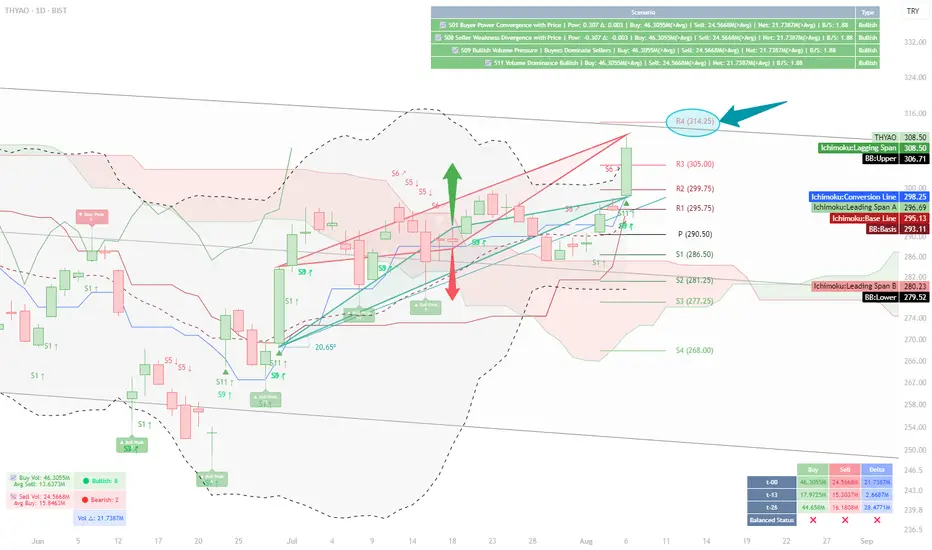
Volume and Structural Analysis of THYAO — Reaching Resistance at📝 Analysis:
My initial focus in this chart was on the daily buy and sell volumes.
According to the table displayed at the bottom of the chart for August 6th:
Buy Volume (t-0): 46.305M
Sell Volume (t-0): 24.566M
These values show a clear increase compared to previous checkpoints (t-13 and t-26).
Notably, the buy volume is 28.3M higher than t-13 and about 1.6M higher than t-26.
This gives us a broader picture: buying strength remains dominant, even though delta volume has not surpassed its value at t-26 (still about 7M short). Nevertheless, the current volume levels show stronger positioning compared to the mid-term past.
On the upper-right side of the chart, four system-based scenarios have been triggered via our custom indicator:
✅ Scenario 01 – Buyer Power Convergence with Price
✅ Scenario 08 – Seller Weakness Divergence
✅ Scenario 09 – Bullish Volume Pressure
✅ Scenario 11 – Volume Dominance Bullish
Together, they present a market that is tilting in favor of the buyers, with bullish sentiment supported by volume structure.
Next, my attention shifts to the triangle formations on the chart, which were automatically plotted based on cross high/low logic.
🔺 The green ascending triangle, with a slope of 20.65°, indicates a healthy and steady bullish structure.
Its top has not yet reached the resistance zone, where the red triangle forms a descending structure aligned with the R4 level at 314.25.
Beyond the technical interpretation, I also look at triangles symbolically.
Throughout history, from the Seal of Solomon (Star of David) to the Egyptian pyramids, triangles have represented stability, energy focus, and a path upward.
In this chart, that symbolism holds true — the green triangle embodies a progressive, rising support, while the red triangle offers a calculated obstacle.
What’s intriguing is the parallel structure of the triangle bases — suggesting a balanced energy field, ready to be tipped by momentum.
📊 When combined with other indicators:
Price is above the red Ichimoku cloud
It sits in the upper zone of the regression channel
Bollinger Bands show an upward breakout bias
Daily pivot levels align with this structure, and the R4 level (314.25) becomes a relevant resistance to monitor
📍 Conclusion:
Given the alignment of structural elements and volume behavior,
a move toward the resistance at 314.25 is well within reach under current market dynamics.
⚠️ This analysis is based on a custom-built indicator named Volume Based Analysis V 1.4+ and is provided strictly for educational and analytical purposes.
No investment or trading advice is intended.
👥 I welcome your interpretations and experiences —
Do you also see 314.25 as a realistic target?
SPX500 TECHNICAL ANALYSISSPX500 has broken above the recent range, reclaiming the 6,351.41 resistance. Price is now pushing into the 6,380.00 zone, with buyers showing control after a strong recovery from the 6,222.46 low.
Support at: 6,351.41 🔽 | 6,324.08 | 6,296.93
Resistance at: 6,380.00 🔼 | 6,409.21 | 6,438.44
🔎 Bias:
🔼 Bullish: Sustained trading above 6,351.41 opens the door toward 6,409.21 and higher.
🔽 Bearish: A close back below 6,351.41 may trigger a retest of 6,324.08 and 6,296.93.
📛 Disclaimer: This is not financial advice. Trade at your own risk.

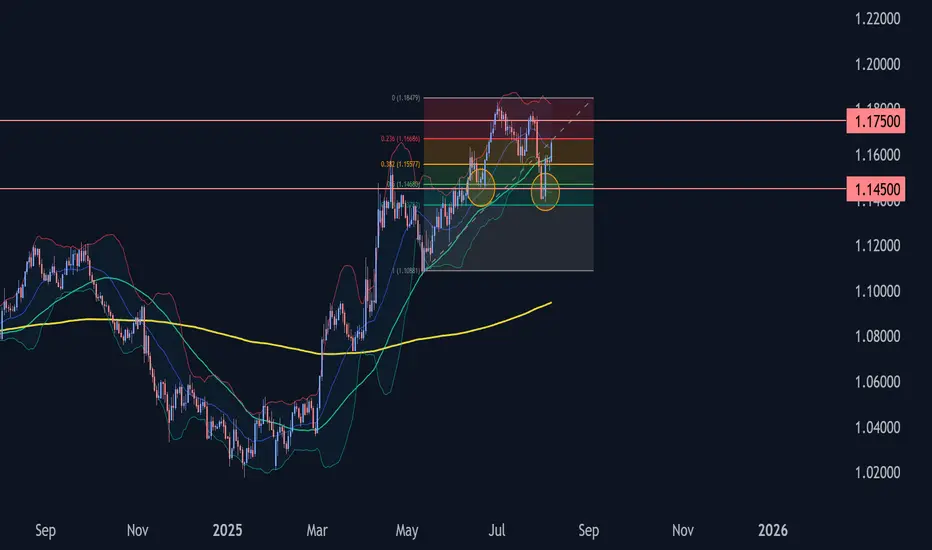
EURUSD Wave Analysis – 6 August 2025
- EURUSD reversed from support area
- Likely to rise to resistance level 1.1755
EURUSD currency pair recently reversed from the support area between the strong support level of 1.1500 (former low of wave iv from June), lower daily Bollinger Band and the 50% Fibonacci correction of the upward impulse 1 from May.
The upward reversal from this support area created the clear daily Japanese candlesticks reversal pattern Morning Star.
Given the clear daily uptrend and bearish us dollar sentiment seen today, EURUSD can be expected to rise to the next resistance level 1.1755.
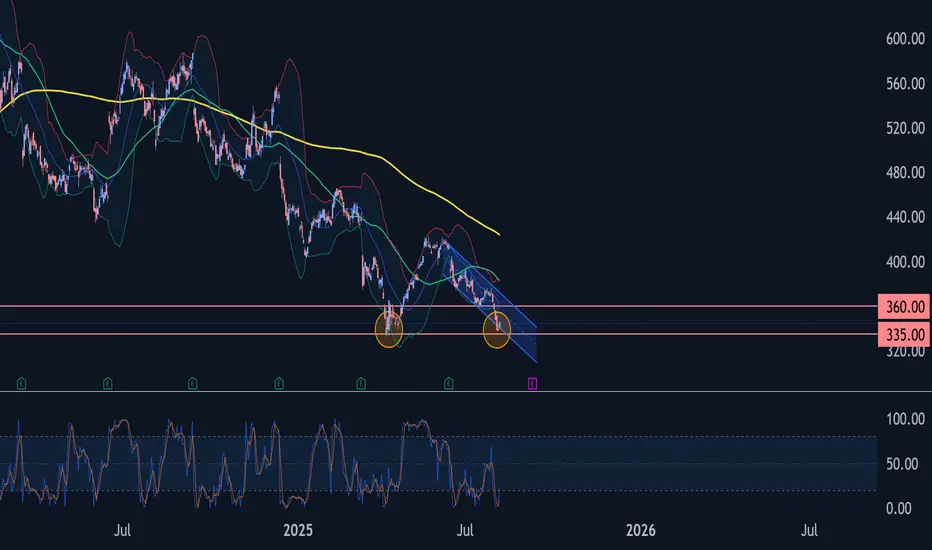
Adobe Wave Analysis – 6 August 2025- Adobe reversed from strong support level of 335.00
- Likely to rise to resistance level 360.00
Adobe recently reversed up from the support zone between the strong support level of 335.00 (which stopped the sharp daily downtrend in April) and the lower daily Bollinger Band.
This support zone was further strengthened by the support trendline of the daily down channel from the start of June.
Given the strength of the support level of 335.00 and the oversold daily Stochastic Adobe can be expected to rise to the next resistance level 360.00.
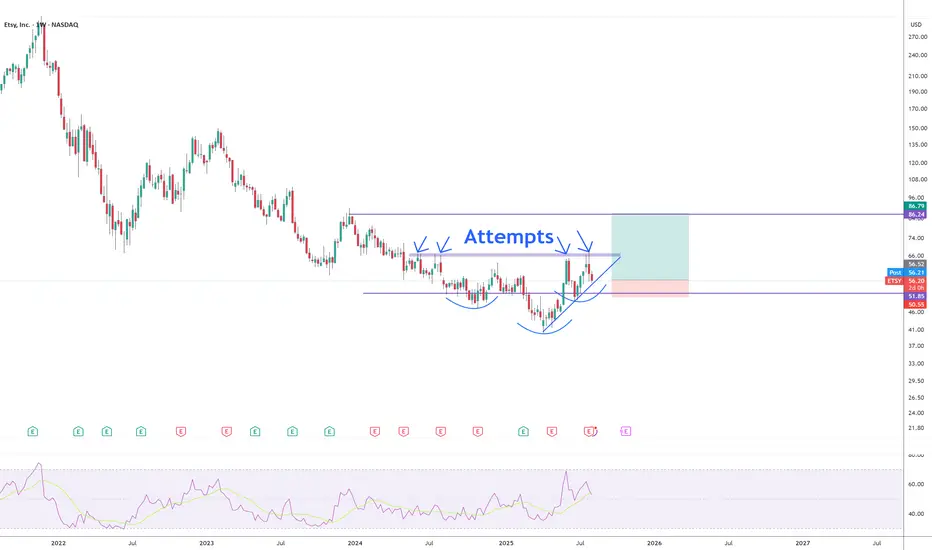
Many attempsInverse HS forming to break out the 67 resistance area. More than a year trying to break it, and now is forming a super bullish pattern to get over with it. Once it breaks it, will just go up. Hold this for a few months. SL if a weekly candle closes below the support area.
OSK eyes on $125.42/52: Double Golden Fibs likely to Orbit a bitOSK has been rising with the market and industrials.
It is hst just hit Dual Golden fibs at $125.42-125.52
Expecting a few orbits and possible dip from here.
.
This pair of Fibs called THE PREVIOUS TOP:
.
The smaller Golden Sisters also called THE BOTTOM:
Hit the BOOST and FOLLOW for more such PRECISE and TIMELY charts.
=============================================================
.

Figma first potential support $68I saw a lot of conversation about FIG post IPO. I thought I would share a chart on where I assume first major support exists and where the potential top might be.
$68 is first major support area. It's not a guarantee, support could be much lower because of how high above IPO price this opened, but if you want this stock I would start there with my bids.
Now *if* $196 is hit, that's where it's highly advisable to exit and sell. IPO buyers are *highly* likely to exit there.
Good luck!

RENDER gaining momentum As it reclaimed the 89 EMA and now it's acting as support, it might retest it once more before moving up to reclaim EMA 200
So I would say RENDER is gaining momentum again into the upper direction after showing a strong support on the green zone from the chart.
DYOR / NAFA

RBOB from $2.08 to $1.23Crude is in a downtrend and therefore so is RBOB and any other crude products. "Drill baby drill" as he says :/
Good luck!
