EU Long, Then, ShortM: Downtrend, made a new low
W: Uptrend, respecting the lows
D: Uptrend, price bbroke and retested trendline
4H: Downtrend, price retraced 78.6% and hit -61.8 on 4H fib and reversed to go long
1H: Downtrend, price broke and retested trendline. Aggressively long on NFP news (-jobs)
DXY is show bullish divergence
EU minor trend is showing bearish divergence.
CURRENTLY: I'm looking for price to go long to retest the 4H trendline @ the 1H support/resistance, then continue short.
Support and Resistance

ALAB $304 After Consolidation Around $180 Resistance/SupportALAB had a big rise today into $180 resistance. This should be an area where a small pullback occurs or a further rise and then pullback into what will be $180 support. (Personally I'm leaning towards pullback above $180 rather than below)
Keep an eye on the major trendline as if ALAB gets too far away it will eventually want back to that trendline.
$304 is the next target. All Information Technology / Computer stocks are in the middle of the a big uptrend so this one has room to run.

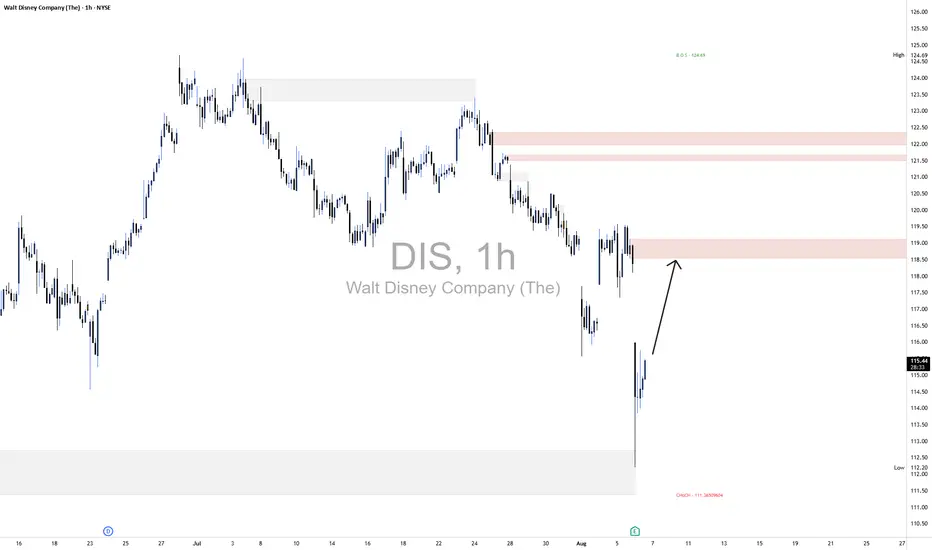
DIS Long The broader market structure on the 1-hour chart shows a clear downtrend with successive lower highs and lower lows. A Change of Character (CHoCH) is marked at 111.35, indicating a potential reversal after the recent strong bullish move from the demand zone below. However, no Break of Structure (BOS) has yet been confirmed on the upside, so caution is still warranted until a clean high is taken.
In terms of supply and demand, the lower grey zone near 111–113 acted as a strong demand area, where buyers stepped in aggressively, triggering a sharp reversal to the upside. This suggests a high-probability area where institutional buying may have occurred. Above, there’s a supply zone between 118.50–119.50, from which price previously dropped rapidly. This indicates strong selling pressure and unfilled orders still residing there.
Price is currently approaching this supply region after a strong impulsive rally from the demand base. Within the marked region, price action is climbing with momentum, printing higher highs and shallow pullbacks. We may see price tap into the 118.50–119.50 supply and react—either rejecting lower or consolidating before pushing higher.
The current trade bias is bullish, with expectations for price to test the 118.50–119.50 supply zone. However, invalidation of this bias would occur if price breaks below 114.80, which would suggest loss of bullish momentum and a possible revisit of the demand zone near 112.
Momentum currently favors buyers, as seen by strong bullish candles and minimal bearish follow-through. There are no major candle reversal patterns yet, indicating continuation remains probable for now.
Key Levels for the Month 08/2025 ∷BitCoin∷🐍 Key Levels Overview for the Month 🐍
__________________________
Trend Base Lines
112738🐂🐂126892
109075🏛🏛116609
108381🐻🐻99947
__________________________
Resistances🔀
167037
156477
150687
143341
,
140311
1373677
,
135631
,
133642
129960
,
126740
123157
117194
111745
108583
Mids∷∷∷
145917
127698
125945
123889
,
121716
,
120788
,
119809
,
118769
117518
,
116567
114699
111056
105421
Supports🔀
135356
124796
113575
112056
,
107960
,
107177
106397
105620
,
104616
,
103911
103062
,
102214
101204
98780
Technical Analysis | Gold (XAU/USD) | 4-Hour Timeframe Technical Analysis | Gold (XAU/USD) | 4-Hour Timeframe
Currently, the price is trading below a significant resistance zone that has previously triggered strong reactions. In the current scenario, if the mid-support zone (the red midline) is broken, we could expect a further correction toward the lower boundary of the same range.
However, if a strong bullish candle forms and a valid entry trigger appears near this support zone, there's potential for a price rebound, possibly leading to a move back toward the resistance levels and even the top of the channel.
📍 Key Levels:
Major Resistance: Red zone around 3390
Mid-Support: Around 3370
Lower Support: Around 3350
📈 Scenarios:
Resistance Breakout: Potential move toward previous high near 3410
Mid-Support Break: Correction toward the green zone, with a possible bullish reversal if a trigger is confirmed


Sideways actionLots of cool between zones more apparent in the 5 minute time frame. No significant news. What are yalls thoughts? I was originally short but my ideal entry keeps teasing me and I took a dumb long. Should have been more patient on my end.
XAUUSD H1 – Elliott Wave & S/R AnalysisStructure & Current Outlook
Impulsive Wave Up:
-Price is moving in a clear 5-wave structure (i–ii–iii–iv–v), now heading towards completion of wave (v) / ⑤.
Critical Resistance Ahead:
-The main resistance/red supply zone sits around 3,393 – 3,421. This is your likely target for the final push.
After Completion:
Expect a reversal or sharp pullback once the 5-wave impulse completes inside the red zone.
Possible move down to the blue demand zones (starting 3,350–3,325).
Trade Plan Idea
Intraday Long:
Can ride the move up towards 3,393–3,421, but reduce risk and watch for exhaustion.
Watch for Reversal:
Look for bearish setups/confirmation inside the red zone to enter shorts, targeting the next blue demand below.
Confirmation:
Wait for candlestick reversal or momentum divergence before going short.

USDCAD SELL OPPORTUNITY Price just formed and broke the symmetrical triangle pattern which is a sign of bearish continuation from the pullback resistance of 1.38550 therefore, a sell opportunity is envisaged from the current market price. Target price is 1.36918

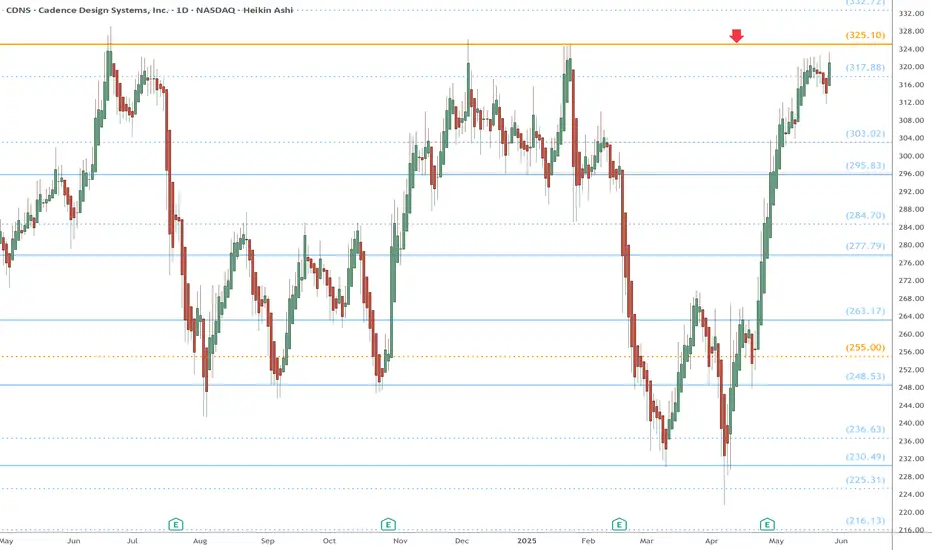
CDNS watch $325.10: Golden Genesis Fib ceiling for over 2 yearsCDNS has topped here many times over the last 2 years.
Golden Genesis fibs are massive landmarks for any asset.
This one has marked THE TOP for over 2 years thus far.
It is PROBABLE that we "Orbit" this a few times.
It is POSSIBLE that we reject for another top.
It is PLAUSIBLE to Break and run to new ATH.
=================================================
.
The market trend is still there, go long on the pullback#XAUUSD
Yesterday, gold experienced a V-shaped reversal: it was blocked at the 3382 line in the morning and then fluctuated and fell, then it fell to the support near 3349 and stabilized and rebounded, then rebounded to near 3390 in the evening and closed with a doji on the daily line. Judging from the overall trend, the bullish pattern has not changed.
Gold has limited room for decline in the short term, and a sharp drop is unlikely. Today's market tends to adjust and correct first before continuing to rise. The adjustment is only short-term, and is more to give everyone enough opportunities to get on board. The focus of the market below is 3375-3360, with the target looking at yesterday's high around 3390-3395. A break is expected to extend to the 3400-3420 area.
🚀 BUY 3375-3360
🚀 TP 3390-3395

Support & Resistance – Quick Guide In 5 StepsSupport and resistance are key concepts in technical analysis that help traders identify where price is likely to react.
Support acts like a floor — a level where buying interest is strong enough to prevent further declines.
Resistance acts like a ceiling — a level where selling pressure can stop price from rising.
These zones often lead to bounces, reversals, or breakouts, and are used to plan entries, exits, and stop-losses.
How to Identify them:
1. Assess the chart.
2. Identify Swing Points: Look for repeated highs/lows and label them. (Flags)
3. Multiple touches: Highlight the zones with multiple touches. 2+ Touches are stronger.
4. Define: Clearly define the zones. Above is resistance, below is support.
5. Entry: When price makes it way down to support, wait for the reversal. Upon reversal enter on the low time confirmation. Ensure price has failed to break below the support.
Then set TP to the previous High/Resistance zone.
Tips:
Always treat S&R as zones, not exact lines.
Combine with trend, candlestick patterns, or volume for better confluences.
Avoid trading into strong S/R — wait for breaks or retests.

GOLD | Gold Eyes Pivot at 3347 – NY Session Close KeyGOLD | Gold Eyes Pivot at 3347 – NY Session Close Key
🕯Gold slipped slightly on Tuesday due to a stronger dollar, but remains close to a two-week high amid growing expectations of a U.S. rate cut in September.
⏺ Price has begun to retreat from the 3380 resistance, now heading toward the pivot level at 3347.
We’re watching for a potential reversal from 3347, especially if a 4H candle closes above this level during the New York session — this could trigger a bullish recovery toward 3365, and possibly retest 3380.
⏺ A confirmed breakout above 3380 would open the path for further upside toward 3402, but only if strong momentum is sustained.
If price closes below 3347 on the 1H, and this is confirmed by a 4H candle, it would likely reactivate bearish pressure toward the 3320 support.
• Resistance: 3365 – 3380 – 3402
• Support: 3320 – 3313

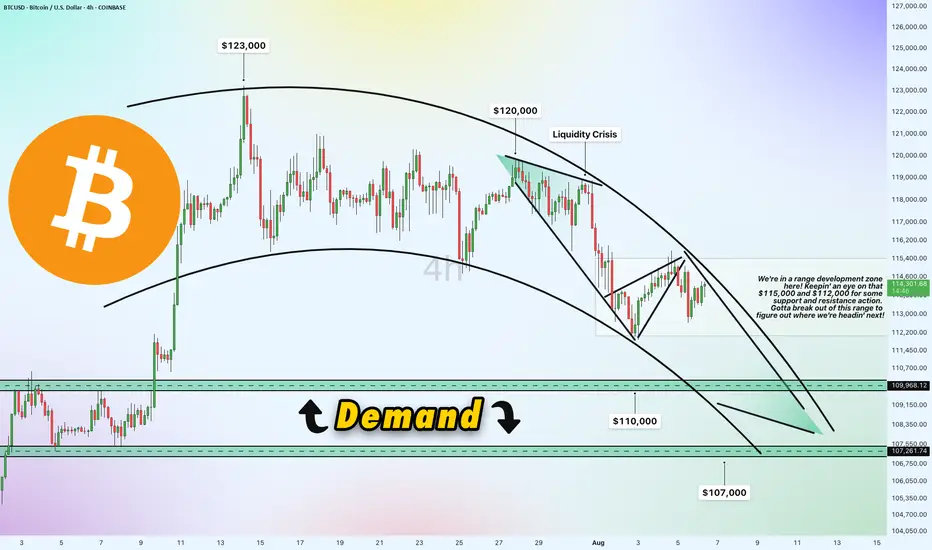
Bitcoin 4h Chart Update [Tight Range / Breakout Opportunities]Breakout Opportunities
We're in a range development zone here! The chart shows Bitcoin (BTC/USD) trading within a tight range, with key levels at $115,000 and $112,000 acting as critical support and resistance zones. The price recently peaked near $123,000 but has since pulled back, forming a liquidity crisis zone around $120,000 where selling pressure kicked in. A breakout above $115,000 could signal a move toward $120,000 or higher, while a drop below $112,000 might push it toward the demand zone. Gotta break out of this range to figure out where we're headin' next!
Demand Zone
$110,000 & $107,000
Price slipped down from $120,000 due to a lack of buying liquidity, potentially it will land into a demand zone between $110,000 and $107,000. This area could act as a strong support level where buyers might step in. If the price holds here, it could bounce back toward the $112,000-$115,000 range. However, a failure to hold this zone might see it test lower support around $107,000 or even $105,000.
Direction and Possible Ranges
Upward Potential: If Bitcoin breaks above $115,000 with strong volume, the next targets could be $120,000 (liquidity crisis zone) and potentially $123,000, aligning with recent highs. A sustained move above $120,000 might open the door to $125,000 or beyond.
Downward Risk: Should the price fail to hold above $112,000 and break below, it could slide into the demand zone ($110,000-$107,000). Further weakness might push it toward $105,000, a psychological and technical support level.
Current Trend: The chart shows a descending trendline from the $123,000 peak, suggesting bearish pressure unless a decisive breakout occurs. The 4-hour timeframe indicates indecision, with the range-bound action hinting at a potential volatile move once direction is confirmed.
Keep an eye on these levels for the next big move!
Dollar Index (DXY): Important Bearish BreakoutThe Dollar Index has fallen below a key daily/intraday support level,
which has now become resistance.
A bearish trend is likely to persist, with the next target set at 98.15.

London Session TradesSimplistic entry type where am combining support and resistance with TIME GER30 Killed

Correction first and then rise during the day, TP3400Yesterday, gold hit the bottom near 3350 and then quickly rose to break the high. It fell back slightly in the evening and closed with volatility. The daily line closed with a long lower shadow bullish line. The short-term correction process has been completed, and there is still momentum for an upward impact. The overall structure is still a bullish trend. Focus on 3365-3355 below. As long as the bullish thinking above this level remains unchanged, any decline will provide an opportunity to enter the market. The target can be around yesterday's high of 3390. Once it breaks through 3390, the gold price is expected to reach 3405-3415.
OANDA:XAUUSD

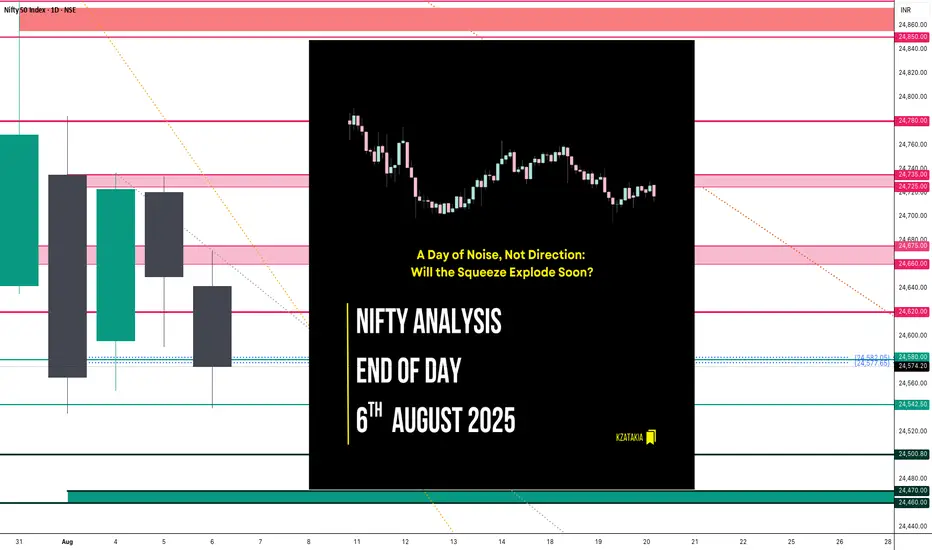
Nifty Analysis EOD – August 6, 2025 – Wednesday 🟢 Nifty Analysis EOD – August 6, 2025 – Wednesday 🔴
A Day of Noise, Not Direction: Will the Squeeze Explode Soon?
Nifty started flat with indecisive vibes, struggling initially around the 24,660 ~ 24,675 zone. After multiple failed attempts to hold, it slipped toward 24,580 — a cluster of PDL + S1 + Key Support — and broke below, forming the IB Low.
A quick bounce followed, but the index was firmly rejected near the VWAP + CPR + Fib zone, pushing it to a new day low at 24,544. Repeated intraday bounces faced selling pressure around 24,620, while 24,540 provided solid support — creating a tight intraday range.
Despite a perfect CPR setup for breakout, the market moved within just 132 points, the narrowest range in the last 4 sessions. A compression phase is building; breakout traders may soon get their moment.
📉 5 Min Time Frame Chart with Intraday Levels
🗣 Voice of the Intraday Option Buyer
Trend direction flipped multiple times — bearish to bullish and vice versa.
PDL + S1 zone experienced repeated fakeouts.
Low conviction moves on both sides frustrated momentum setups.
RBI event also not enough strong or trigger to guide directional bias.
Bank Nifty broke IB Low → IB High, closed strong; Nifty stayed muted.
Weekly expiry ahead — theta decay took control.
Many traders, including myself, anticipated a double inside bar breakout — but the trap continued.
Last 4 sessions (since Aug 1) have been painful for intraday option buyers — but it's all part of the game.
📉 Daily Time Frame Chart with Intraday Levels
🕯️ Daily Candle Breakdown
Open: 24,641.35
High: 24,671.40
Low: 24,539.20
Close: 24,574.20
Change: −75.35 (−0.31%)
Candle Structure:
Real Body: Red candle (67.15 pts)
Upper Wick: 30.05 pts
Lower Wick: 35.00 pts
Interpretation:
Attempted upside early on but couldn’t hold.
Both wicks show intraday tug-of-war; red close confirms sellers still in control.
Repeated rejection from 24,660–24,675 highlights weak bullish attempts.
Candle Type:
Bearish indecision candle — resembles an Inverted Hammer, indicating weakness despite dip buying attempts.
🔍 Nifty Short-Term View – As of August 6, 2025
Last 5 sessions show directional fatigue and failed bullish attempts above 24,700.
Two consecutive inside bars signal tight range and pending breakout.
Lower closes and long lower wicks = sellers dominate, but buyers defend dips.
Break below 24,535 = fresh selling.
Close above 24,660 = potential short-covering rally.
📌 Conclusion:
Nifty is coiling — a strong breakout may soon end this sideways-to-weak grind.
🛡 5 Min Intraday Chart
⚔️ Gladiator Strategy Update
ATR: 195.66
IB Range: 91.70 → Medium
Market Structure: Balanced
Trade Summary:
⏱ 10:35 AM – Short Entry → SL Hit
⏱ 12:15 PM – Long Entry → SL Hit
📏 Today's CPR Setup presenting...
Value Relationship: Inside Value → Breakout-Ready
Avg CPR Width: 37.54
Today’s CPR Width: 8.10 (🟠 21.58%)
CPR Type: Narrow → Perfect setup for big expansion
⚠️ Today’s setup didn’t deliver, but backtests show such narrow CPRs often explode in the following session.
📌 Support & Resistance Levels
🔼 Resistance Zones:
24,620
24,660 ~ 24,675
24,725 ~ 24,735
24,780 ~ 24,795
24,860 ~ 24,880
🔽 Support Zones:
24,542 ~ 24,535
24,500
24,470 ~ 24,460
🧠 Final Thoughts
The market is in consolidation mode with narrowing range. The double inside bar setup points to an imminent move — be prepared for a breakout trade soon. Don’t lose patience; big days often follow tough ones.
🛡 Disclaimer
This analysis is shared for educational purposes only. It is not trading advice. Please consult your financial advisor before making any trading decisions. Always trade with proper risk management.
SOL's Golden Pocket: Is This the Bottom?SOL just tapped into the golden pocket zone and swept sell-side liquidity. Creating a high-probability long opportunity.
🟢 Long Setup:
Entry Zone: $156.67 – $151.50
Stop Loss: Below $150 (clear invalidation)
Target: $172
Risk:Reward: solid R:R setup
Why This Zone? Confluence Breakdown:
Golden Pocket retracement (0.618–0.666)
1.272 Trend-Based Fib Extension
Monthly Order Block
0.5 Fib Speed Fan support
Key Level at $154.81
Anchored VWAP support layer
Pitchfork 0.618/0.666 alignment
SSL (Sell-Side Liquidity) swept
nPOC at ~$152 offers a prime entry if we see another leg down
💡 Tip: Ladder in entries within the zone and size up near nPOC if price dips further. Manage risk carefully and watch how price reacts at the zone.
🧠 Educational Insight
Golden pockets (the 0.618–0.666 Fibonacci zone) are some of the most respected levels in trading often acting as key reversal zones, especially when stacked with other tools. In this case, we’ve got a rare confluence: anchored VWAP, nPOC, monthly OB, SSL sweep etc. all lining up with the golden pocket.
When multiple technical factors align, they don’t just increase probability, they give you a tighter invalidation and a better risk-to-reward setup. That’s how professional traders spot sniper entries.
_________________________________
💬 If you found this helpful, drop a like and comment!

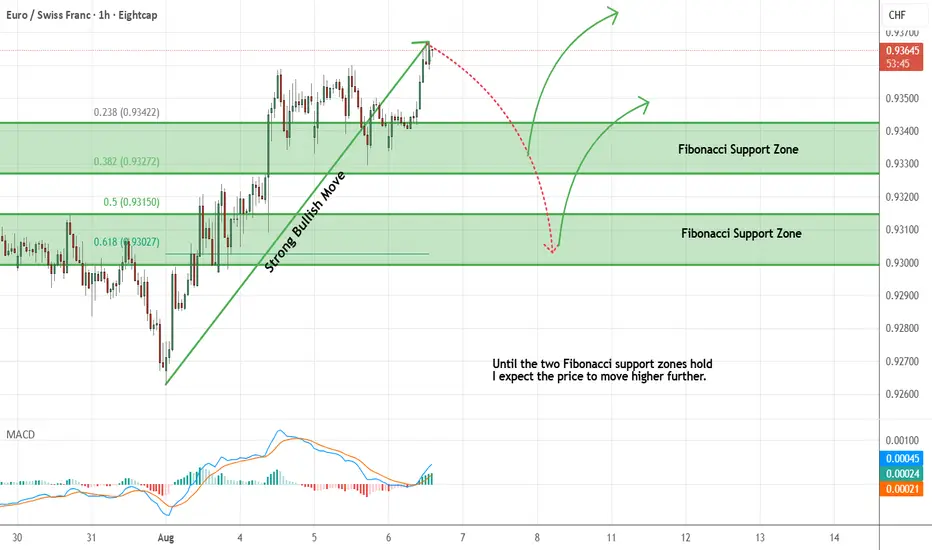
EURCHF - Expecting Bullish Continuation In The Short TermH1 - Strong bullish momentum.
No opposite signs.
Until the two Fibonacci support zones hold I expect the price to move higher further.
If you enjoy this idea, don’t forget to LIKE 👍, FOLLOW ✅, SHARE 🙌, and COMMENT ✍! Drop your thoughts and charts below to keep the discussion going. Your support helps keep this content free and reach more people! 🚀
--------------------------------------------------------------------------------------------------------------------
EURJPYBroke out of a strong daily/H4 resistance zone, retested multiple times with inverse head and shoulder forming on the H1.

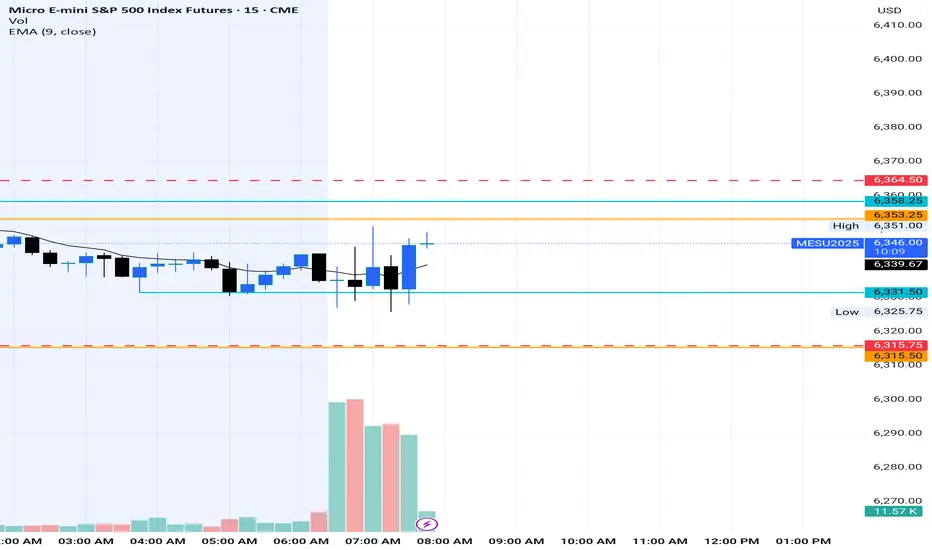
SPX500 in Focus – Breakout Needed Above 6346SPX500 – Technical Overview
The price is currently showing bearish momentum as long as it remains below 6341 and 6323, with a downside target at 6283.
🔻 As long as the price trades below 6341, the bearish bias remains intact.
🔼 For the trend to shift bullish, we need a confirmed 1H close above 6346, which could open the path toward 6365 and higher.
🔹 Resistance: 6341, 6365, 6389
🔹 Support: 6298, 6283, 6247

NZDUSD Potential UpsidesHey Traders, in today's trading session we are monitoring NZDUSD for a buying opportunity around 0.59050 zone, NZDUSD is trading in an uptrend and currently is in a correction phase in which it is approaching the trend at 0.59050 support and resistance area.
Trade safe, Joe.
