EURJPY: Rejection Block Support Fuels Bullish momentum!Greetings Traders,
In today’s analysis of EURJPY, recent price action confirms the presence of bullish institutional order flow. As a result, we aim to align ourselves with this directional bias by seeking high-probability buying opportunities that target the long-term highs, where a significant liquidity pool resides.
Key Observations:
Weekly Timeframe Insight:
Last week, price retraced into a weekly bullish Fair Value Gap (FVG), which has acted as a strong support zone. This reaction has initiated a bullish response across lower timeframes, validating the weekly FVG as a meaningful area of institutional demand.
H4 Bullish Market Structure Shift:
Following the weekly bounce, the H4 chart presented a clear bullish Market Structure Shift (MSS), signaling the onset of upward momentum. Price then retraced into an extreme discount, where it found support at a well-defined Rejection Block—an institutional array we expect to hold as a launchpad for further bullish continuation.
Trading Plan:
Entry Strategy:
Monitor the Rejection Block zone for bullish confirmation setups on lower timeframes (M15 and below) to validate potential long entries.
Target Objective:
The draw on liquidity remains at higher premium levels, with the liquidity pool above the long-term highs serving as our primary objective.
For a detailed market walkthrough and in-depth execution zones, be sure to watch this week’s Forex Market Breakdown:
As always, exercise patience, wait for confirmation, and maintain strict risk management.
Kind regards,
The Architect 🏛️📈
Support and Resistance

DeGRAM | BNBUSD held the support line📊 Technical Analysis
● BNBUSD rebounded from the purple rising support line and is now forming higher lows above the 750 support, aligning with the long-term channel base.
● The price structure suggests a bullish continuation toward 808.5 and 847.3 if price holds above 750, with a zigzag consolidation pattern indicating controlled accumulation.
💡 Fundamental Analysis
● Rising user activity and new project launches on BNB Chain continue to attract liquidity, while Binance's recent compliance wins restore investor confidence.
✨ Summary
Buy 755–765; hold >750 targets 808.5 → 847.3. Setup invalidated on daily close <735.
-------------------
Share your opinion in the comments and support the idea with a like. Thanks for your support!

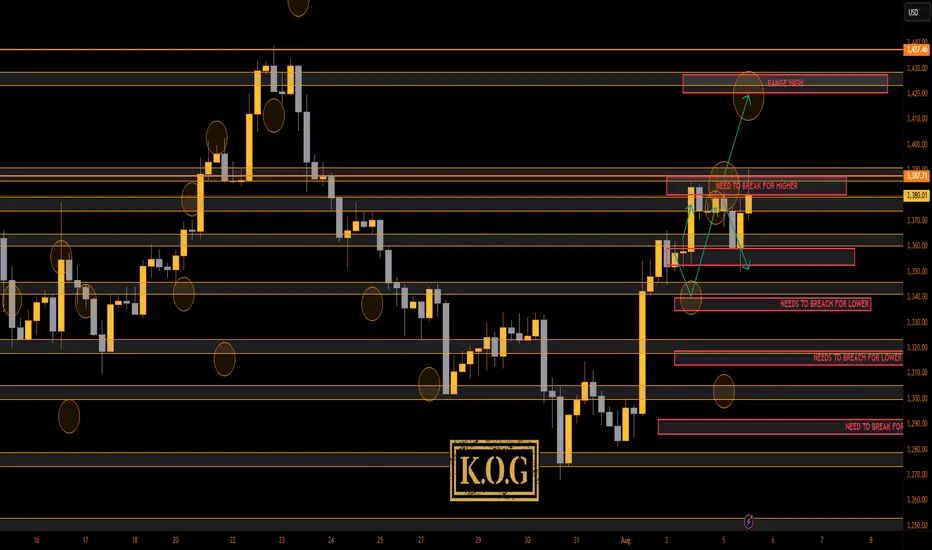
THE KOG REPORT - UpdateEnd of day update from us here at KOG:
What a mission with gold, swings one way, swing the other, taking liquidity within the range and yet sticking with the illustration posted. We managed to get the move upside, pin point short into the level we wanted and then a bounce from the 3350 level again! We had a target lower, but suggested we wait for the 3370-5 level which we weren't happy with and ultimately broke, only then to give us the long into the LiTE and Excalibur targets and to complete most of the red box targets.
We now have support here at the 3375 level with extension in 3368 which are the levels that need to hold us up, then break the red box and we can attempt the higher levels.
KOG’s bias for the week:
Bullish above 3340 with targets above 3370✅, 3373✅, 3379✅ and above that 3384✅
Bearish on break of 3340 with targets below 3330, 3320 and below that 3310
RED BOXES:
Break above 3365 for 3372✅, 3375✅, 3379✅, 3384✅ and 3390✅ in extension of the move
Break below 3350 for 3346, 3340, 3335 and 3330 in extension of the move
As always, trade safe.
KOG
Nifty levels - Aug 07, 2025Nifty support and resistance levels are valuable tools for making informed trading decisions, specifically when combined with the analysis of 5-minute timeframe candlesticks and VWAP. By closely monitoring these levels and observing the price movements within this timeframe, traders can enhance the accuracy of their entry and exit points. It is important to bear in mind that support and resistance levels are not fixed, and they can change over time as market conditions evolve.
The dashed lines on the chart indicate the reaction levels, serving as additional points of significance to consider. Furthermore, take note of the response at the levels of the High, Low, and Close values from the day prior.
We hope you find this information beneficial in your trading endeavors.
* If you found the idea appealing, kindly tap the Boost icon located below the chart. We encourage you to share your thoughts and comments regarding it.
Wishing you success in your trading activities!

BankNifty levels - Aug 07, 2025Utilizing the support and resistance levels of BankNifty, along with the 5-minute timeframe candlesticks and VWAP, can enhance the precision of trade entries and exits on or near these levels. It is crucial to recognize that these levels are not static, and they undergo alterations as market dynamics evolve.
The dashed lines on the chart indicate the reaction levels, serving as additional points of significance. Furthermore, take note of the response at the levels of the High, Low, and Close values from the day prior.
We trust that this information proves valuable to you.
* If you found the idea appealing, kindly tap the Boost icon located below the chart. We encourage you to share your thoughts and comments regarding it.
Wishing you successful trading endeavors!

EURJPY LONG After seeing price reject 170.000 monthly area of institutional support we saw a sharp push to the upside on the weekly timeframe from last week and we could see the market push to the upside not that the 4hr broke area of structure resistance

DeGRAM | USDJPY will retest the support level📊 Technical Analysis
● USDJPY is riding an ascending channel after a bullish breakout above the long-term descending trendline and successful retests of the 144.9–146.6 zone as support.
● Price is carving higher highs and higher lows, with the current bullish pennant pointing to a measured move toward the 150.8 resistance if 147.2 is breached on strong momentum.
💡 Fundamental Analysis
● The yen remains under pressure as US labor data stays firm and Fed officials hint at fewer cuts, reinforcing US-Japan rate divergence.
● BOJ’s dovish tone in recent speeches and widening trade deficit further weigh on JPY.
✨ Summary
Buy 145.2–146.2; confirmation >147.2 targets 150.8. Invalidation below 142.8 support zone.
-------------------
Share your opinion in the comments and support the idea with like. Thanks for your support!

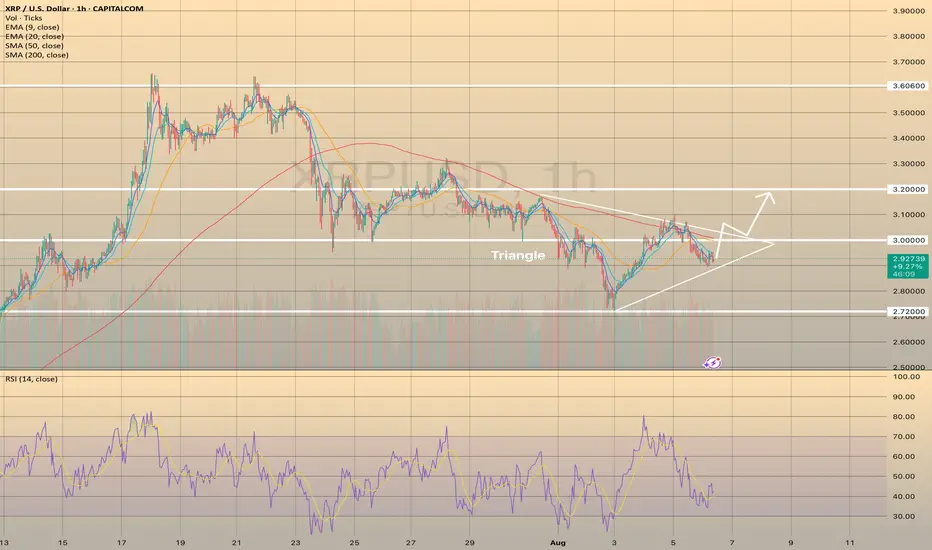
XRPUSD formed the Triangle pattern. The price may increase.XRPUSD formed the Triangle pattern. The price may increase.
XRPUSD has been declining since July 23, reaching the lowest mark at 2.72000 on August 3. Since then the price started to form the triangle pattern. It is not a reversal chart pattern, however, RSI indicator started to show some strength of the bullish momentum. In this case, if the price breaks through the SMA200 on hourly chart and holds above it and the level of 3.00000, the following rise towards 3.20000 is expected.
EURUSD- 6/8/25 - bullish pushAfter last week's high momentum bullish move, the last few days has resulted in a consolidation with a price ceiling that has been tested about 4 times - equal high liquidity zone.
Ideally i would like a pull back to trigger a bullish move.
+ve:
1. equal high liquidity that has been tested 4 times
2. continuing with bullish momentum
-ve:
1. Large imbalance below this zone which could draw price lower

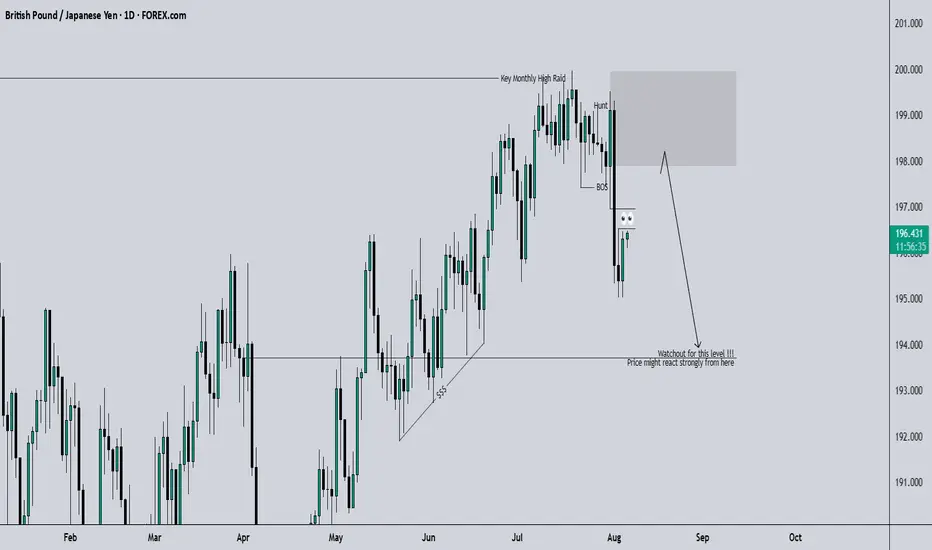
GBPJPY SWING: SHORT-TERM BEARISH OPPORTUNITYHi there,
Overall for the 3rd quarter of the year, I speculate a bullish candle close, however, for price to rally, it needs to trade lower to gather the needed liquidity. Hence, the short-term bearish move.
If you turn your chart to the 3M, you will see the wick of the last quarter's candle which translates to the Monthly OB that price is most likely to trade into after running multiple stops.
Check out my next post on CADJPY.
Cheers,
Jabari
The shot at the critical moment is the real trading opportunityGold bottomed out and rebounded yesterday, breaking the high slightly to touch 3390 before falling back. The daily line closed with a small bullish cross overnight, and the upward momentum has slowed down. Today it tends to fluctuate at a high level. In the 4H cycle, the Bollinger band is closing, and the overall bulls continue to run upward. The big positive line directly pulls up, which is relatively strong. The overall market is resistant to declines. Therefore, the big cycle does not expect a big drop for the time being, but the short-term trend fails to continue further. It is safe to maintain a pullback and go long. Pay attention to the support below 3365-3350. Go long after it stabilizes. First look at yesterday's high of 3390. If it breaks, there is a probability of going to 3400 or even around 3415, but be careful of a high rush and fall.

PACS - An under the radar name that should be watchedFor a little more context on this chart, please do your own fundamental research - but from what I've been told, this is way undervalued and is still suffering from a Hindenberg report a year ago that is no longer of substance.
Technically speaking, we are seeing some beautiful tapering within our HTF strong selling red algorithm - We have a clear path toward proving white/bullish tapering that I identify in this video.
Happy Trading :)

WTI Crude Oil – Range Support in FocusWe're waiting for price to reach the bottom of the range, and with a solid buy signal, we’ll consider going long.
However, since this level has been tested multiple times, it’s highly vulnerable to stop fishing — so caution is key.
As always, we’re ready for all scenarios:
If price breaks below, we’ll wait for a pullback to enter short.
But right now, we’re watching the range support for potential longs

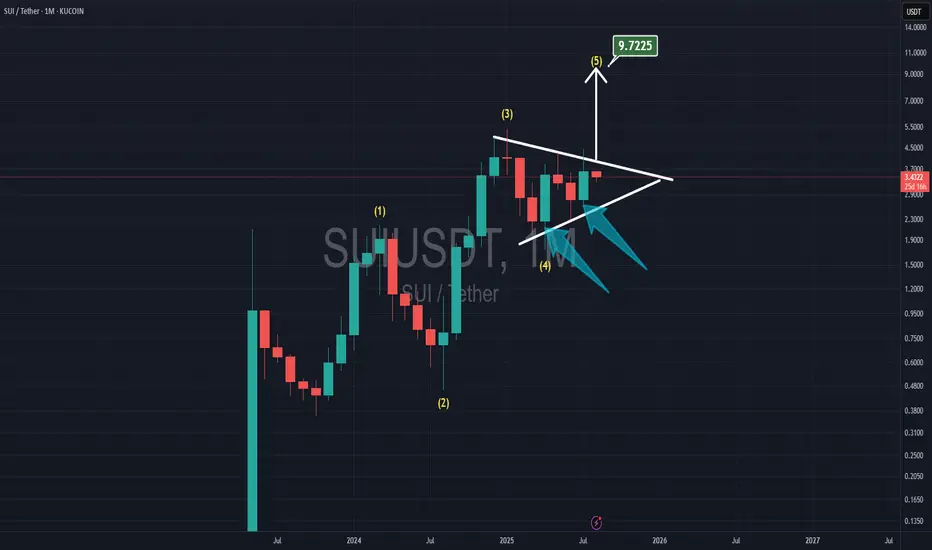
SUI TO $10.00With Elliot waves count, now SUI is in the 5th wave.
It has 2 bullish monthly candles for April & July, and SUI is playing inside the triangle which shows me with the breakthrough the resistance, the target is at $10
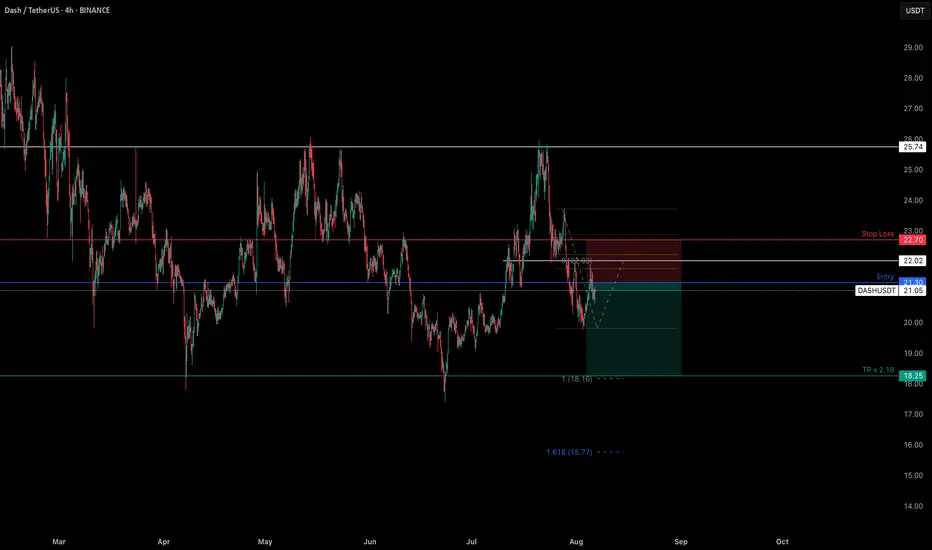
DASHUSDT - SHORTMarket Structure: Based on the 1D TF, there is a support level @ 17.25 and a resistance level @ 25.74. On July 23, the price of DASHUSDT bounced off the resistance level therefore we can assume that the price will move towards the support level @ 17.25.
Area of Value: Based on the 4H TF, we can see the possible pivot points with the confluence of the Fib. Retracement and Resistance level @ 22.02.
Entry: We have entered the trade @ 21.30, after a justifiable bounce off our Area of Value.
Exits:
- Stop Loss level @ 22.70 which is the top off our bounce + ATR Value.
- Take Profit @ 18.25 which respects the Fib. Extension @ 18.16, and Support level @ 17.25
Max R:R = 2.18
SOLUSD Sell Limit ordersHi everyone.
I've set 3 orders to go short on Solana.
Please consider That if the second order triggered, Risk free the first order and If the third order triggered so you need to risk free the second order too...
These TP levels are based on Fib Levels. But if you want you can set the first TPs at 1:1RR for each order.
Let's see what happen.
Good luck everyone.

Gold Price Setup – Potential Rejection & Long ScenariosPrice is currently consolidating below the H4 Supply Zone after rejecting the ascending trendline twice.
Two key scenarios are in focus:
✅ Scenario 1 – Deeper Pullback to Demand Zone
A retracement into the 1H + 30M Order Block (OB) and liquidity zone near 3,341–3,355 (marked with $$$) could attract buyers.
If bullish momentum confirms, look for a continuation toward 3,388 and possibly the upper trendline near 3,400+.
✅ Scenario 2 – Immediate Push Higher
If price holds above the moving average and fails to break below 3,355, bulls could step in earlier, driving price back to test the trendline resistance.
Breakout of the trendline could target the higher supply region.
🔍 Key Levels to Watch:
H4 Supply Zone (3,440 area) for potential reversal.
3,341 OB Zone for liquidity sweep and reaction.
Trendline Resistance capping the upside.

BTCUSD manages to hold the lower border of the – Rebound LikelyBTCUSD manages to hold the lower border of the descending channel, ready to rebound.
BTCUSD broke below 116,000.00 support level on August 1 and declined towards 112,000.00 support level. Afterwards, the asset successfully rebounded from it. Although, we noticed 2 false breakouts of the channel, in general the asset tries hold itself within the descending channel, still showing us the strength of this formation.
Here, the rebound towards 118,000.00 level is expected with intermediate consolidation slightly above the 116,000.00. In the long term, the asset still moves within the descending channel, so no new long-term bullish momentum is expected.

GOLD RISING AGAIN1. MA20 on weekly held the price again
2. Gold is making Higher Lows in a row
3. 100 days of sideway movement
Now its time for $4000 in my opinion

US30 – Bullish Break Above 44,300.00After bouncing off 43,450.00, US30 surged past 44,120.00 and is now holding above the key 44,300.00 resistance-turned-support level.
Support at: 44,300.00 🔽 | 44,120.00 | 43,770.20
Resistance at: 44,700.00 🔼 | 44,922.00 | 45,136.10
🔎 Bias:
🔼 Bullish: Holding above 44,300.00 could fuel a rally toward 44,700.00 and beyond.
🔽 Bearish: A drop back below 44,300.00 may expose 44,120.00 and 43,770.20.
📛 Disclaimer: This is not financial advice. Trade at your own risk.

ETHUSD holds 3,550.00 support level and continues to grow.ETHUSD holds 3,550.00 support level and continues to grow.
Since August 1 the asset has been trading below the support level of 3,550.00. On Monday the asset broke through this level from below, establishing the false breakout of this level. A false breakout is when an asset’s price pops past a major support or resistance line but then flips back fast, not sticking with the move. It tricks traders into thinking a big trend’s kicking off, only to burn them when the price slides back to where it was.
On August 6 ETHUSD has successfully rebounded from the 3,550.00 support level and is currently developing short-term bullish momentum. The price is expected to grow towards 3,800.00 and 4,000.00 as a final target.

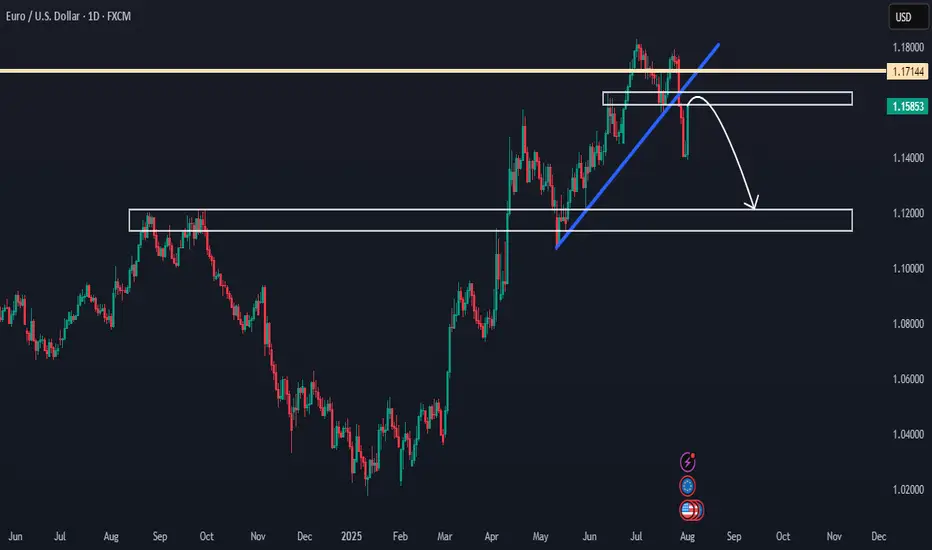
EURUSD Showing Reversal Signs After 7-Month Bullish TrendHello everybody!
After holding bullish momentum for a long time (7 months), EURUSD is starting to show signs of reversal:
1. It has been rejected from a strong resistance area.
2. It broke a support area, which is now expected to act as resistance.
3. It broke a solid upward trendline with a strong downward move.
If this area holds and price doesn't go above 1.18000, we can look to sell from here.
In that case, the most likely target will be around 1.12000.
Manage your risk and trade safe!
XAUUSD 30M – Breakdown or Bounce From Here?Gold remains trapped within a narrow intraday range as price tests key support at $3,370.71. After failed attempts to reclaim the d1 open zone around $3,380, momentum has shifted lower with sellers pressing at support.
The next move remains critical:
→ $3,385.01 remains the key upside trigger; a confirmed 30m close above could attract buyers, targeting $3,389.09
→ A decisive close below $3,370.71 would break short term structure and expose $3,367.16 (first target) and potentially $3,363.88 on continuation
→ The current structure favors range trading but compression near the lows suggests possible downside expansion
Price action remains delicate. Traders should remain patient for a clear breakout or breakdown confirmation before positioning.
#XAUUSD #Gold #TechnicalLevels #PriceAction #BreakoutWatch #SupportResistance #MarketStructure
