SHORT ON US30US30 Has given us a nice CHOC (Change of Character) to the downside.
This indicates a huge potential of US30 dropping more after it pulls back into the supply zone that created the change.
Dollar news is also a catalyst today for this play. If news comes out good for PMI and makes the dollar rise... US30 could fall almost 3000 points over the next few days.
Take Advantage.
Support and Resistance

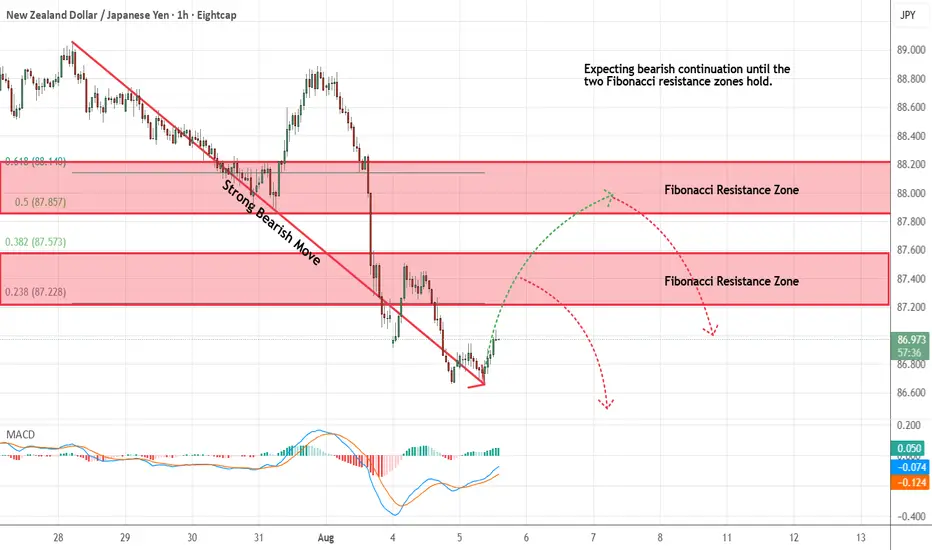
NZDJPY - Looking To Sell Pullbacks In The Short TermH1 - Strong bearish move.
No opposite signs.
Currently it looks like a pullback is happening.
Expecting bearish continuation until the two Fibonacci resistance zones hold.
If you enjoy this idea, don’t forget to LIKE 👍, FOLLOW ✅, SHARE 🙌, and COMMENT ✍! Drop your thoughts and charts below to keep the discussion going. Your support helps keep this content free and reach more people! 🚀
--------------------------------------------------------------------------------------------------------------------
Nifty 50 Present ViewsI am trying to publish my opinion about the BMI which is Nifty 50 based on my current understanding and knowledge of markets.
Assumptions are as follows:
Present running QTR is Jul 25 to Sep 25 and year on year comparison of Jul 24 to Sep 24. And the challange was by Apr 25 to Jun 25.
Considering present available data I have tried to highlight best possible scenarios.
Personal Views: Still expecting a consolidaton

How to seize the best entry point for gold?Gold continued its bullish trend from last Friday, rising to a high of 3385 yesterday. However, the upward momentum failed to sustain, and new highs were not reached during today's Asian and European trading sessions. The short-term bullish trend has ended, and the market is showing signs of correction. Currently, gold is facing downward pressure in the short term, and the short-term trend is volatile. Strategically, we can watch for a rebound to the 3375-3385 area during the European trading session and try to participate in short-term short selling. The target is below 3365-3355. The long-term structure remains bullish. Therefore, if the price falls back to the 3355-3340 area and stabilizes, we can still consider entering long positions to continue the medium-term uptrend. In terms of trading, we should pay attention to the rhythm of the market, betting on rebound resistance with short-term short positions and then going long on dips, maintaining flexibility.

XAUUSD PRICE RISKS FALLING!!! -Chart Talks!Xauusd stands a good chance to drop as we begin to see a reaction around 3386.02 if we’d get a break below the price level of 3354.30 Upon price break/Retest to that level, A sell opportunity is Envisaged. Our target profit is at 3323.26 (key level )

JP Morgan warns the S&P is due a retracement!🚨 Alert 🚨
JP Morgan and Deutsche Bank are the latest to warn that the S&P is due for a correction.
I'm short with a small position size, as the price could move higher yet... Judging by experience, it's near impossible to predict tops. It's best to close long positions or enter smaller-sized short positions with large stops.
VANTAGE:SP500 PEPPERSTONE:US500 ICMARKETS:US500 OANDA:SPX500USD

ProShares Short FTSE Quote | Chart & Forecast SummaryKey Indicators On Trade Set Up In General
1. Push Set Up
2. Range Set Up
3. Break & Retest Set Up
Notes On Session
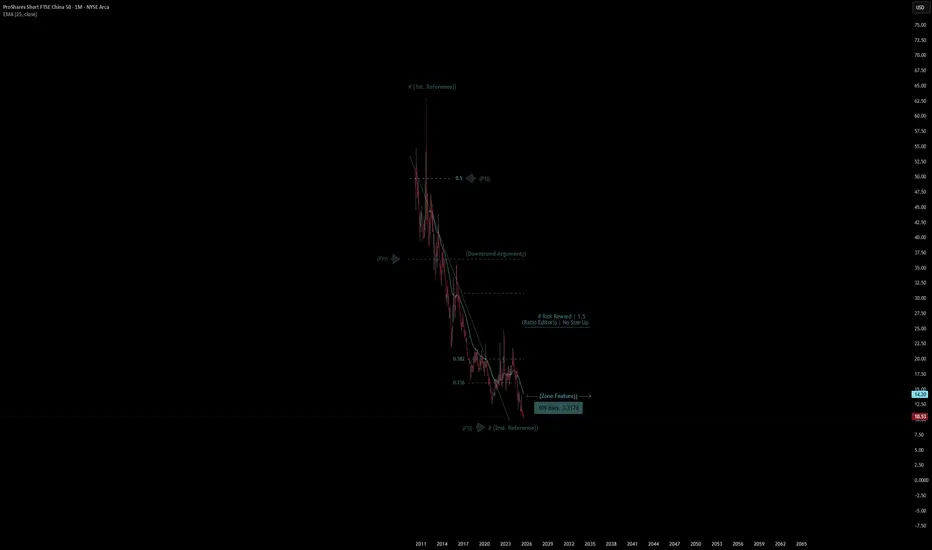
# ProShares Short FTSE - Quote
- Double Formation
* (Downtrend Argument)) At 35.00 USD | Subdivision 1
* # Risk Reward | 1.5 - *(Ratio Editor)) | No Size Up | Completed Survey
* 98 bars, 2.980d | Date Range Method - *(Uptrend Argument))
- Triple Formation
* (P1)) / (P2)) & (P3)) | Subdivision 2
* Weekly Time Frame | Trend Settings Condition | Subdivision 3
- (Hypothesis On Entry Bias)) | Regular Settings
* Stop Loss Feature Varies Regarding To Main Entry And Can Occur Unevenly
- Position On A 1.5RR
* Stop Loss At 28.00 USD
* Entry At 20.00 USD
* Take Profit At 7.00 USD
* (Downtrend Argument)) & No Pattern Confirmation
- Continuation Pattern | Not Valid
- Reversal Pattern | Not Valid
* Ongoing Entry & (Neutral Area))
Active Sessions On Relevant Range & Elemented Probabilities;
European-Session(Upwards) - East Coast-Session(Downwards) - Asian-Session(Ranging)
Conclusion | Trade Plan Execution & Risk Management On Demand;
Overall Consensus | Sell
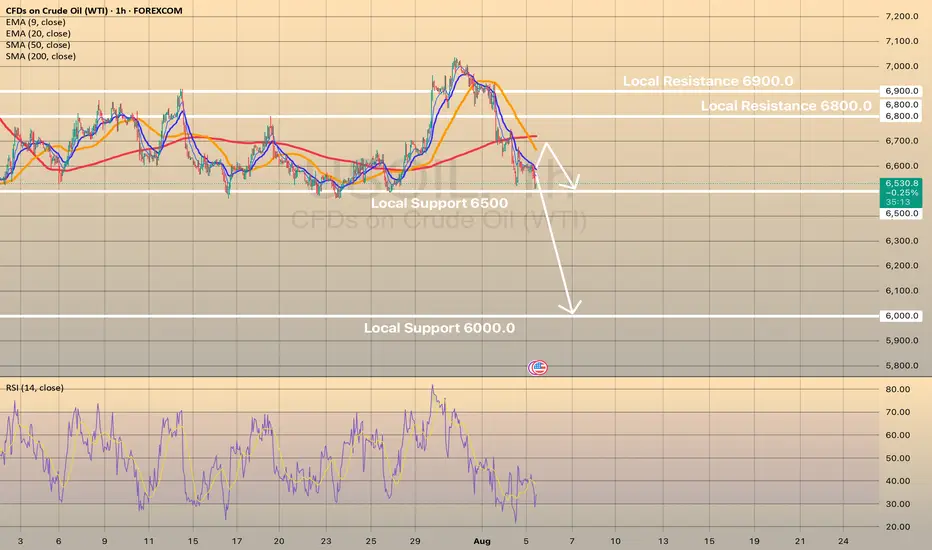
USOIL drops on rising supply and demand concernsUSOIL drops on rising supply and demand concerns
Oil prices fell Tuesday as OPEC+ planned a 547,000 bpd output increase for September, overshadowing potential Russian oil supply constraints from U.S. policies. Brent and WTI crude dropped to their lowest in a week, marking a fourth consecutive decline. OPEC+’s reversal of 2.5 million bpd cuts, combined with weak demand outlooks due to U.S. recession risks and China’s lack of new stimulus, pressured prices. Trump’s threatened 100% tariffs on Russian crude buyers like India, which imports 1.75 million bpd, heightened trade tensions but failed to lift oil prices. Analysts warn U.S. tariffs could further weaken global growth and fuel demand.
USOIL shows some in-moment strength on RSI on 1-h chart, the price may rebound towards sma200 at 6,700.00. However, in long-term perspective, low oil price is expected. Eventually, the price may decline towards level of 6,000.00.
BUY USDCHF 5.8.2025Confluence order: BUY at M15
Type of order: Limit order
Reason:
- The current top is not touching anything, expected to rise to the sub-key of H1 above.
- M15~FIBO 0,5-0,618 (same position)
Note:
- Management of money carefully at the last bottom (0,81005)
Set up entry:
- Entry buy at 0,80878
- SL at 0,80802
- TP1: 0,81005 (~1,5R)
- TP2: 0,81123 (~3R)
- TP3: 0,81299 (~5R)
Trading Method: Price action (No indicator, only trend and candles)

SPX500 Technical Setup – Eyes on 6365 and 6399 TargetsSPX500 – Overview
The price has stabilized above the key pivot level at 6341, maintaining a bullish bias. As long as the price holds above this level, the upward momentum is expected to continue toward 6365 and potentially 6389 or 6399.
However, a 1H close below 6323 would signal a possible trend reversal, opening the door for a deeper correction toward 6283.
🔹 Pivot: 6341
🔹 Resistance: 6365, 6399, 6427
🔹 Support: 6323, 6283

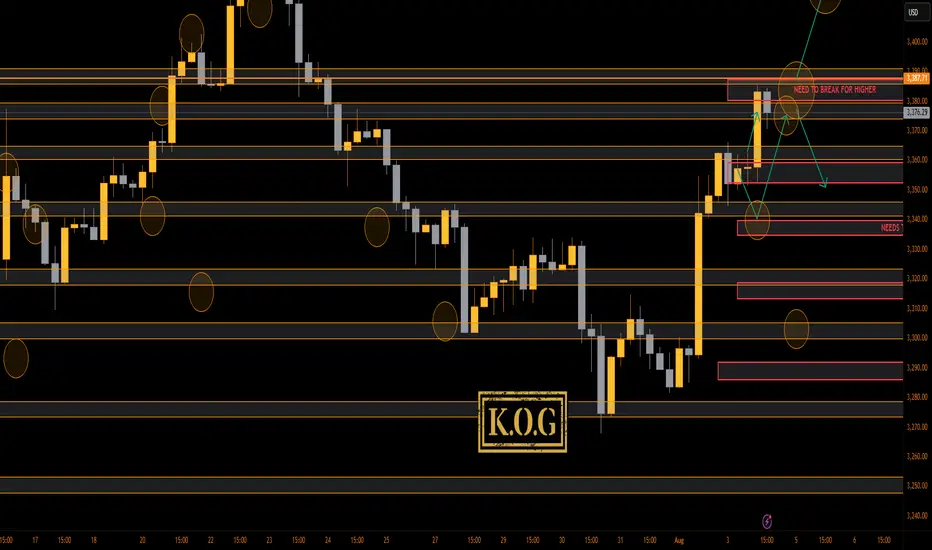
THE KOG REPORT - UpdateEnd of day update from us here at KOG:
Not a bad day at all on the markets with gold holding the 3345-50 support level and giving the push upside as we wanted. We managed to complete our Excalibur targets and hit the ideal target level which was share in the NFP KOG report to complete the move.
Now, we need to play a little caution here as we have bounced the red box box as anticipated and a small RIP is in progress. Support stands at the 3364 level with resistance above 3377. We'll expect there to be a hunt above so lets make sure to protect and manage.
KOG’s bias for the week:
Bullish above 3340 with targets above 3370✅, 3373✅, 3379✅ and above that 3384✅
Bearish on break of 3340 with targets below 3330, 3320 and below that 3310
RED BOXES:
Break above 3365 for 3372✅, 3375✅, 3379✅, 3384✅ and 3390 in extension of the move
Break below 3350 for 3346, 3340, 3335 and 3330 in extension of the move
As always, trade safe.
KOG
CADJPY: Bullish Move Confirmed?! 🇨🇦🇯🇵
CADJPY is going to bounce from a key daily support.
With a high probability, 107.28 level will be reached soon.
❤️Please, support my work with like, thank you!❤️

Go long on the pullback and head straight to new highs!Gold fell back and stabilized at 3345 yesterday, and continued to rise during the US trading session, reaching a high of 3385. The overnight daily line closed positive again, which is in line with our expectations, so there is still room for growth. We will continue to take a bullish approach today. In the 4H cycle, the Bollinger opening is in the stage of large volume, and the consecutive positive lines are rising steadily based on the moving average. The support below is 3370-3360, and the intraday watershed is at 3360. The operation is mainly to go long on pullbacks. First look at the pressure of the 3385 high point. If it breaks, continue to look at 3395 and 3410.
Gold operation suggestion: go long on gold around 3370-3360, and look at 3385 and 3400.

US30 Holding Above Key Pivot – More Upside Ahead?US30 – Overview
The price has stabilized within the bullish zone after holding above the key pivot level at 44170, indicating continued upside momentum. As long as the price remains above this level, we expect a move toward the next resistance at 44360, with potential for an extension toward 44610. A confirmed breakout above 44610 on the 1H timeframe could open the path toward the next resistance at 44730.
However, a 1H close below 44170 may trigger a short-term correction toward 43960.
A break below 43960 would shift the bias to bearish, with further downside likely toward 43785 and potentially 43630.
Resistance: 44360, 44610, 44730
Support: 43960, 43785, 43630

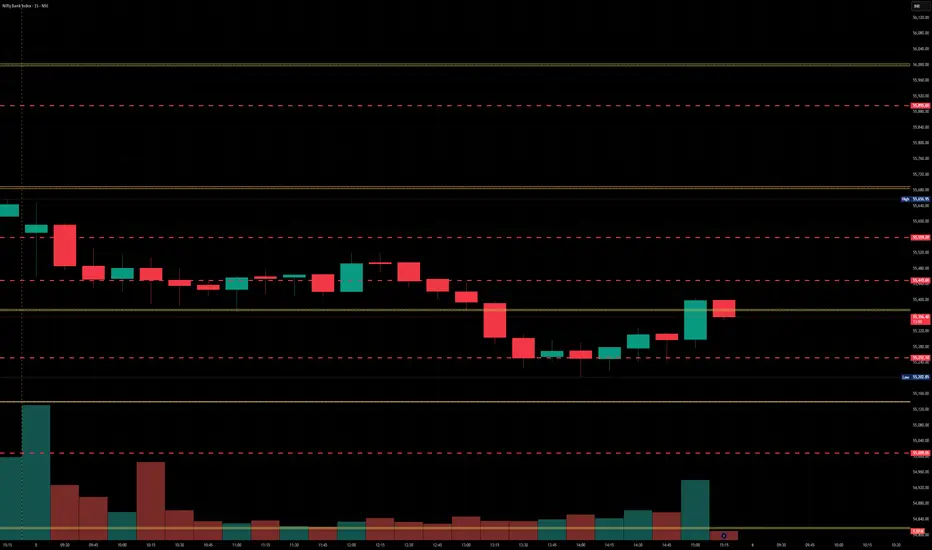
BankNifty levels - Aug 06, 2025Utilizing the support and resistance levels of BankNifty, along with the 5-minute timeframe candlesticks and VWAP, can enhance the precision of trade entries and exits on or near these levels. It is crucial to recognize that these levels are not static, and they undergo alterations as market dynamics evolve.
The dashed lines on the chart indicate the reaction levels, serving as additional points of significance. Furthermore, take note of the response at the levels of the High, Low, and Close values from the day prior.
We trust that this information proves valuable to you.
* If you found the idea appealing, kindly tap the Boost icon located below the chart. We encourage you to share your thoughts and comments regarding it.
Wishing you successful trading endeavors!
Nifty levels - Aug 06, 2025Nifty support and resistance levels are valuable tools for making informed trading decisions, specifically when combined with the analysis of 5-minute timeframe candlesticks and VWAP. By closely monitoring these levels and observing the price movements within this timeframe, traders can enhance the accuracy of their entry and exit points. It is important to bear in mind that support and resistance levels are not fixed, and they can change over time as market conditions evolve.
The dashed lines on the chart indicate the reaction levels, serving as additional points of significance to consider. Furthermore, take note of the response at the levels of the High, Low, and Close values from the day prior.
We hope you find this information beneficial in your trading endeavors.
* If you found the idea appealing, kindly tap the Boost icon located below the chart. We encourage you to share your thoughts and comments regarding it.
Wishing you success in your trading activities!

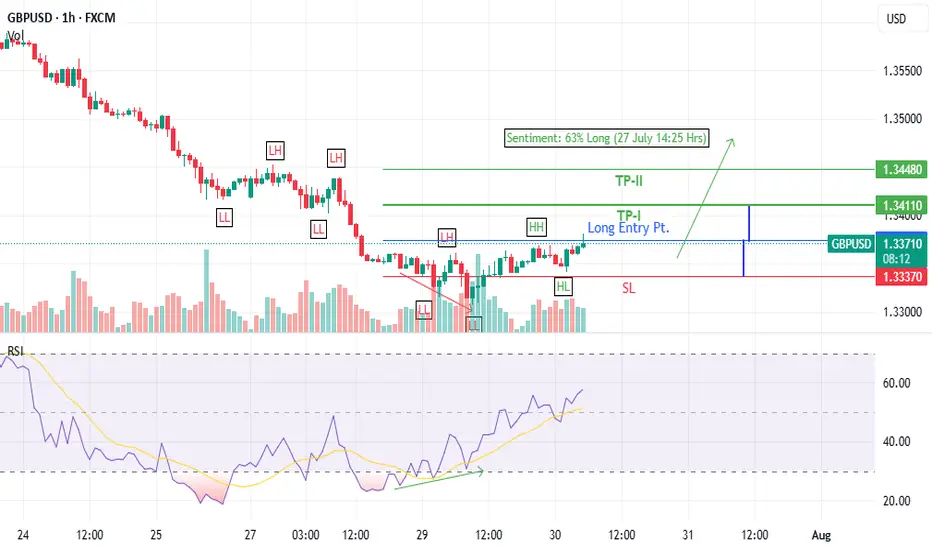
GBPUSD Long trade idea (30 July 2025)- Bullish Divergence on 1-H time frame
- Last LH broken at 1.3361
- Entered at CMP (1.33736)
USDJPY Showing Bullish Correction USDJPY is currently testing a key support level, with the US dollar showing recovery since the beginning of the session. This bullish momentum is giving the pair a chance to climb higher.
Technical Overview:
The price is approaching the local support zone near 147.50. Bullish momentum is building from this level. If the price holds above 147.50, it could trigger further upside movement Upside Targets will be 148.50 and also 150.20
You May find more details in the chart,
Trade wisely Best of Luck Buddies.
Ps; Support with like and comments for better analysis Thanks Traders.

Time For Pullback📉 Technical Breakdown:
1. Resistance Zone (Supply Zone) — 1.15700 to 1.15950
> Price was previously rejected strongly from this area, confirming it as a strong supply/resistance zone.
> Multiple rejections from this level indicate the presence of strong sellers.
2. Current Price Action:
> After retesting the resistance area, price is now dropping with momentum, forming strong bearish candles.
> The blue arrows show an expected continuation downward.
3. Retrace Target Area (Short-term Target) — 1.14685 to 1.14593
> This zone is likely the next support level or liquidity pool, where price might temporarily stall or bounce.
>It could be a profit-taking zone for intraday/swing sellers.
4. Previous Low / Major Support Zone — Around 1.14000 to 1.13917
> This purple box marks the previous significant low, which is a key bearish target.
> A break below this level would confirm a strong bearish trend continuation on a higher timeframe.
🧠 Trade Idea:
✅ Sell Setup in Play
Entry: Already in motion after rejection from the 1.15700–1.15950 zone
# TP1: 1.14685 (retracement target zone)
# TP2: 1.14000 area (previous low)
# SL Idea: Above 1.1600 (above resistance wick for safe margin)
✅ Conclusion:
> This chart shows a clear bearish market structure with room for downside.
> Expect continuation to 1.1468, then possibly to 1.1400, unless buyers step in around the retrace zone.
> Solid opportunity for trend-following short trades.

EURUSD Technical and Fundamental AnalysisEURUSD may begin another downtrend movement from the current zone, as suggested in our earlier chart analysis. The price is expected to retest the support line after a short-term bounce, likely influenced by speculation around the NFP report.
Fundamental Outlook:
Adding to the market’s uncertainty, former President Donald Trump has dismissed Erika McEntarffer, Commissioner of the Bureau of Labour Statistics, accusing her of manipulating job data. This political drama has raised fresh concerns among investors about transparency and credibility in U.S. economic reports.
Moreover, investors are increasingly worried about the broader impact of Trump’s return to influence, which could potentially slow U.S. economic growth.
Technical Analysis:
From a technical perspective, EURUSD has broken below the neckline of a double top pattern, which is a strong bearish confirmation. This breakdown signals a continuation of the downtrend, with downside momentum likely to build if the pair remains below key resistance levels.
You May find more details in the chart.
Ps: Support with like and comments for better analysis Thanks for Supporting.

BUY XAUUSD 5.8.2025Confluence order: BUY at M15
Type of order: Limit order
Reason:
- The current top is not touching anything, expected to rise to the H1 above.
- M15~FIBO 0,5-0,618 (same position)
Note:
- Management of money carefully at the last bottom (3,370)
Set up entry:
- Entry buy at 3,364
- SL at 3,360
- TP1: 3,370 (~1R)
- TP2: 3,383 (~4R)
- TP3: 3,391 (~6R)
Trading Method: Price action (No indicator, only trend and candles)

DeGRAM | GOLD reached the resistance level📊 Technical Analysis
● XAUUSD rebounded from the lower channel boundary near 3,294 and reclaimed resistance at 3,357.8, confirming bullish continuation inside the rising structure.
● Breakout above the triangle’s descending resistance line opens upside toward 3,435 and possibly 3,487 on strong momentum continuation.
💡 Fundamental Analysis
● Gold found renewed support as US NFP and ISM data showed softness, weakening the dollar and lowering real yields.
● Rising geopolitical risk and increased central bank gold buying in July continue to support bullish sentiment.
✨ Summary
Long above 3,357. Target 3,435 ➜ 3,487. Setup holds while price stays above 3,294 channel base.
-------------------
Share your opinion in the comments and support the idea with a like. Thanks for your support!

DeGRAM | ADAUSD held the $0.7 level📊 Technical Analysis
● ADAUSD is respecting the newly established rising support line after bouncing from the 0.695 level, confirming higher lows within a bullish channel.
● The price is now breaking out of a falling flag structure and is on course to retest the confluence resistance near 0.88 and the descending purple trendline.
💡 Fundamental Analysis
● Cardano’s DeFi metrics remain strong, with TVL surpassing $400M—its highest since early 2022—boosted by staking and stablecoin growth.
● Optimism surrounding the Chang hard-fork and renewed institutional interest is helping reinforce mid-term buying pressure.
✨ Summary
Buy above 0.695. Target 0.86 → 0.88. Setup remains valid while price holds above 0.68 trend support.
-------------------
Share your opinion in the comments and support the idea with a like. Thanks for your support
