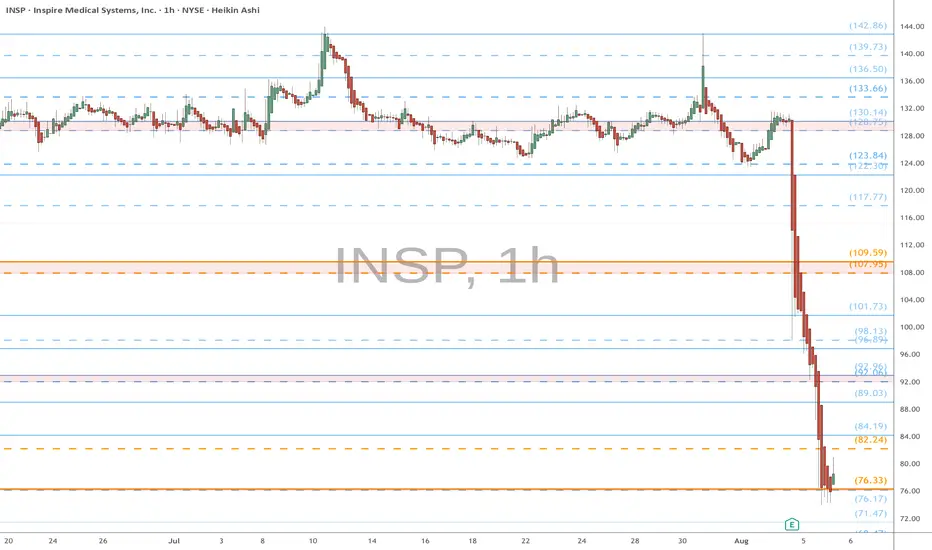
INSP eyes on $76: Double Fib needs to hold the earnings DUMPINSP earnings started a massive dump of 30%.
Free Fall came to abrubt stop at a Double Fib.
$76.17-76.33 is critical support for bulls to hold.
Support and Resistance
Hims new momentum zoneHims hit my new momentum zone perfectly on the dump. I had this drawn after the initial down leg, hoping the daily gap would fill to the downside. We see a nice hard stop at the buy zone, the stock could easily slide down to 47, but we are seeing strong action from buyers here. Now if only NVO would announce a lawsuit to get the party going.
My plan:
I am overexposed to hims and have a lot of shares in covered calls and I will likely follow the weekly chart but not play it unless we get a massive dump where I will buy LEAPs.

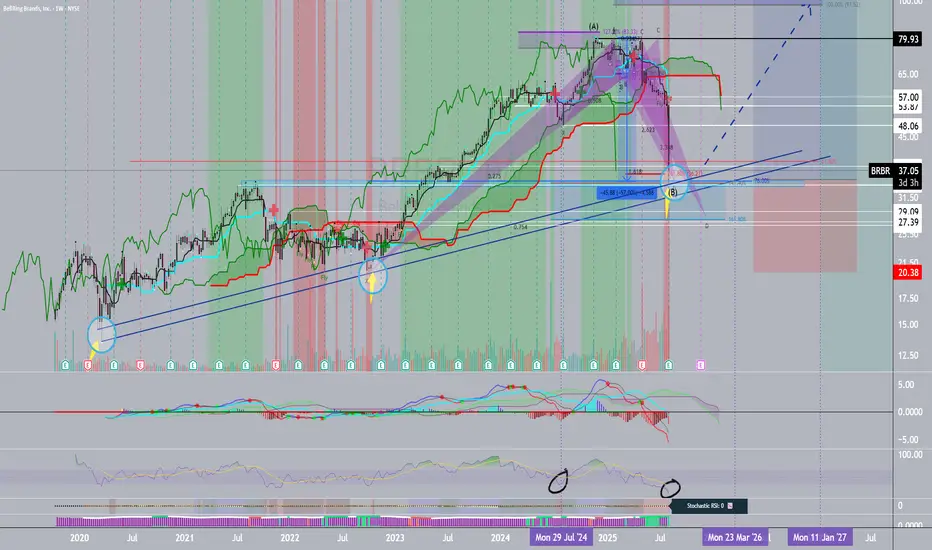
Bellring Brands Bounce from Huge Key Levels & Motived ManagementFundamentals:
In today's earning's call (August 5, 2025, the management was excited about the future outlook of the company. Their expected negativity from the start. The questions by the banks (JP Morgan and Morgan Stanley and others) were answered thoroughly and professionally...and positively.
Technicals:
I discuss the quick fundamentals and technicals of this stock in this video here:
Monthly:
hidden bullish divergence
2021 horizontal key level of support
Weekly:
diagonal and horizontal level of support
with indicators:
30-Minute Chart:
HAMMER TIME!
Morning Star!
Volume confirmation!
Gold is in the bullish direction after correcting the supportHello Traders
In This Chart GOLD HOURLY Forex Forecast By FOREX PLANET
today Gold analysis 👆
🟢This Chart includes_ (GOLD market update)
🟢What is The Next Opportunity on GOLD Market
🟢how to Enter to the Valid Entry With Assurance Profit
This CHART is For Trader's that Want to Improve Their Technical Analysis Skills and Their Trading By Understanding How To Analyze The Market Using Multiple Timeframes and Understanding The Bigger Picture on the Charts
Bumble | BMBL | Long at $8.34Arguably, Bumble NASDAQ:BMBL , Match NASDAQ:MTCH , and Grindr NYSE:GRND have an enormous amount of *highly* valuable data on its past and current users. Like any industry, it often simply takes time for this recognition by market makers to occur before price aligns with the "true" future value. If you are an AGI company looking to enhance user companionship with machines and AI bots, these companies hold the keys.
NASDAQ:BMBL has low debt, paying users are still growing (caution if recession begins), and revenue is rising. Personally, the value is in the company's data.
From a technical analysis perspective, my historical simple moving average lines are working their way toward the price. Often, this means a rise in price as the lines flatten and then inevitably rise with the trend reversal. However, I would not be surprised if there were some shakeouts in the near-term if the price suddenly dropped near $5 post-earnings, etc. Regardless, it will personally likely be an opportunity to gather more shares. Thus, at $8.34, NASDAQ:BMBL is in a personal buy-zone.
Target #1 = $12.00
Target #2 = $15.00
Target #3 = $22.00

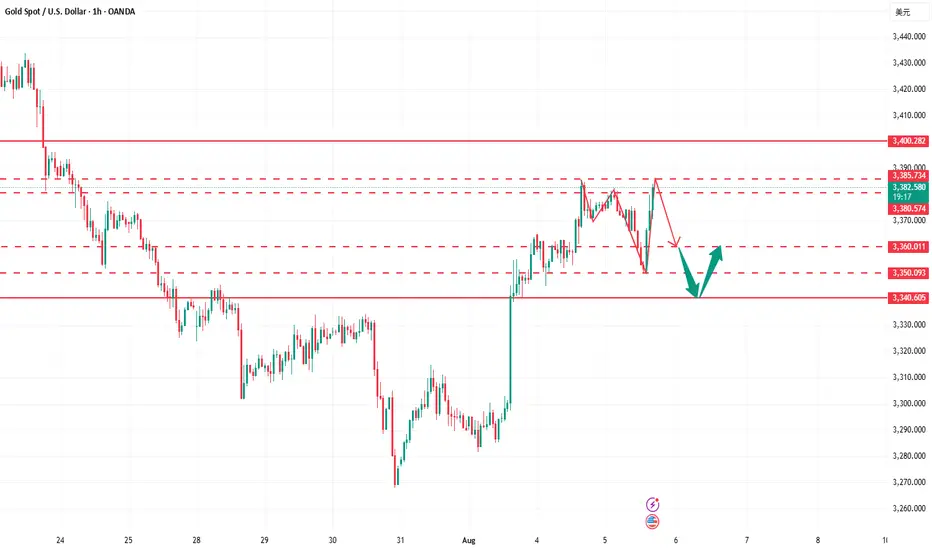
XAUUSD Continuation fallowing PullbackGold is currently retesting the support zone and showing signs of potential upside movement. The market is reacting to expectations of Fed policy easing, which is supporting gold prices. Upcoming ISM PMI data is a key catalyst — stronger-than-expected figures could cause volatility.
Gold declined from the 3374 level, showing a false breakout to the downside.
Key support is forming around 3360 — if broken, a bearish trend may resume at 3342nIf the 1H candle closes above 3370, this could indicate renewed bullish momentum.
Resistance to watch: 3400 and 3420.
You May find more details in the chart.
Ps; Support with like and comments for better analysis.

$GAS is showing strong long-term accumulation — a major move migHOSE:GAS is showing strong long-term accumulation — a major move might be loading.

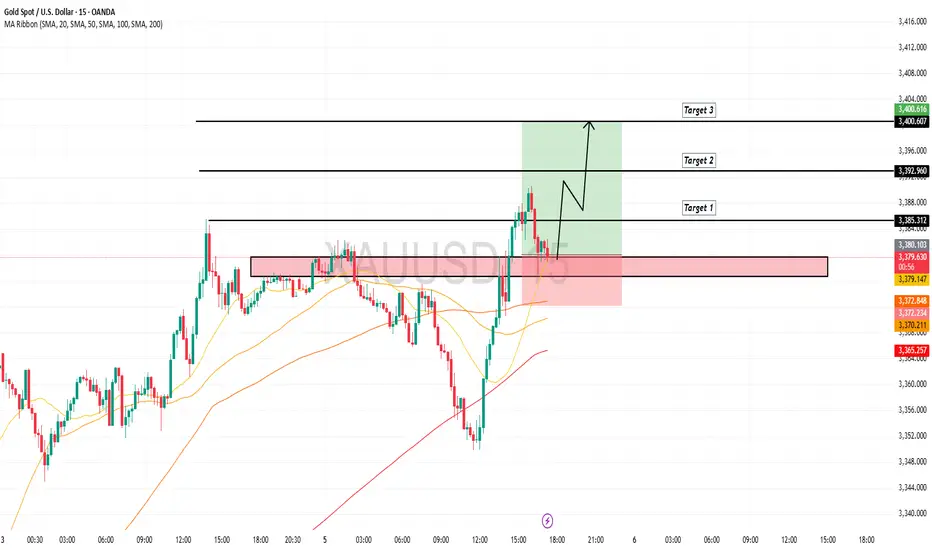
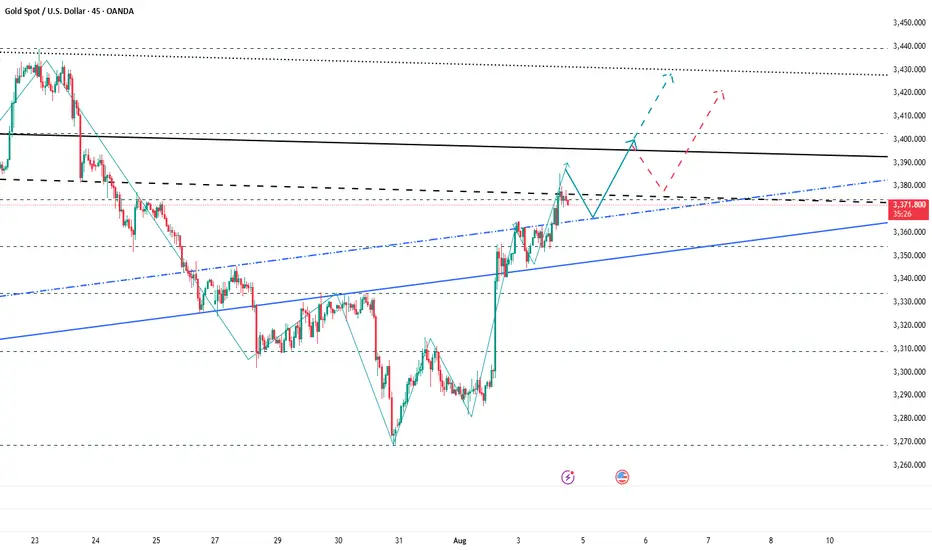
EW - Watching (b) Pullback for Next Bull WaveGame plan:
Watching for the (b) wave pullback. Key support is around 3,362–3,340.
If price corrects into this zone and shows bullish signs (wick rejection, strong bounce), I’ll look for a long setup.
Target: Initial target back to the 3,389–3,393 resistance area. If momentum is strong, will let some ride towards 3,421 +.
Stop loss: Just below the support zone (e.g. under 3,340 or the most recent swing low).
If price drops much further, I’ll be eyeing 3,298 as the next potential buy zone.
Key rule: If price breaks below 3,281 (Wave ii), I’m out. Not holding any longs if this support fails.

Gold breaks through 3400 and is about to challenge a new high
💡Message Strategy
Fundamental Analysis: The Macro Environment and Policy Expectations Are Intertwined
From a fundamental perspective, the recent trend in gold prices is driven by multiple factors. First, rising expectations for a September Federal Reserve rate cut have become a key factor supporting gold prices. Last Friday's US non-farm payroll data, which fell short of expectations and saw a significant downward revision from the previous reading, fueled market concerns about an economic slowdown and pushed US Treasury yields lower.
The increased expectations for a rate cut have reduced the upside potential for the US dollar and US Treasury yields, indirectly providing support for gold.
In terms of market sentiment, a rebound in global stock markets has weakened gold's safe-haven demand. The MSCI World Index snapped a six-day losing streak, with the Asia-Pacific Index rising 0.6%. Japan's Nikkei 225 rose 280 points on Tuesday. Europe's STOXX 50 and STOXX 600 indices both rose approximately 0.4%. The UK's FTSE 100 approached its all-time high of 9,150 points. The three major US stock indices performed particularly strongly on Monday, with the S&P 500 rising 1.5%, the Dow Jones Industrial Average soaring 585 points, and the Nasdaq Composite Index rising 1.9%.
The recovery of risk appetite has made investors more inclined to chase high-yield assets, and the attractiveness of gold has temporarily declined.
📊Technical aspects
Technically, gold is likely to continue trading in a narrow range between its 50-day and 100-day moving averages. Key support levels at $3,350 and resistance at $3,385 will be the focus of near-term bull-bear trading. A breakout from fundamental data or news could signal a clearer trend for gold prices.
In the long term, slowing global economic growth, central bank gold purchasing, and persistent geopolitical risks will continue to provide structural support for gold.
If the bulls can regain their footing on the bottom of the ascending triangle pattern and break through the resistance level of $3,380, gold prices are expected to further challenge $3,440 and even retest the historical high.
💰Strategy Package
Long Position:3370-3375,SL:3350,Target: 3400-3420
What does it matter if every step is just right?Today's gold fluctuation rhythm is basically consistent with our prediction. The rhythm from entry to profit-taking is clear, and the strategy is executed decisively. First, we decisively arranged long orders at the 3365-3370 line, and successfully took profit at the target line 3375, earning 150pips of profit. Then we decisively reversed and arranged short orders at 3375. The market fell back to around 3360 as expected, and realized 150pips of profit again. In the third round of operations, long orders were entered again near 3352, and the price rose smoothly to 3370 to take profit again. The overall rhythm was tight and profits were steadily pocketed. At present, gold has rebounded to around 3380-3385. We have deployed a new round of short orders in advance and will wait for the price to drop before arranging long orders. Overall, gold is in a volatile rhythm. Even if there is still room for upward movement in the future, it is likely to undergo a round of technical retracement adjustments first.
Hedera (HBAR) – Pullback Opportunity After 100% RallyHBAR has surged 100% recently. With the broader market entering contraction, we’re now watching for a healthy retracement into key support, aligning with the 50% Fibonacci level and a fair value gap (FVG). This could be the formation of a higher low before continuation.
🔍 Setup Overview:
Entry Zone: $0.22 – $0.19
Take Profits: $0.26 / $0.32 / $0.37
Stop Loss: Daily close below $0.18
Bias: Bullish continuation from support
🧠 Trade Idea:
Price is approaching a confluence zone of Fib support and unfilled imbalance. As long as daily structure holds above $0.18, the bullish case remains intact. This zone offers an attractive long setup for the next move higher, targeting previous resistance levels.
⚠️ Invalidation:
A daily close under $0.18 would break structure and invalidate the setup. Monitor price action and volume confirmation around this support zone for entry timing.

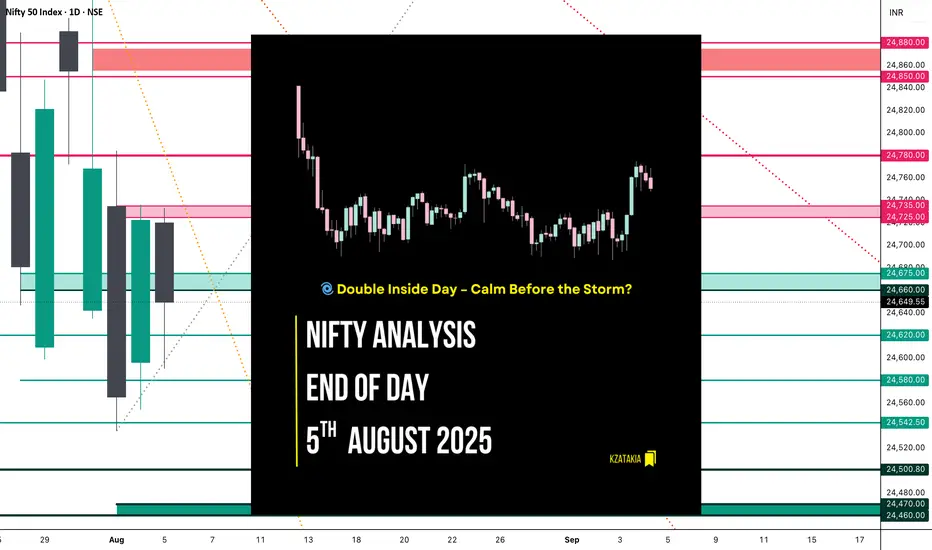
Nifty Analysis EOD – August 5, 2025 – Tuesday 🟢 Nifty Analysis EOD – August 5, 2025 – Tuesday 🔴
🌀 Double Inside Day – Calm Before the Storm?
📊 Nifty Summary
In the wind of negative news, yet Nifty starts neutral at the resistance zone of 24,725 ~ 24,735 but was unable to hold there and fell 140 points within the first 45 minutes.
After this initial sell-off, Nifty found support around 24,590, which coincided with yesterday's Fib 0.786 level, R1, and Previous Week Low (PWL).
These levels were well-defended throughout the session. Near the end, the index recovered ~80 points and closed at 24,649.55, close to yesterday’s Fib 0.5.
Can we consider today's move a retracement or a pullback of yesterday's move?
Same as Monday, today’s action stayed inside the previous session’s range, forming an Inside Bar. Now it appears as a Double Inside Bar on the daily chart.
📉 5 Min Time Frame Chart with Intraday Levels
📉 Daily Time Frame Chart with Intraday Levels
🕯 Daily Candle Breakdown
Open: 24,720.25
High: 24,733.10
Low: 24,590.30
Close: 24,649.55
Change: −73.20 (−0.30%)
Candle Structure Breakdown:
🔴 Red Candle (Close < Open):
24,720.25 − 24,649.55 = 70.70 points
🔼 Upper Wick:
24,733.10 − 24,720.25 = 12.85 points
🔽 Lower Wick:
24,649.55 − 24,590.30 = 59.25 points
Interpretation:
After a flat open, the index tried to move higher but faced resistance near 24,730, then reversed.
Buying interest was seen near the 24,590 zone, but sellers remained in control.
It closed below the open with a decent lower wick, indicating some buying support but overall weakness.
Candle Type:
🕯 A pullback candle with a moderate real body and long lower wick – suggests buyers attempted to support the fall, but sellers dominated.
🛡 5 Min Intraday Chart
⚔️ Gladiator Strategy Update
ATR: 202.71
IB Range: 139.95 → 🟠 Medium
Market Structure: Balanced
Trade Summary:
❌ No entry triggered by system
📌 Support & Resistance Levels
🔼 Resistance Zones:
24,725 ~ 24,735
24,780 ~ 24,795
24,860 ~ 24,880
🔽 Support Zones:
24,675 ~ 24,660
24,620
24,542 ~ 24,535
24,500
24,470 ~ 24,460
🧠 Final Thoughts
Today's double inside bar structure signals contraction and indecision — markets are waiting for a decisive breakout.
“The tighter the coil, the bigger the breakout.”
Keep an eye on these tight ranges. Patience before power!
✏️ Disclaimer
This is just my personal viewpoint. Always consult your financial advisor before taking any action.
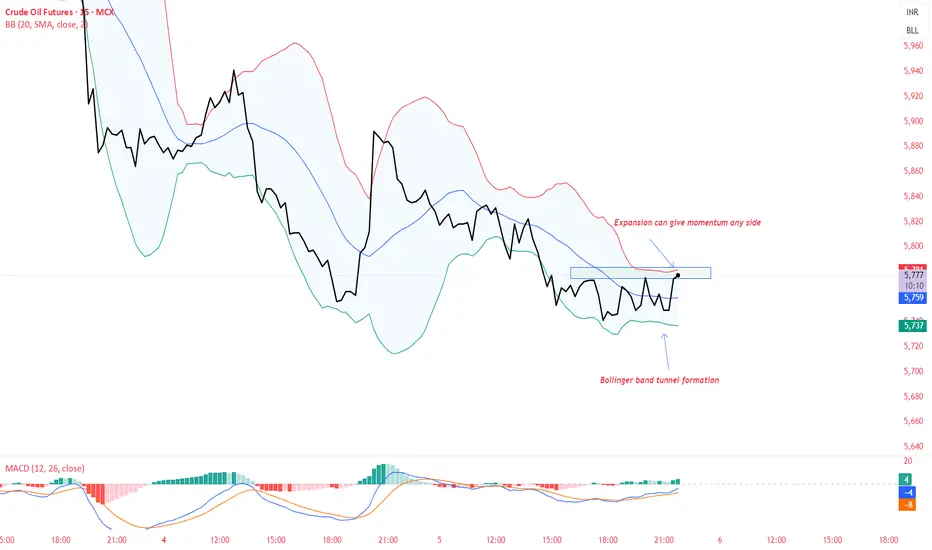
CRUDEOIL - BOLLINGER BAND TUNNEL FORMATIONCrudeoil seems bullish for 5900-5940-5980-6000
Dip till 5630 strong support
Do your own research before taking any trades
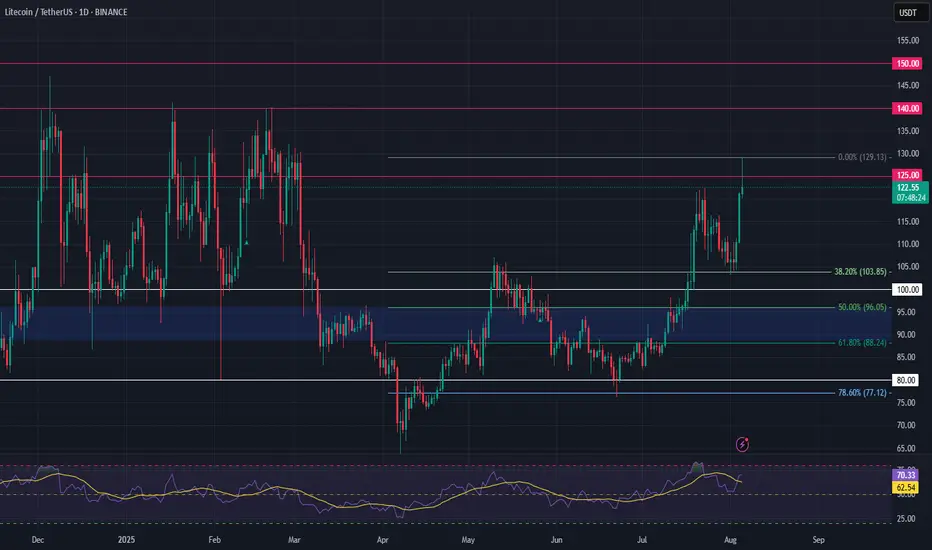
Litecoin (LTC) – Re-Entry After 44% RallyLTC rallied over 44% since our last trade setup. Now, we’re looking for a re-entry opportunity as the broader crypto market shows signs of a potential pullback.
🔍 Setup Overview:
Entry Zone: $108 – $103
Take Profits: $125 / $140 / $150
Stop Loss: Daily close below $100
Bias: Bullish continuation (as long as structure holds)
🧠 Trade Idea:
Expecting a possible sweep of the $104 low before upside resumes. Key condition: Daily candle must not close below $100—wicks are fine. If price respects this level, the bullish structure remains intact.
This is a classic liquidity grab scenario. Entering in the $108–103 zone allows favorable risk-to-reward if LTC catches support and reclaims momentum.
⚠️ Invalidation:
If LTC posts a daily close below $100, trade setup becomes invalid. Monitor price action closely around this key support zone.
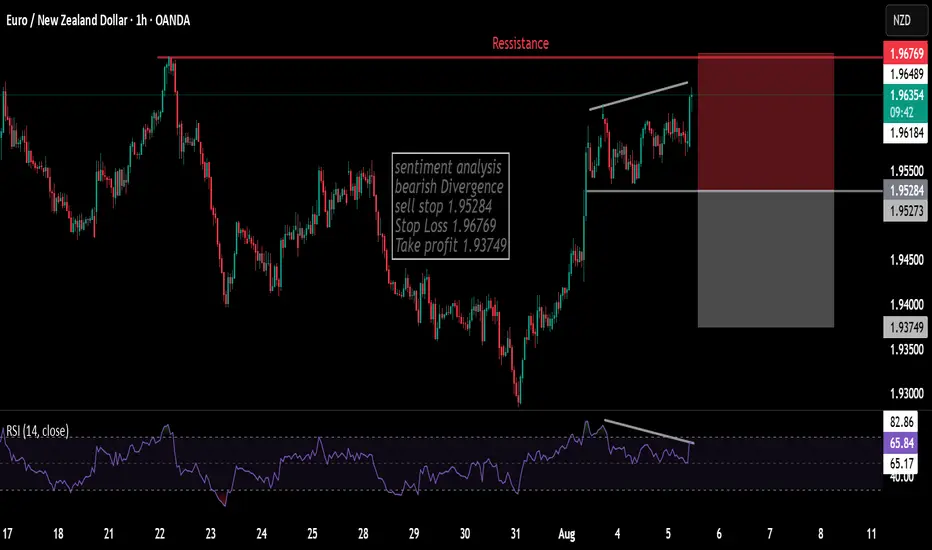
Eurnzdsentiment analysis ST #2
bearish Divergence
sell stop 1.95284
Stop Loss 1.96769
Take profit 1.93749
GBPNZD SHORT Market structure bearish at HTFs 3
Entry at both Weekly and Daily AOi
Weekly Rejection at AOi
Weekly Previous Structure Point
Daily Rejection At AOi
Daily EMA retest
Previous Structure point Daily
Around Psychological Level 2.25000
H4 Candlestick rejection
Levels 4.48
Entry 110% GVIBEZ
REMEMBER : Trading is a Game Of Probability
: Manage Your Risk
: Be Patient
: Every Moment Is Unique
: Rinse, Wash, Repeat!
: Christ is King.

TRADE UPDATE XAUUSD Hey everyone at the start of the week we was waiting to see if price would pullback to 3,250 zone to take buys after price missed our entry just a little bit of pips if you check out my last few posts but my projections for Gold is that price might be heading to 3434 zone and can’t see a pullback to our area of interest and if price get to the 3434 zone I will be waiting to see if sellers would jump in or I wait for a breakout so I will update you guys before the week ends or if am about to execute a trade….

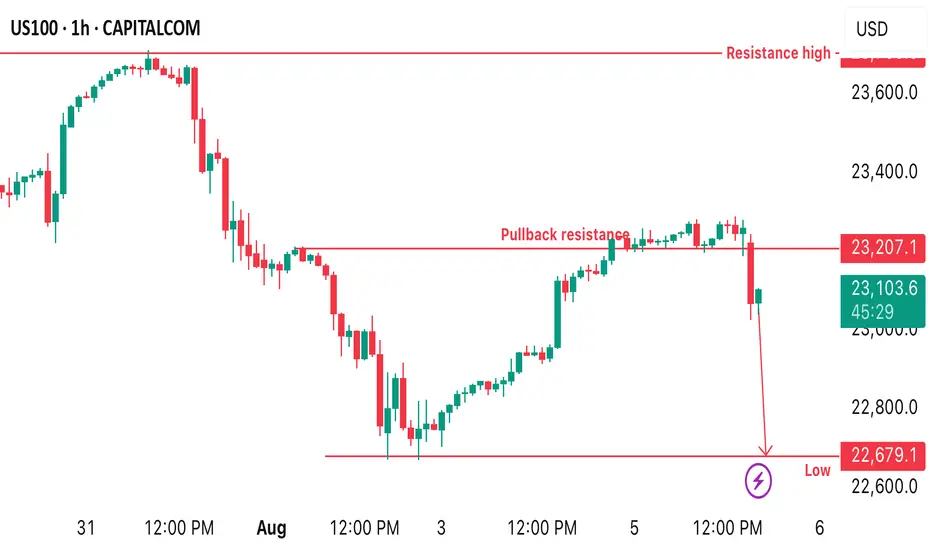
US100 reacts at pullback resistance US100 price reacts nicely at a pullback resistance with a strong rejection which supports the idea of selling from the current price. Therefore, a sell opportunity is envisaged from the current market price.
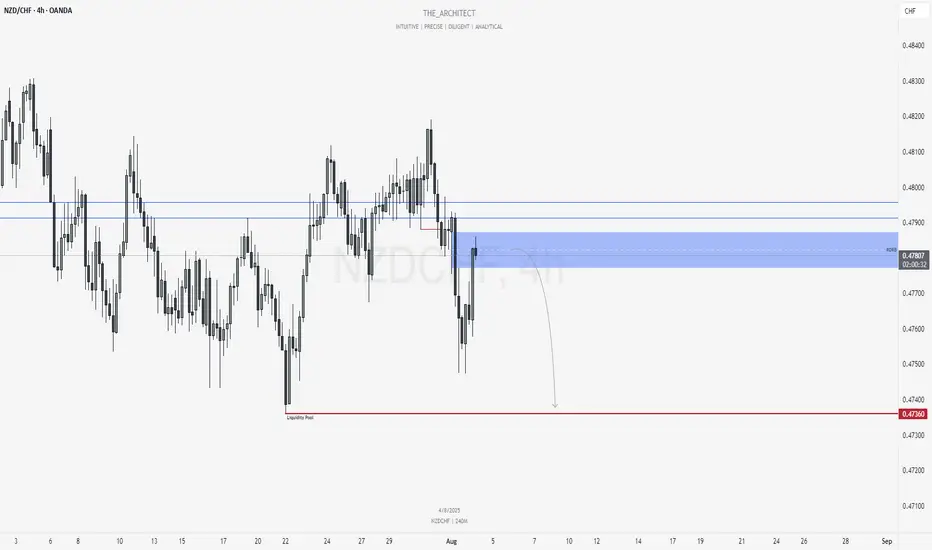
NZDCHF: Bearish Continuation from Re-Delivered Re-Balanced ArrayGreetings Traders,
In today’s analysis of NZDCHF, recent price action confirms the presence of bearish institutional order flow. As a result, we aim to align ourselves with this directional bias by identifying strategic selling opportunities.
Key Observations on H4:
Bearish Market Structure Shift: The H4 timeframe has recently confirmed a bearish shift in market structure, providing us with a clear framework to seek short setups in line with institutional momentum.
RDRB Resistance Zone: Price has retraced into a Re-Delivered Re-Balanced (RDRB) array—an area where prior institutional selling took place and has now been re-engaged. This region is expected to serve as resistance, offering a high-probability zone for confirmation entries to the downside.
Trading Plan:
Entry Strategy: Monitor lower timeframes (M15 and below) for bearish confirmation setups within the RDRB array.
Target Objective: The current draw on liquidity remains the liquidity pool residing at deeper discount levels, which aligns with our short bias.
For a detailed market walkthrough and in-depth execution zones, be sure to watch this week’s Forex Market Breakdown:
As always, stay disciplined, wait for clear confirmations, and manage your risk responsibly.
Kind regards,
The Architect 🏛️📉
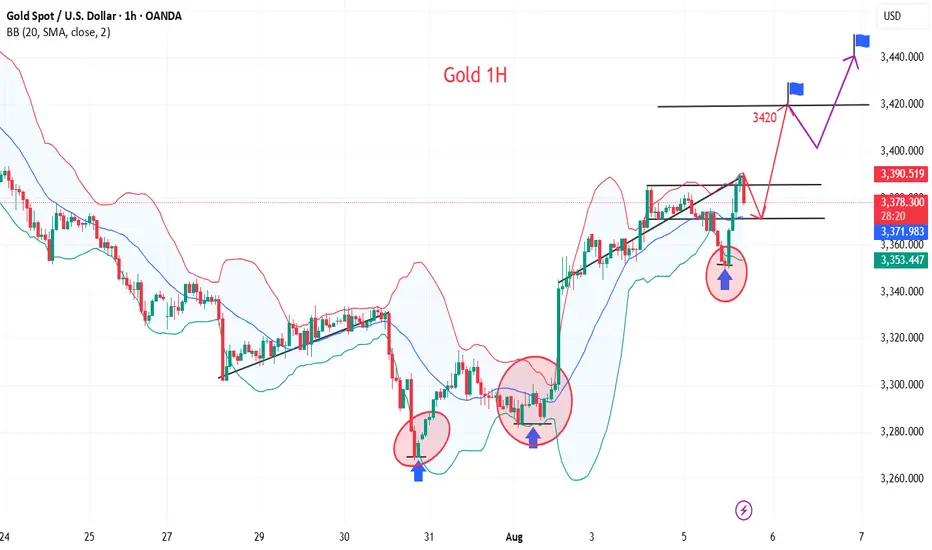
Next Stop 3420? Gold Bulls Push the LimitBecause the U.S. non-farm payroll report performed worse than expected, gold rebounded strongly last Friday and recovered half of its losses in one fell swoop. The bulls returned strongly. Today, after consolidating at a high level, gold continued to choose to break upward, reaching a high of around 3385.
There is no doubt that bullish forces still hold the upper hand. From a fundamental perspective, the Federal Reserve is currently facing greater pressure to cut interest rates; and it can also be clearly seen from the candlestick chart that a significant "W"-shaped double bottom structure has been constructed near 3268 and 3280, which has limited the gold's retracement space while also playing a key structural support role in the rise of gold. With the combined effects of news and technical factors, gold still has the potential to continue its upward trend. And I think there is still a great possibility that gold will test the 3400 mark again. Once gold stabilizes at 3400, it will definitely hit the 3420-3430 area.
As the center of gravity of gold gradually shifts upward, the lower support area also moves up. The current short-term support is obviously in the 3365-3355 area, while the relatively strong support is in the 3345-3335 area. According to the current pattern structure, the bulls may not allow gold to retreat to the 3345-3335 area. So in terms of short-term trading, we first consider the opportunity to enter long positions in the 3365-3355 area!
Agilon Health (Revised) | AGL | Long at $0.76This is a revised analysis of Agilon Health NYSE:AGL as seen here:
-------
Full disclosure: I am a holder of shares at $2.36, $0.76, and $0.79. Last entry planned near $0.50 if it reaches that level. Current cost average is near $1.11.
Let me be clear: This is a ***highly risky*** trade given the recent news regarding the CEO, securities fraud investigation, suspension of FY guidance. Do your own due diligence.
-------
The link above/previous writeup details some of the basic fundamentals of Agilon Health NYSE:AGL . As predicted, the price fell below $1 after the most recent earnings call. This was due to:
Revenue down 6% to $1.4B, Medicare Advantage membership at 498,000.
CEO Steve Sell resigning, Ron Williams appointed Executive Chairman.
2025 guidance suspended due to market challenges.
New securities fraud investigations.
I think the challenges NYSE:AGL is going through will extend through 2025 in into early 2026. If you look at the healthcare sector, it has taken a beating mostly due to Medicare and Medicaid cuts / rising healthcare costs. NYSE:AGL is not profitable and wasn't expected to become profitable until 2028 - but that may get revised....
However, the company focuses on senior patients, primarily through Medicare Advantage and ACO REACH programs, targeting value-based care for older adults across 31+ communities in 12 states. The need for services targeting the Baby Boom population is going to rapidly increase in the next few years. NYSE:AGL may become a leader in this area, but the company needs to regroup and focus on a model that returns money to investors - a dirty game. So, while the near-term is doom and gloom, the future could be very, very bright with NYSE:AGL if they are able to turn things around with this new leadership shakeup. Time will tell. It's a gamble. One I am, personally, willing to take.
Revised Targets into 2028:
$1.60 (+110.5%)
$3.00 (+294.7%)

BTC - trend lines and liquidity zonesHere is a summary of what I'm looking at:
Price currently struggling to surpass the Weekly low @ 115,650 (Blue line)
The green line is acting as resistance, with a brief break-through mid-July.
Huge liquidity zone 120-121.5K which will be inevitably grabbed (Yellow box)
Liquidity sitting below @ 111K (Yellow box)
0.5 fib currently at @ 110K (which also acted as the Weekly high in Jan 25)
A descending channel formation
Analysis:
I believe that Bitcoin with visit the 110K - 111.5K zone which also coincide with the bottom of the channel, the Weekly high @ 110K and 0.5 fib (ish) and grab what liquidity is currently sat below.
Once done, move up to the higher liquidity zone, which would break once again above the Green line which would hopefully flip into support, and send BTC parabolic with a peak Nov-Dec.

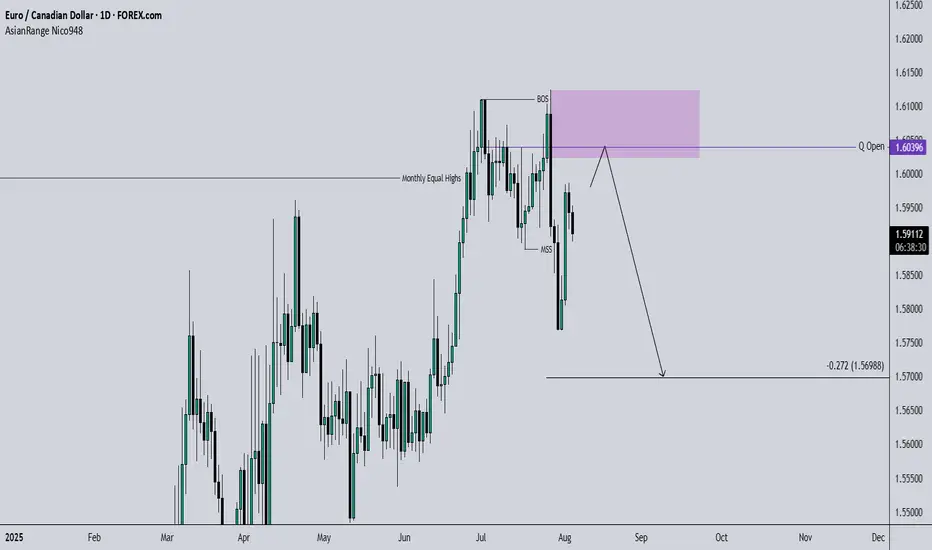
EURCAD SWING: SHORT-TERM SHORT OPPORTUNITYHi there,
Been a while... I was motivated resume sharing my trade ideas by a follower turned Pal (Shloydo). I say this to say - I'd be sharing my thoughts on price more often.
After running equal highs on the monthly chart, price created a MSS and I'd like to see a short-term bearish movement in price.
Once price trades into the highlighted key level (which aligns with the quarterly open price), I'd be looking for a setup to go short.
You could add this to the pairs on your radar.
Cheers,
Jabari