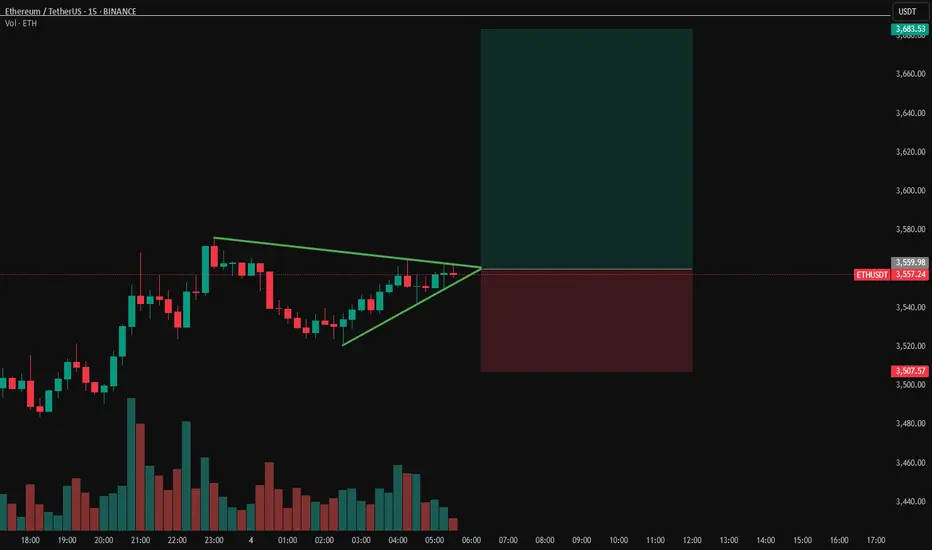
ETHUSDT Breakout ImminentETH sitting on $3500 support after reclaim
Price action is tight and indecisive.. lots of dojis and back-and-forth engulfing candles. Buyers and sellers clearly fighting it out.
We’re coiled in a symmetrical triangle, right on a key level that used to be strong support. It got broken but now reclaimed, im leaning bullish.
S&P and Nasdaq opened strong. If we break out of this triangle to the upside with volume, we could see a quick move toward $3650-3700.
Support and Resistance
USD/JPY IS CURRENTLY EXHIBITING A BEARISH TREND STRUCTUREThe USD/JPY currency pair is currently exhibiting a bearish trend structure on the daily timeframe, signaling potential further declines in the upcoming trading sessions. Price action is trading near a lower high, reinforcing the bearish outlook as sellers appear to be gaining control. This downward momentum follows the recent formation of a bearish engulfing candlestick pattern near a significant resistance level, which often serves as a strong reversal signal. The presence of this pattern near resistance suggests that bullish momentum is weakening, increasing the likelihood of a sustained bearish move.
On the downside, the pair is expected to target the 142.00 level, which could act as a key support zone. A break below this level may accelerate selling pressure, opening the door for further declines. Traders should monitor price reactions around this level for potential consolidation or continuation of the downtrend. Conversely, if the pair attempts a recovery, the 151.300 price level stands as a major resistance barrier. Any bullish retracement towards this zone could attract renewed selling interest, reinforcing the bearish bias.
The overall technical structure suggests that USD/JPY remains vulnerable to additional downside, with bearish momentum likely to persist unless key resistance levels are convincingly breached. Traders may consider short positions on rallies towards resistance or breakdowns below key support levels, while maintaining tight risk management strategies. Given the current market dynamics, the path of least resistance appears to be downward, with 142.00 as the immediate target and 151.300 acting as a critical resistance to watch for any potential trend reversals.

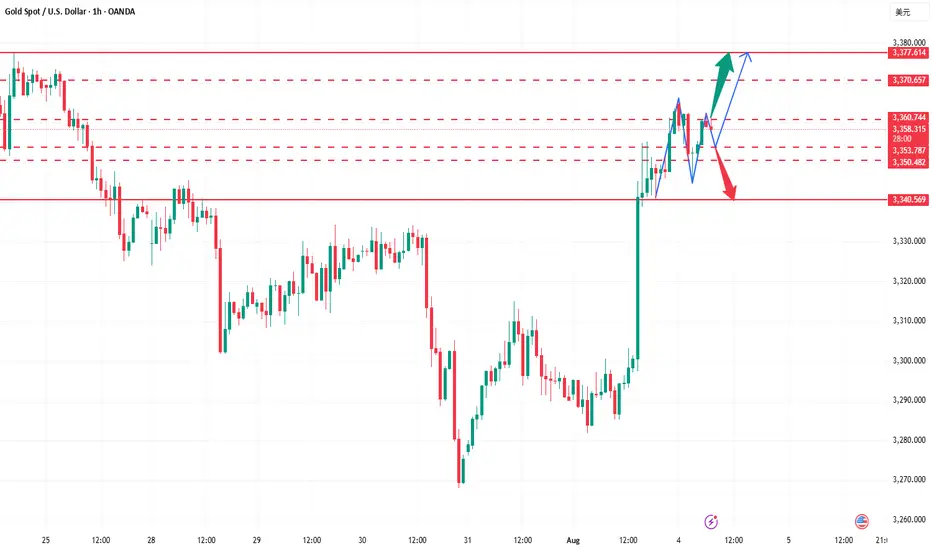
As the bull market continues, is gold poised to hit new highs?Judging from the current gold trend, the technical side opened high and closed low, releasing the demand for short-term adjustments. The intraday low hit 3344 and then rebounded, which is enough to reflect the resilience of the bulls. The hourly doji continued to rise, and the 3353 line was pulled up again. It is expected that it will be difficult to give an entry opportunity near 3340-3345 again. Since the new high has been refreshed again, the technical short-term adjustment may have ended. With the current strong bull structure, further testing the 3370-3380 area is a high probability event. If it unexpectedly falls below 3340 in the future, the bulls will no longer defend strongly, and the market may turn to volatility. Breaking below 3340 is also expected to open up short-term short space, but this is a later story. The current market structure is clear, and we continue to see a strong upward trend for the bulls. At least at the beginning of the week, I do not think the bull market is nearing its end.
Gold operation suggestion: go long around 3360-3355, target 3370-3380.Strictly set stop loss and control your position.
BTC/USDTPossible AMD setup forming. Entry only after clear confirmation.
If validated, the target is a move toward new ATHs.
However, if downside pressure continues, we could see a correction below the $110K level.
Stay reactive — not predictive.

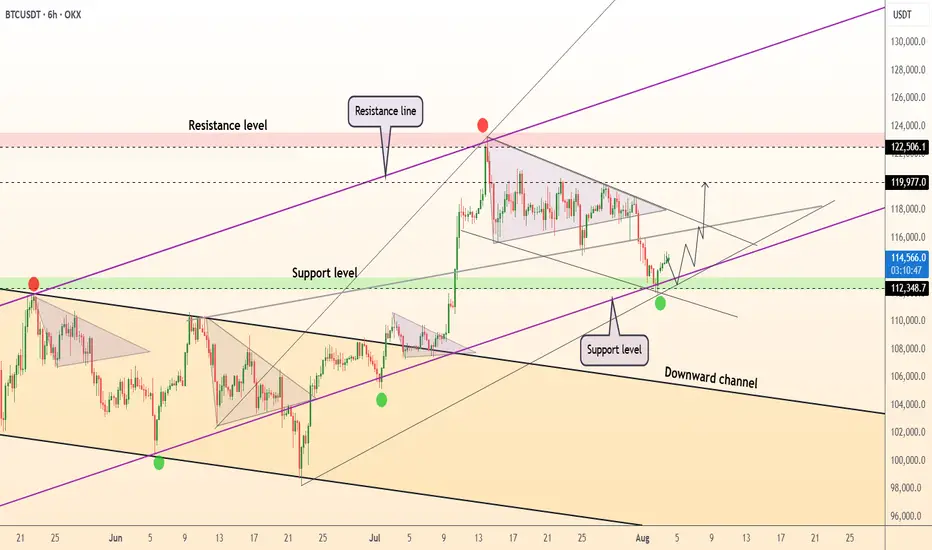
DeGRAM | BTCUSD reached the support level📊 Technical Analysis
● BTCUSD has bounced from confluence support at 112.3k–114.8k, reclaiming the ascending support line and validating the lower boundary of the rising triangle.
● Price action suggests a bullish continuation setup with targets at 119.9k and extension to the upper resistance near 122.5k–125k.
💡 Fundamental Analysis
● US labor data slowdown and dovish Fed commentary have pulled real yields lower, boosting crypto demand.
● Glassnode reports ongoing whale accumulation and rising stablecoin inflows, signaling positive capital rotation into BTC.
✨ Summary
Long above 114.8k. Targets 119.9k → 122.5k+. Setup invalidated on a break below 112.3k support.
-------------------
Share your opinion in the comments and support the idea with a like. Thanks for your support!
XAUUSD shows short-term bearish divergence.XAUUSD shows short-term bearish divergence.
On August 1 gold increased dramatically after the NFP report data came out. No wonder, recession risks generally drive XAUUSD higher due to increased safe-haven demand, a weaker dollar, and expectations of lower interest rates. Gold’s negative correlation with equities and its role as an inflation hedge make it a preferred asset during economic uncertainty.
However, on short-term timeframe, the bullion shows bearish divergence, the asset is to overbought and needs some downward correction in order to cool down a bit. Additionally, the price is retesting former trendline from below. The decline towards 3,300.00 is expected.

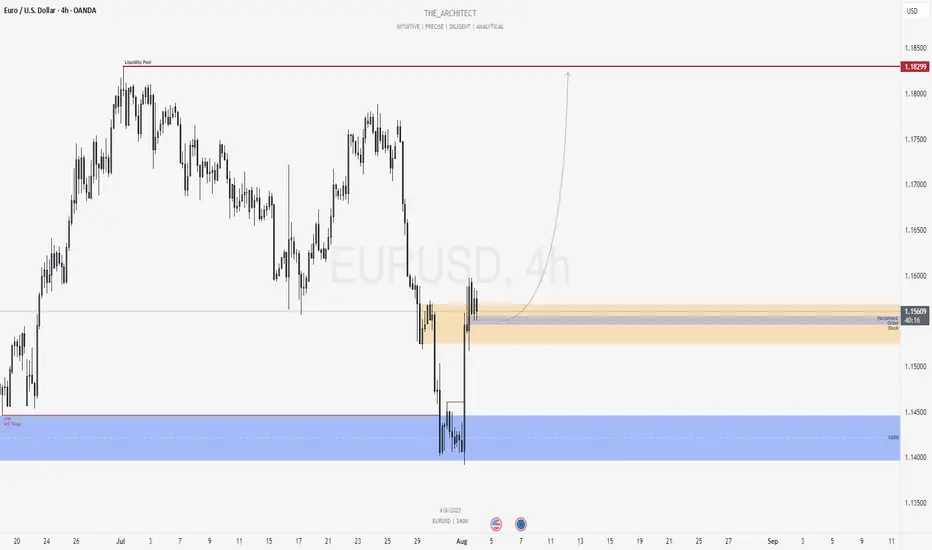
EURUSD: Bullish Continuation from Reclaimed Institutional ZoneGreetings Traders,
In today’s analysis of EURUSD, recent price action confirms the presence of bullish institutional order flow. As a result, we aim to align with this narrative by seeking high-probability buying opportunities at key institutional arrays.
Higher Timeframe Context:
On the weekly timeframe, last week’s candle retraced into a Re-Delivered Re-Balanced (RDRB) Array—a bullish structure often associated with institutional repositioning. From this zone, we anticipate continued bullish delivery towards the weekly liquidity pool, reinforcing a bullish directional bias.
Key Observations on H4:
Bullish Market Structure Shift: Price action on the H4 has decisively shifted bullish, aligning with the higher timeframe’s narrative and confirming our bias.
Reclaimed Order Block Support: Following the bullish shift, price has pulled back into a reclaimed order block—a previously institutional selling zone that, once broken and reclaimed, now acts as a high-probability support area. This becomes a key zone for seeking lower timeframe confirmation entries.
Trading Plan:
Entry Strategy: Look for confirmation entries within the reclaimed order block on lower timeframes (M15–M5).
Target Objective: The draw on liquidity resides at the long-term high, where a cluster of buy-side liquidity is expected to attract price.
For a detailed market walkthrough and in-depth execution zones, be sure to watch this week’s Forex Market Breakdown:
Remain patient and precise in execution. Let the market confirm your bias before entering and manage risk appropriately.
Kind regards,
The Architect 🏛️📈
US 30 Index – Potential Rebound or Deeper Retracement Ahead?Just as the US 30 became the last of the three major US indices to register a new all time high last Monday at 45160, on a final wave of positivity generated by the announcement of a trade deal between the US and EU, it was snatched away again as traders used the up move to take profit on longs.
This initial fall evolved into 5 straight daily declines which took the index from its record high of 45160 on Monday to a Friday close at 43591 as the sell off accelerated, driven by disappointment of a more hawkish than expected Fed, a new wave of trade tariffs from President Trump, weaker Amazon earnings , and on Friday, perhaps the biggest surprise of all, a Non-farm Payrolls release that showed the US labour market may be weakening faster than anticipated.
Looking forward, with the shock of Friday’s data reverberating through markets, US 30 traders still have lots to think about this week. The US ISM Services PMI release is due at 1500 BST on Tuesday. Service activity has been the major driver of growth in the US economy for the last 18 months, so this new update could have a big influence over where the US 30 index moves next. Any reading below 50 = economic contraction, while readings above 50 = economic expansion, and traders could well be focused on how this month’s print stacks up against last month’s reading of 50.8.
The earnings releases of 3 bellwether US corporates may also be relevant, given their US 30 index weightings. Caterpillar reports its Q2 results before the market open on Tuesday, with McDonald’s and Walt Disney reporting before the open on Wednesday. Traders may be looking to compare actual earnings against expected, alongside assessing any future revenue guidance that is provided against the current trade tariff operating environment.
Now, while the US 30 index has opened this new trading week on a more stable footing, currently trading up 0.25% at 43705 at the time of writing (0530 BST), assessing the technical outlook for the week ahead could also be useful for traders.
Technical Update: Deeper Retracement Risk Emerging?
While it might be argued that it was the reaction to the latest US employment data that saw US equities encounter fresh selling pressure, as the chart below shows, prices were already declining into Friday’s payrolls release.
Price weakness was materialising in the US 30 index right after it posted its new all-time high on Monday July 28th at 45160, and traders might now argue that last Thursday’s close below support provided by the Bollinger mid-average, currently at 44412, was the first potential indication that a more extended phase of price weakness was possible. The case was then perhaps strengthened by Friday’s negative reaction to the payrolls data, which saw closing breaks under support provided by the July 16th last correction low at 43770.
There is of course no guarantee that this price action will result in a retracement of the April 7th (36440) to July 28th strength (45160), but assessing what may be the potential support and resistance levels to monitor this week could be helpful, if the recent volatility continues to dominate price action at the start of August.
Possible Support Levels:
Last week’s price decline held at the 43337 level which was the August 1st low, and having previously found buyers at this point, they may be found again. As such, this 43337 level could now prove to be the first support focus for the week ahead.
Closing breaks below 43337, if seen, could lead to the possibility of further price declines, opening potential to test the next support at 41824, which is the 38.2% Fibonacci retracement of April to July 2025 price strength (see chart above).
Possible Resistance Levels:
Having now seen the Bollinger mid-average for the US 30 index turn lower after last week’s fall, this may now be the first resistance level to watch on any subsequent rally higher. It currently stands at 44442 and watching how this level is defended on a closing basis could be useful.
If a more sustained phase of price strength is to materialise, it could be closing breaks above the mid-average at 44442 that increases the possibility of it happening. Such moves could then see retests of the July 28th all-time high at 45160, possibly higher if this level is then breached on a closing basis.
The material provided here has not been prepared accordance with legal requirements designed to promote the independence of investment research and as such is considered to be a marketing communication. Whilst it is not subject to any prohibition on dealing ahead of the dissemination of investment research, we will not seek to take any advantage before providing it to our clients.
Pepperstone doesn’t represent that the material provided here is accurate, current or complete, and therefore shouldn’t be relied upon as such. The information, whether from a third party or not, isn’t to be considered as a recommendation; or an offer to buy or sell; or the solicitation of an offer to buy or sell any security, financial product or instrument; or to participate in any particular trading strategy. It does not take into account readers’ financial situation or investment objectives. We advise any readers of this content to seek their own advice. Without the approval of Pepperstone, reproduction or redistribution of this information isn’t permitted.

USDJPY → False breakdown of upward trend supportFX:USDJPY is testing trend support as part of a correction triggered by news. The dollar has been recovering since the start of the session, giving the pair a chance to rise.
As part of a correction against the backdrop of sharp and unexpected Friday NFP data, the currency pair is forming a false breakdown of trend support and testing the 0.7f buy zone. The market is reacting to the retest of support. Momentum is forming. Focus on the local range of 147.6 - 147.9. If the bulls keep the price above this consolidation, the price may continue to rise
Resistance levels: 147.95, 149.02
Support levels: 157.55, 147.0
Focus on the trend and the indicated consolidation, which may move into the realization phase. If the bulls take the initiative, the pair will have a chance to rise to 149 - 150.8.
Best regards, R. Linda!

DeGRAM | GBPUSD is forming the falling wedge📊 Technical Analysis
● GBPUSD is attempting a reversal from the lower boundary of a descending channel after forming a short-term double-bottom near 1.3138.
● Price is now climbing toward 1.3258 resistance, supported by bullish divergence and a break of the local falling wedge.
💡 Fundamental Analysis
● The USD is under pressure ahead of key NFP data, as ISM manufacturing misses weighed on Treasury yields.
● Positive UK PMI and consumer lending data have supported GBP, with BoE policy expectations firming above neutral.
✨ Summary
Long bias above 1.3138. Breakout targets 1.3258 ➜ 1.3423. Setup valid while price holds above 1.3110 support.
-------------------
Share your opinion in the comments and support the idea with a like. Thanks for your support!

EURUSD – Retest in Play After NFP Reversal?EURUSD started last week with a heavy bearish tone, dropping 200 pips on Monday alone — which is quite a move for such a typically stable pair.
After a brief consolidation around the neckline support of the recent double top, sellers came back in, pushing the pair down to 1.1400 by Friday — a level I highlighted in my previous analysis.
But then came NFP...
The weak jobs data triggered a sharp bullish reversal, and the euro took off like a rocket.
By the weekly close, the pair had rallied all the way back to the neckline zone, now acting as potential resistance.
________________________________________
🔍 Technical Outlook:
This area around 1.1550–1.1590 could now serve as a retest of the broken structure.
• 🔽 A rejection here, followed by a break back below 1.1500, would confirm the bearish scenario and open the door for a move toward 1.1200, the next major support.
• 📌 On the flip side, a sustained move above the neckline would invalidate the double top — and put bulls back in control.
________________________________________
Conclusion:
Watching for sell signals around the neckline makes technical sense — but confirmation is key.
The reaction early this week will likely set the tone for the next major swing.
Disclosure: I am part of TradeNation's Influencer program and receive a monthly fee for using their TradingView charts in my analyses and educational articles.

GBPJPY: More Growth is Coming! 🇬🇧🇯🇵
GBPJPY will likely bounce from a key daily support,
following a formation of a double bottom pattern
on an hourly time frame.
I think that the price will reach 196.7 level soon.
❤️Please, support my work with like, thank you!❤️
I am part of Trade Nation's Influencer program and receive a monthly fee for using their TradingView charts in my analysis.

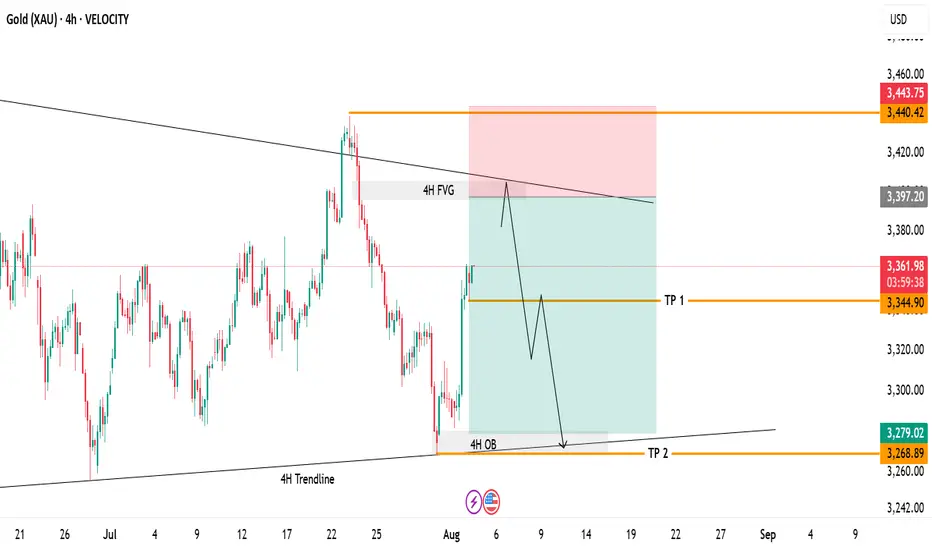
Gold 4H Swing Trade Setup!Currently watching price action as it approaches the 4H Fair Value Gap and descending trendline resistance. Price has not tapped this zone yet, and a move higher into this area could set up a potential reversal.
Setup Highlights:
4H FVG: 3,397–3,400 – Main area of interest.
Trendline Resistance: Confluence zone to watch for rejection.
Plan: Waiting for price to fill the imbalance and test the resistance before considering short entries.
Targets if Rejection Occurs:
TP1: 3,344 – First partial target.
TP2: 3,268 – 4H OB retest.
Invalidation:
A clear breakout and hold above 3,440 would invalidate the bearish scenario.
USD/JPY FORMING BEARISH TREND STRUCTURE IN DAILY CHARTThe USD/JPY currency pair is currently exhibiting a bearish trend structure on the daily timeframe, signaling potential further declines in the upcoming trading sessions. Price action is trading near a lower high, reinforcing the bearish outlook as sellers appear to be gaining control. This downward momentum follows the recent formation of a bearish engulfing candlestick pattern near a significant resistance level, which often serves as a strong reversal signal. The presence of this pattern near resistance suggests that bullish momentum is weakening, increasing the likelihood of a sustained bearish move.
On the downside, the pair is expected to target the 142.300 level, which could act as a key support zone. A break below this level may accelerate selling pressure, opening the door for further declines. Traders should monitor price reactions around this level for potential consolidation or continuation of the downtrend. Conversely, if the pair attempts a recovery, the 151.300 price level stands as a major resistance barrier. Any bullish retracement towards this zone could attract renewed selling interest, reinforcing the bearish bias.
The overall technical structure suggests that USD/JPY remains vulnerable to additional downside, with bearish momentum likely to persist unless key resistance levels are convincingly breached. Traders may consider short positions on rallies towards resistance or breakdowns below key support levels, while maintaining tight risk management strategies. Given the current market dynamics, the path of least resistance appears to be downward, with 142.300 as the immediate target and 151.300 acting as a critical resistance to watch for any potential trend reversals.

BUY EURCAD 4.8.2025Confluence order: BUY at M15
Type of order: Limit order
Reason:
- The current top is not touching anything, expected to rise to the sub-key of H1 above.
Note:
- Management of money carefully at the last bottom (1,59310)
Set up entry:
- Entry buy at 1,59090
- SL at 1,58910
- TP1: 1,59310 (~1R)
- TP2: 1,59824 (~4R)
- TP3: 1,60200 (~6R)
Trading Method: Price action (No indicator, only trend and candles)

SILVER (XAGUSD): Bullish Reversal from Support Silver reacted significantly to the highlighted intraday resistance level during Friday's New York session.
I noticed a small double bottom pattern and the emergence of a bullish engulfing candle. I anticipate a pullback to the 37.72 level.

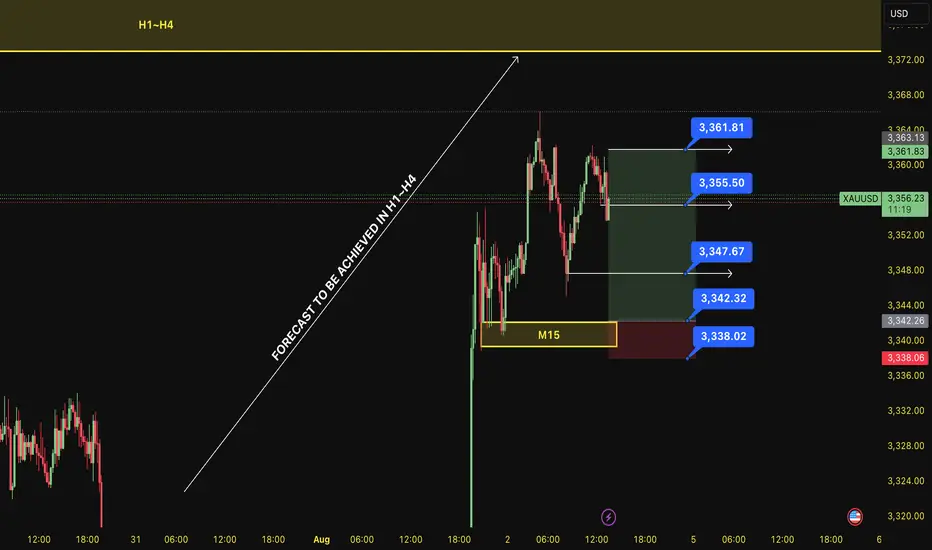
BUY XAU 4.8.2025Confluence order: BUY at M15
Type of order: Limit order
Reason:
- The current top is not touching anything, expected to rise to the H4~H1 above.
Note:
- Management of money carefully at the last bottom (3,347)
Set up entry:
- Entry buy at 3,342
- SL at 3,338
- TP1: 3,347 (~1R)
- TP2: 3,355 (~3R)
- TP3: 3,361 (~4,5R)
Trading Method: Price action (No indicator, only trend and candles)
EURUSD: Pullback From Resistance 🇪🇺🇺🇸
EURUSD strongly reacted to the underlined intraday
resistance area after the market opening.
I see a tine double top pattern on that and a formation
of a bearish engulfing candle.
I expect a retracement to 1.154 level.
❤️Please, support my work with like, thank you!❤️

#GBPUSD: Pullback Trade Confirmed?!📈GBPUSD rebounded from the highlighted key support level,
As a confirmation signal i observed a strong bullish Change of Character (CHoCH) on the 4-hour timeframe following its test.
The target is set at 1.3350.


04/08/25 Gold Swing LevelsBack to Gold but with daily swing levels.
Monday 04/08/25 levels are marked; depending on if market opens with a gap, price should continue upwards.
Trade parameters
Entry on 5 min chart
Sl: 30-50pips
TP: 2-4x SL

SOLUSDT: The Bears' Defense Holds Firm at the Golden Ratio. SOLUSDT: The Bears' Defense Holds Firm at the Golden Ratio. What's Next?
The Solana market has undergone a significant correction from its all-time highs, and the recent price action suggests the downtrend may not be over. The current structure is defined by a clear rejection from a formidable resistance zone, signaling that sellers remain in control for now.
The Bearish Rejection & Crucial Resistance 🔴🚨
Following the initial sharp decline, price made a notable attempt at a recovery, forming a rising intermediary support trendline. However, this recovery rally was decisively halted at a critical level—a confluence of a Crucial Resistance Zone and the 0.5 to 0.618 Fibonacci retracement levels. This red zone, from approximately $195 to $218, has proven to be a major supply area. The recent price action saw a strong rejection from this region, with the price now breaking below its intermediary support trendline.
The Breakdown of Intermediary Support 📉
The rising white trendline, which had provided support for several months, has been broken. This breakdown is a significant bearish signal, indicating a loss of momentum and a potential shift in the short-term trend from bullish to bearish. This event increases the probability of a move toward lower support levels.
The Ultimate Line in the Sand: Long-term Support 💪🟢
Should the current bearish momentum continue, the next major demand zone is the Long-term Support area, a wide green band from approximately $100 to $120. This region has historically served as a strong base of support and represents the last major line of defense for the bulls. A test of this zone would be a significant event, and a break below it could lead to further extended declines.
What to Watch For: The Path to Bullish Confirmation 🚀
For the sentiment to turn definitively bullish, Solana needs to demonstrate a new wave of buying power that is strong enough to overcome the current overhead resistance. The market must see a sustained break and close above the Crucial Resistance Zone ($195-$218), specifically above the 0.618 Fibonacci level. A successful push above this formidable barrier, especially with strong volume, would invalidate the current bearish outlook and signal a potential move toward new highs. Until then, the path of least resistance remains to the downside.
Disclaimer:
The information provided in this chart is for educational and informational purposes only and should not be considered as investment advice. Trading and investing involve substantial risk and are not suitable for every investor. You should carefully consider your financial situation and consult with a financial advisor before making any investment decisions. The creator of this chart does not guarantee any specific outcome or profit and is not responsible for any losses incurred as a result of using this information. Past performance is not indicative of future results. Use this information at your own risk. This chart has been created for my own improvement in Trading and Investment Analysis. Please do your own analysis before any investments.

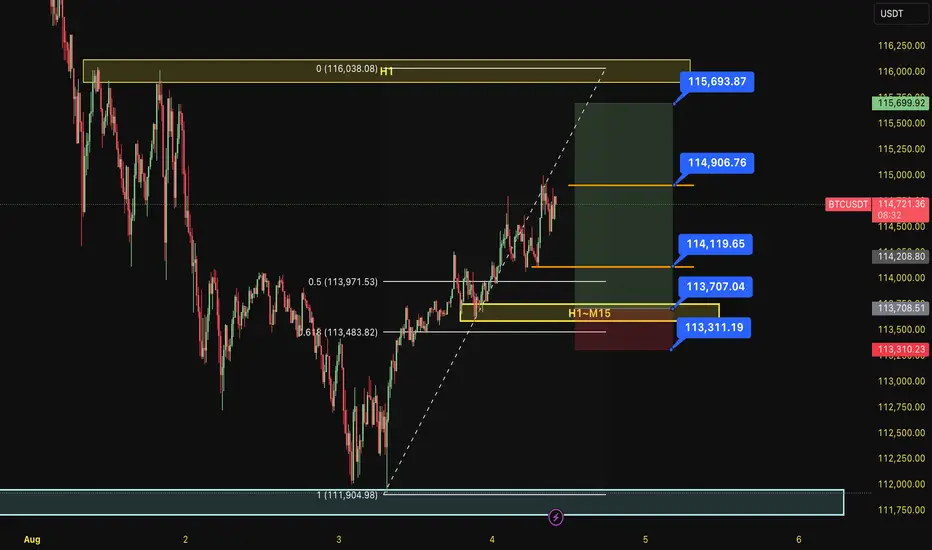
BUY BTC 4.8.2025Confluence order: BUY at H1~M15
Type of order: Limit order
Reason:
- The current top is not touching anything, expected to rise to the H1 above.
- M15~FIBO 0,5-0,618 (same position)
Note:
- Management of money carefully at the last bottom (114,119)
Set up entry:
- Entry buy at 113,707
- SL at 113,311
- TP1: 114,119 (~1R)
- TP2: 114,906 (~3R)
- TP3: 115,963 (~5R)
Trading Method: Price action (No indicator, only trend and candles)