Bullish potential detected for EthereumEntry conditions:
(i) higher share price for COINBASE:ETHUSD along with MACD crossover on the 4 hour chart at the low end of the scale with histogram crossover zero,
(ii) bounce off potential support zones of 15 min / 1 hour and 4 hour intraday timeframes, and
(iii) observation of market reaction at these support zones.
Stop loss for the trade would be below the ultimate support level from the open of 22nd January (i.e.: below $3327.56).
Support and Resistance

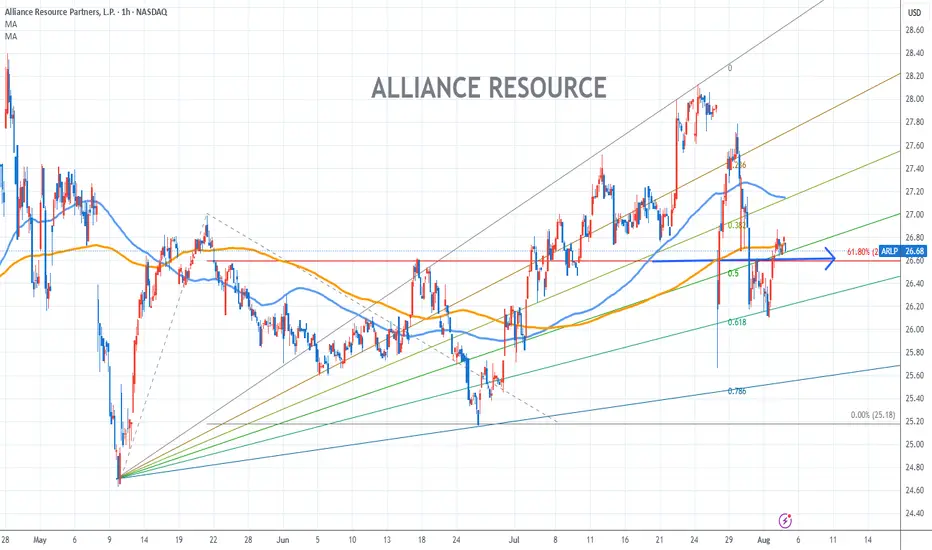
Alliance Resource Chart Fibonacci Analysis 080425Trading Idea
1) Find a FIBO slingshot
2) Check FIBO 61.80% level
3) Entry Point 27/61.80%
Chart time frame:B
A) 15 min(1W-3M)
B) 1 hr(3M-6M)
C) 4 hr(6M-1year)
D) 1 day(1-3years)
Stock progress:A
A) Keep rising over 61.80% resistance
B) 61.80% resistance
C) 61.80% support
D) Hit the bottom
E) Hit the top
Stocks rise as they rise from support and fall from resistance. Our goal is to find a low support point and enter. It can be referred to as buying at the pullback point. The pullback point can be found with a Fibonacci extension of 61.80%. This is a step to find entry level. 1) Find a triangle (Fibonacci Speed Fan Line) that connects the high (resistance) and low (support) points of the stock in progress, where it is continuously expressed as a Slingshot, 2) and create a Fibonacci extension level for the first rising wave from the start point of slingshot pattern.
When the current price goes over 61.80% level , that can be a good entry point, especially if the SMA 100 and 200 curves are gathered together at 61.80%, it is a very good entry point.
As a great help, tradingview provides these Fibonacci speed fan lines and extension levels with ease. So if you use the Fibonacci fan line, the extension level, and the SMA 100/200 curve well, you can find an entry point for the stock market. At least you have to enter at this low point to avoid trading failure, and if you are skilled at entering this low point, with fibonacci6180 technique, your reading skill to chart will be greatly improved.
If you want to do day trading, please set the time frame to 5 minutes or 15 minutes, and you will see many of the low point of rising stocks.
If want to prefer long term range trading, you can set the time frame to 1 hr or 1 day.
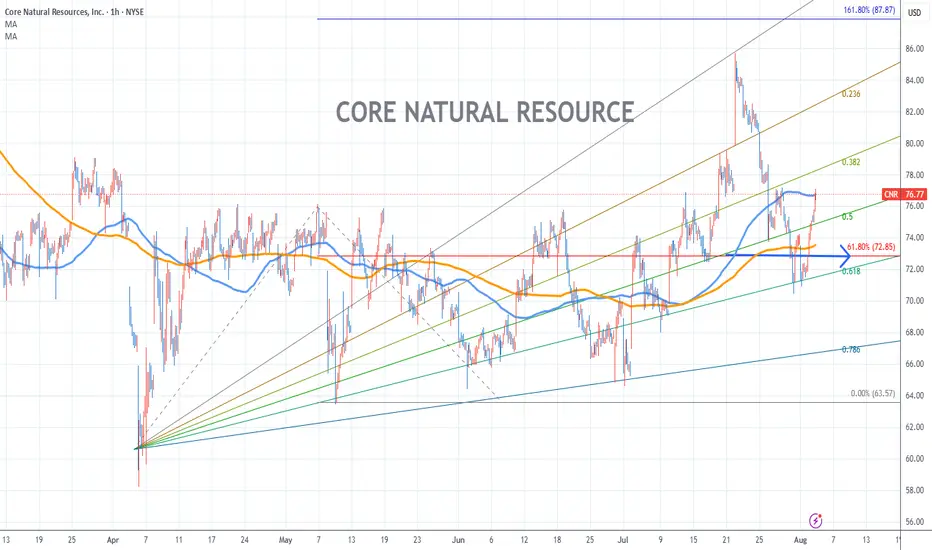
Core Natual Resource Chart Fibonacci Analysis 080425Trading Idea
1) Find a FIBO slingshot
2) Check FIBO 61.80% level
3) Entry Point 73/61.80%
Chart time frame:B
A) 15 min(1W-3M)
B) 1 hr(3M-6M)
C) 4 hr(6M-1year)
D) 1 day(1-3years)
Stock progress:A
A) Keep rising over 61.80% resistance
B) 61.80% resistance
C) 61.80% support
D) Hit the bottom
E) Hit the top
Stocks rise as they rise from support and fall from resistance. Our goal is to find a low support point and enter. It can be referred to as buying at the pullback point. The pullback point can be found with a Fibonacci extension of 61.80%. This is a step to find entry level. 1) Find a triangle (Fibonacci Speed Fan Line) that connects the high (resistance) and low (support) points of the stock in progress, where it is continuously expressed as a Slingshot, 2) and create a Fibonacci extension level for the first rising wave from the start point of slingshot pattern.
When the current price goes over 61.80% level , that can be a good entry point, especially if the SMA 100 and 200 curves are gathered together at 61.80%, it is a very good entry point.
As a great help, tradingview provides these Fibonacci speed fan lines and extension levels with ease. So if you use the Fibonacci fan line, the extension level, and the SMA 100/200 curve well, you can find an entry point for the stock market. At least you have to enter at this low point to avoid trading failure, and if you are skilled at entering this low point, with fibonacci6180 technique, your reading skill to chart will be greatly improved.
If you want to do day trading, please set the time frame to 5 minutes or 15 minutes, and you will see many of the low point of rising stocks.
If want to prefer long term range trading, you can set the time frame to 1 hr or 1 day.
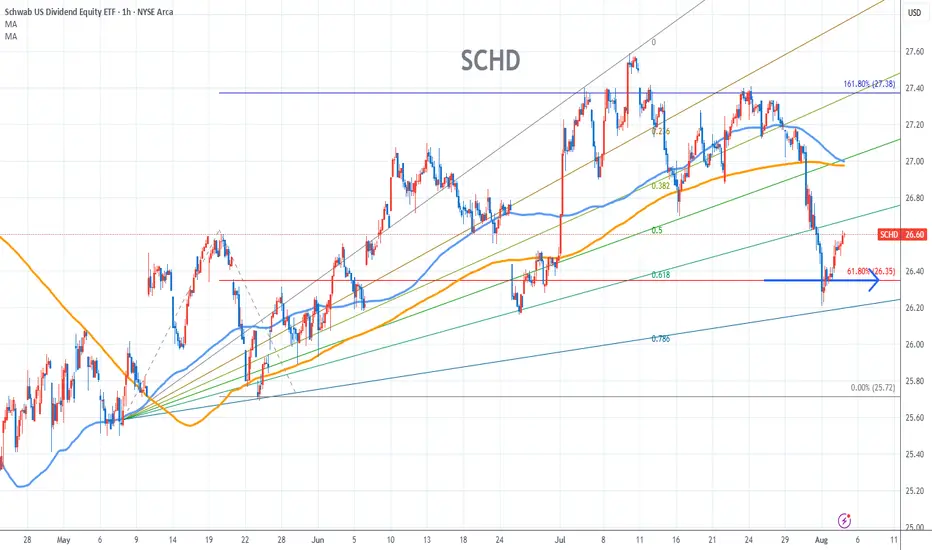
SCHD Chart Fibonacci Analysis 080425Trading Idea
1) Find a FIBO slingshot
2) Check FIBO 61.80% level
3) Entry Point 26.3/61.80%
Chart time frame:B
A) 15 min(1W-3M)
B) 1 hr(3M-6M)
C) 4 hr(6M-1year)
D) 1 day(1-3years)
Stock progress:C
A) Keep rising over 61.80% resistance
B) 61.80% resistance
C) 61.80% support
D) Hit the bottom
E) Hit the top
Stocks rise as they rise from support and fall from resistance. Our goal is to find a low support point and enter. It can be referred to as buying at the pullback point. The pullback point can be found with a Fibonacci extension of 61.80%. This is a step to find entry level. 1) Find a triangle (Fibonacci Speed Fan Line) that connects the high (resistance) and low (support) points of the stock in progress, where it is continuously expressed as a Slingshot, 2) and create a Fibonacci extension level for the first rising wave from the start point of slingshot pattern.
When the current price goes over 61.80% level , that can be a good entry point, especially if the SMA 100 and 200 curves are gathered together at 61.80%, it is a very good entry point.
As a great help, tradingview provides these Fibonacci speed fan lines and extension levels with ease. So if you use the Fibonacci fan line, the extension level, and the SMA 100/200 curve well, you can find an entry point for the stock market. At least you have to enter at this low point to avoid trading failure, and if you are skilled at entering this low point, with fibonacci6180 technique, your reading skill to chart will be greatly improved.
If you want to do day trading, please set the time frame to 5 minutes or 15 minutes, and you will see many of the low point of rising stocks.
If want to prefer long term range trading, you can set the time frame to 1 hr or 1 day.
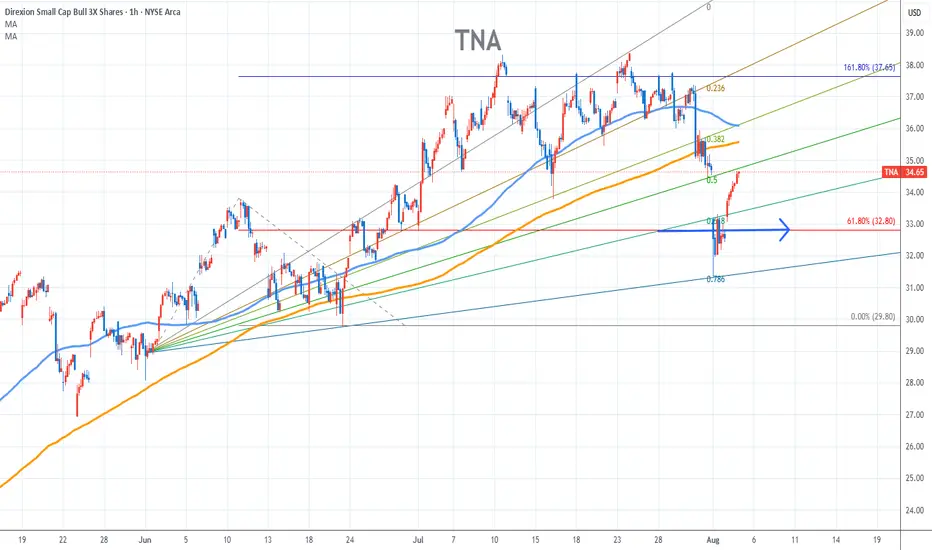
TNA Chart Fibonacci Analysis 080425Trading Idea
1) Find a FIBO slingshot
2) Check FIBO 61.80% level
3) Entry Point 32.8/61.80%
Chart time frame:B
A) 15 min(1W-3M)
B) 1 hr(3M-6M)
C) 4 hr(6M-1year)
D) 1 day(1-3years)
Stock progress:A
A) Keep rising over 61.80% resistance
B) 61.80% resistance
C) 61.80% support
D) Hit the bottom
E) Hit the top
Stocks rise as they rise from support and fall from resistance. Our goal is to find a low support point and enter. It can be referred to as buying at the pullback point. The pullback point can be found with a Fibonacci extension of 61.80%. This is a step to find entry level. 1) Find a triangle (Fibonacci Speed Fan Line) that connects the high (resistance) and low (support) points of the stock in progress, where it is continuously expressed as a Slingshot, 2) and create a Fibonacci extension level for the first rising wave from the start point of slingshot pattern.
When the current price goes over 61.80% level , that can be a good entry point, especially if the SMA 100 and 200 curves are gathered together at 61.80%, it is a very good entry point.
As a great help, tradingview provides these Fibonacci speed fan lines and extension levels with ease. So if you use the Fibonacci fan line, the extension level, and the SMA 100/200 curve well, you can find an entry point for the stock market. At least you have to enter at this low point to avoid trading failure, and if you are skilled at entering this low point, with fibonacci6180 technique, your reading skill to chart will be greatly improved.
If you want to do day trading, please set the time frame to 5 minutes or 15 minutes, and you will see many of the low point of rising stocks.
If want to prefer long term range trading, you can set the time frame to 1 hr or 1 day.
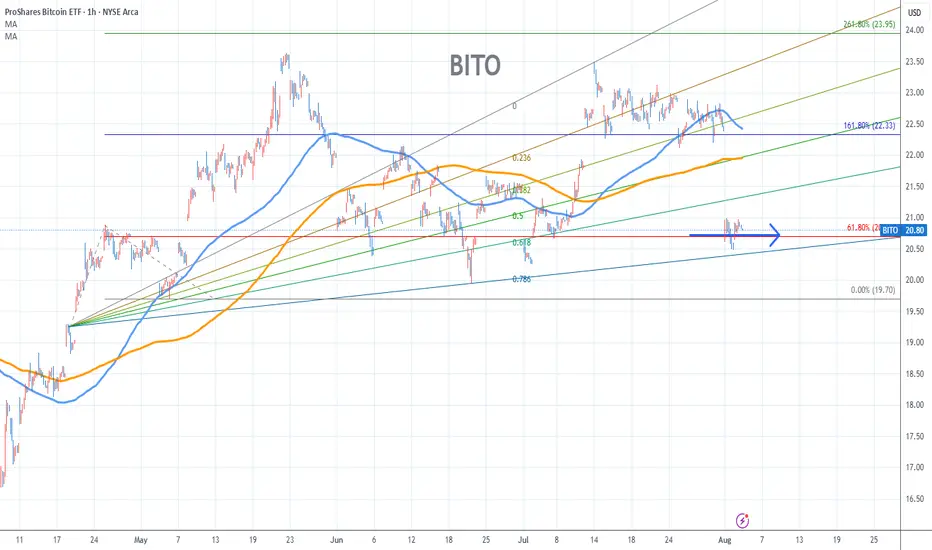
BITO Chart Fibonacci Analysis 080425Trading Idea
1) Find a FIBO slingshot
2) Check FIBO 61.80% level
3) Entry Point 20.7/61.80%
Chart time frame:B
A) 15 min(1W-3M)
B) 1 hr(3M-6M)
C) 4 hr(6M-1year)
D) 1 day(1-3years)
Stock progress:C
A) Keep rising over 61.80% resistance
B) 61.80% resistance
C) 61.80% support
D) Hit the bottom
E) Hit the top
Stocks rise as they rise from support and fall from resistance. Our goal is to find a low support point and enter. It can be referred to as buying at the pullback point. The pullback point can be found with a Fibonacci extension of 61.80%. This is a step to find entry level. 1) Find a triangle (Fibonacci Speed Fan Line) that connects the high (resistance) and low (support) points of the stock in progress, where it is continuously expressed as a Slingshot, 2) and create a Fibonacci extension level for the first rising wave from the start point of slingshot pattern.
When the current price goes over 61.80% level , that can be a good entry point, especially if the SMA 100 and 200 curves are gathered together at 61.80%, it is a very good entry point.
As a great help, tradingview provides these Fibonacci speed fan lines and extension levels with ease. So if you use the Fibonacci fan line, the extension level, and the SMA 100/200 curve well, you can find an entry point for the stock market. At least you have to enter at this low point to avoid trading failure, and if you are skilled at entering this low point, with fibonacci6180 technique, your reading skill to chart will be greatly improved.
If you want to do day trading, please set the time frame to 5 minutes or 15 minutes, and you will see many of the low point of rising stocks.
If want to prefer long term range trading, you can set the time frame to 1 hr or 1 day.
Altcoins Recovering: TOTAL3 Bounces from Key Support ZoneIn my previous analysis on TOTAL3, I mentioned that I'm working with two possible bullish scenarios for altcoins. It now seems we're firmly in Scenario #2.
📉 The price dropped exactly into the highlighted support zone, then yesterday we saw a clean recovery and reversal starting right from that area — a textbook technical reaction.
📈 At the time of writing, TOTAL3 sits at $986B, and a break above the $995B–$1T resistance could trigger a new leg up for altcoins.
🎯 Short- and mid-term targets remain:
• $1.08T (recent top)
• $1.15T
• Potential for new all-time highs if momentum builds
✅ As long as price holds above the $920–$930B support zone, bulls remain in control. This keeps the door open for selective altcoin entries — ideally, projects with real structure, strong tokenomics, and clear momentum.

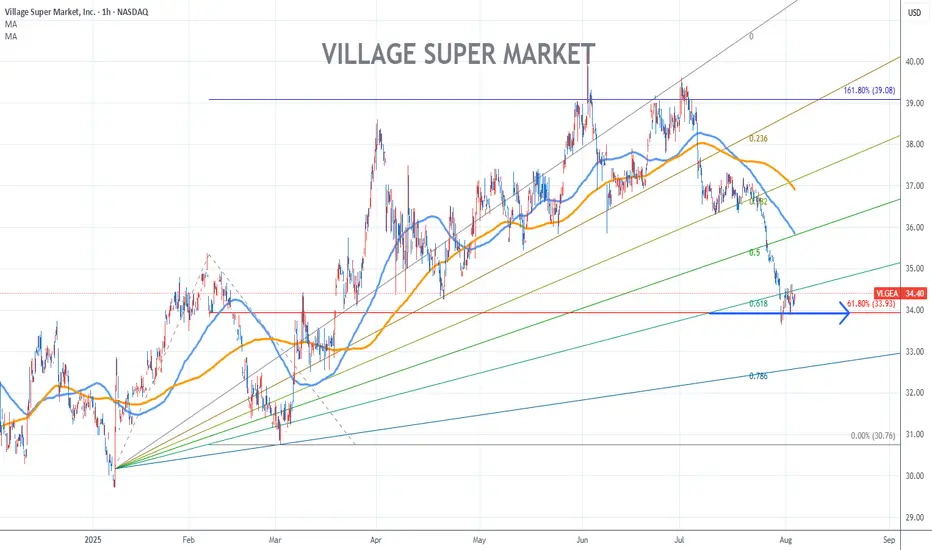
Village Super Market Chart Fibonacci Analysis 080425Trading Idea
1) Find a FIBO slingshot
2) Check FIBO 61.80% level
3) Entry Point 34/61.80%
Chart time frame:B
A) 15 min(1W-3M)
B) 1 hr(3M-6M)
C) 4 hr(6M-1year)
D) 1 day(1-3years)
Stock progress:C
A) Keep rising over 61.80% resistance
B) 61.80% resistance
C) 61.80% support
D) Hit the bottom
E) Hit the top
Stocks rise as they rise from support and fall from resistance. Our goal is to find a low support point and enter. It can be referred to as buying at the pullback point. The pullback point can be found with a Fibonacci extension of 61.80%. This is a step to find entry level. 1) Find a triangle (Fibonacci Speed Fan Line) that connects the high (resistance) and low (support) points of the stock in progress, where it is continuously expressed as a Slingshot, 2) and create a Fibonacci extension level for the first rising wave from the start point of slingshot pattern.
When the current price goes over 61.80% level , that can be a good entry point, especially if the SMA 100 and 200 curves are gathered together at 61.80%, it is a very good entry point.
As a great help, tradingview provides these Fibonacci speed fan lines and extension levels with ease. So if you use the Fibonacci fan line, the extension level, and the SMA 100/200 curve well, you can find an entry point for the stock market. At least you have to enter at this low point to avoid trading failure, and if you are skilled at entering this low point, with fibonacci6180 technique, your reading skill to chart will be greatly improved.
If you want to do day trading, please set the time frame to 5 minutes or 15 minutes, and you will see many of the low point of rising stocks.
If want to prefer long term range trading, you can set the time frame to 1 hr or 1 day.
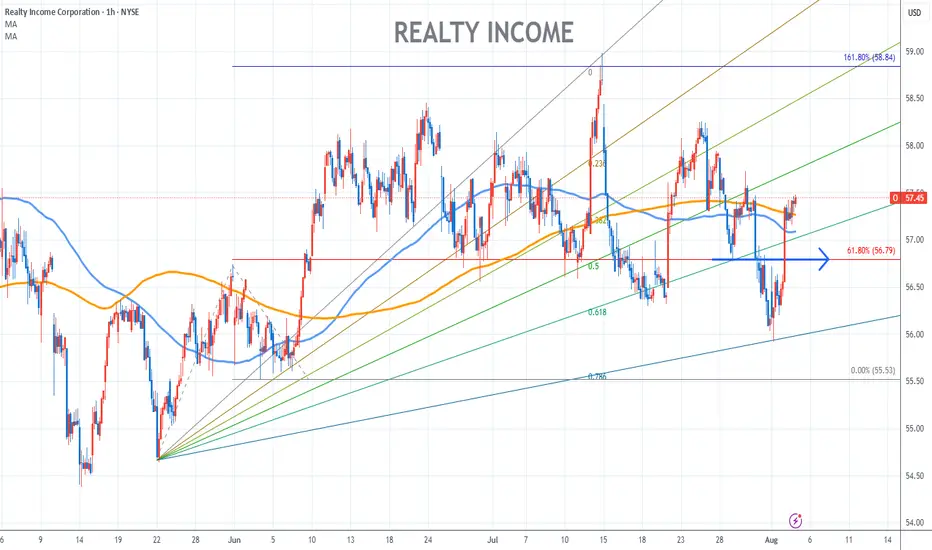
Realty Income Chart Fibonacci Analysis 080425Trading Idea
1) Find a FIBO slingshot
2) Check FIBO 61.80% level
3) Entry Point 57/61.80%
Chart time frame:B
A) 15 min(1W-3M)
B) 1 hr(3M-6M)
C) 4 hr(6M-1year)
D) 1 day(1-3years)
Stock progress:A
A) Keep rising over 61.80% resistance
B) 61.80% resistance
C) 61.80% support
D) Hit the bottom
E) Hit the top
Stocks rise as they rise from support and fall from resistance. Our goal is to find a low support point and enter. It can be referred to as buying at the pullback point. The pullback point can be found with a Fibonacci extension of 61.80%. This is a step to find entry level. 1) Find a triangle (Fibonacci Speed Fan Line) that connects the high (resistance) and low (support) points of the stock in progress, where it is continuously expressed as a Slingshot, 2) and create a Fibonacci extension level for the first rising wave from the start point of slingshot pattern.
When the current price goes over 61.80% level , that can be a good entry point, especially if the SMA 100 and 200 curves are gathered together at 61.80%, it is a very good entry point.
As a great help, tradingview provides these Fibonacci speed fan lines and extension levels with ease. So if you use the Fibonacci fan line, the extension level, and the SMA 100/200 curve well, you can find an entry point for the stock market. At least you have to enter at this low point to avoid trading failure, and if you are skilled at entering this low point, with fibonacci6180 technique, your reading skill to chart will be greatly improved.
If you want to do day trading, please set the time frame to 5 minutes or 15 minutes, and you will see many of the low point of rising stocks.
If want to prefer long term range trading, you can set the time frame to 1 hr or 1 day.
Apple Chart Fibonacci Analysis 080425Trading Idea
1) Find a FIBO slingshot
2) Check FIBO 61.80% level
3) Entry Point 203/61.80%
Chart time frame:B
A) 15 min(1W-3M)
B) 1 hr(3M-6M)
C) 4 hr(6M-1year)
D) 1 day(1-3years)
Stock progress:C
A) Keep rising over 61.80% resistance
B) 61.80% resistance
C) 61.80% support
D) Hit the bottom
E) Hit the top
Stocks rise as they rise from support and fall from resistance. Our goal is to find a low support point and enter. It can be referred to as buying at the pullback point. The pullback point can be found with a Fibonacci extension of 61.80%. This is a step to find entry level. 1) Find a triangle (Fibonacci Speed Fan Line) that connects the high (resistance) and low (support) points of the stock in progress, where it is continuously expressed as a Slingshot, 2) and create a Fibonacci extension level for the first rising wave from the start point of slingshot pattern.
When the current price goes over 61.80% level , that can be a good entry point, especially if the SMA 100 and 200 curves are gathered together at 61.80%, it is a very good entry point.
As a great help, tradingview provides these Fibonacci speed fan lines and extension levels with ease. So if you use the Fibonacci fan line, the extension level, and the SMA 100/200 curve well, you can find an entry point for the stock market. At least you have to enter at this low point to avoid trading failure, and if you are skilled at entering this low point, with fibonacci6180 technique, your reading skill to chart will be greatly improved.
If you want to do day trading, please set the time frame to 5 minutes or 15 minutes, and you will see many of the low point of rising stocks.
If want to prefer long term range trading, you can set the time frame to 1 hr or 1 day.

Yunji IncYunji may have placed a foundation. Is this the bottom or the end? I see no reason for this to end but rather a new beginning. Yunji to the moon (to liquidity, and beyond) I say!

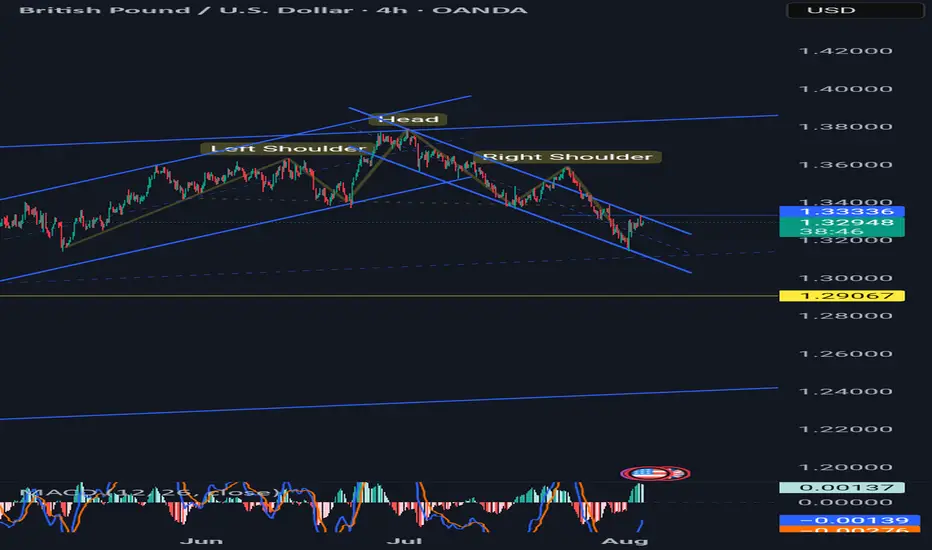
GBPUSD ANALYSISAfter seeing the previous day close and reject an area of resistance and a break below the trendline area of support on the lower timeframe, but with the daily still bearish the 4hr is pushing to the upside. A break of 4hr structure support could be a clear signal that sellers are now pushing price.

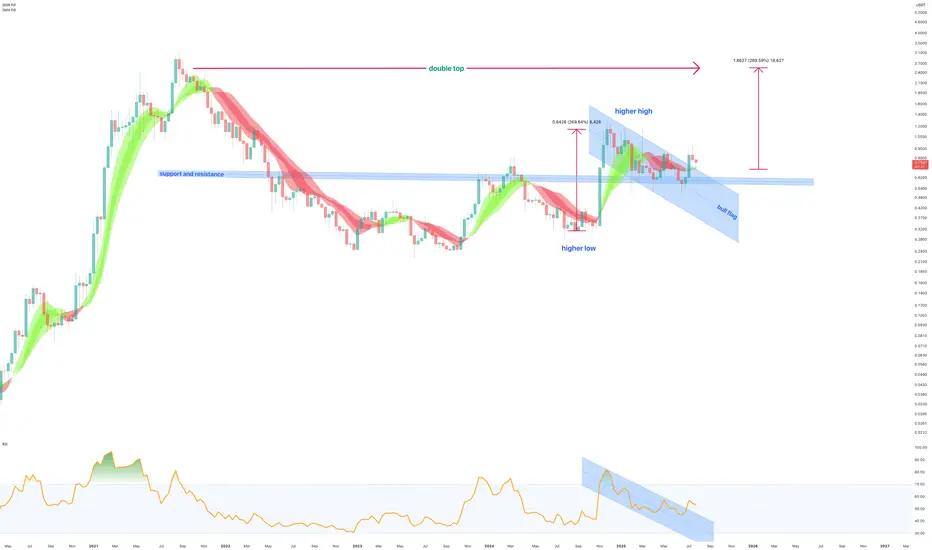
August 4th - Cardano (ADA) bull flag to print 250% move to $2.50
On the above 10 day chart price action is shown with a 40% correction since December last year. A number of reasons now exist for a bullish outlook, including:
Support and resistance
Price action confirms support on past 3 year resistance around 60 cents
Trend reversal
The support confirmation is followed by higher low and higher high prints.
The Bull flag
A measured move from the first impulsive wave will see price action move to the previous all time high of circa $2.50
Summary
The flag set up is fairly reliable with a high success rate for continuation with 60% probability. However avoid greed at the forecast area, many people entered the market at $2.50 in 2021. This was the worst possible moment and have been waiting for this opportunity to exit. Do not be their exit liquidity!
Is it possible price action continues lower? Sure.
Is it probable? No.
Ww
SYK watch 365-366: Proven Resistance to tariff recovery wave SYK struggling with previous highs now resistance.
The key zone for bulls to break is $365.54-366.31
If it dips, not much support until $343.86-347.98

GBPJPY Wave Analysis – 4 August 2025
- GBPJPY reversed from the resistance zone
- Likely to fall to support level 194.00
GBPJPY currency pair recently reversed from the resistance zone between the round resistance level 200.00 (which has been reversing the price from October) and the upper daily Bollinger Band.
The downward reversal from this resistance zone created the daily Japanese candlesticks reversal pattern Bearish Engulfing, which started the active wave c.
Given the predominantly bearish sterling sentiment seen today, GBPJPY can be expected to fall to the next support level 194.00 (target for the completion of the active wave 2).

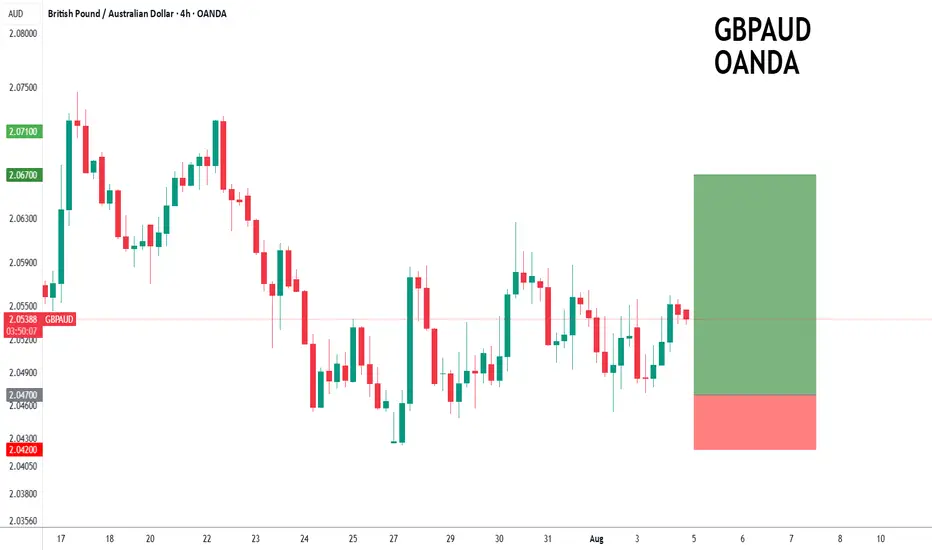
GBPAUD forming a bottom?GBPAUD - 24h expiry
The primary trend remains bullish.
Price action looks to be forming a bottom.
We look for a temporary move lower.
Preferred trade is to buy on dips.
Bespoke support is located at 2.0470.
We look to Buy at 2.0470 (stop at 2.0420)
Our profit targets will be 2.0670 and 2.0700
Resistance: 2.0600 / 2.0670 / 2.0700
Support: 2.0450 / 2.0420 / 2.0390
Risk Disclaimer
The trade ideas beyond this page are for informational purposes only and do not constitute investment advice or a solicitation to trade. This information is provided by Signal Centre, a third-party unaffiliated with OANDA, and is intended for general circulation only. OANDA does not guarantee the accuracy of this information and assumes no responsibilities for the information provided by the third party. The information does not take into account the specific investment objectives, financial situation, or particular needs of any particular person. You should take into account your specific investment objectives, financial situation, and particular needs before making a commitment to trade, including seeking, under a separate engagement, as you deem fit.
You accept that you assume all risks in independently viewing the contents and selecting a chosen strategy.
Where the research is distributed in Singapore to a person who is not an Accredited Investor, Expert Investor or an Institutional Investor, Oanda Asia Pacific Pte Ltd (“OAP“) accepts legal responsibility for the contents of the report to such persons only to the extent required by law. Singapore customers should contact OAP at 6579 8289 for matters arising from, or in connection with, the information/research distributed.
Packages StationsPackages broke its previous high of Dec 20' last month. Now the immediate resistance it will face is around 650 which is the trendline resistance.
Then it will face resistance at 680 (Fib 0.618 level of all-time high).
Then 730 - 750 (another trendline resistance).
Then around 800 (Fib 0.786 level of all-time high).
Once it surpasses all these, it may touch its previous all-time high.

Johnson & Johnson | JNJ | Long at $146.00Johnson & Johnson NYSE:JNJ is strong (but highly controversial) company with anticipated earnings growth on the horizon. With a P/E of 23x, steady dividend growth record, low debt, and expected increased cashflow, the future is optimistic for NYSE:JNJ if they can stay out of the shady spotlight...
While the historical simple moving average I've selected suggests the stock is entering a downtrend on the daily chart, I'm going to go against this given the current price/position it is in. If the price can hold in $140's and then move up, there could be an early cup formation here. However, if the price drops below $140, that idea is out, and the near-term downtrend may be on. But the company, overall, is a personal buy-and-hold for the long-term ups and downs (unless new news points the company in a different direction). Thus, at $146.00, NYSE:JNJ is in a personal buy-zone.
Target #1 = $157.00
Target #2 = $165.00
Target #3 = $170.00+

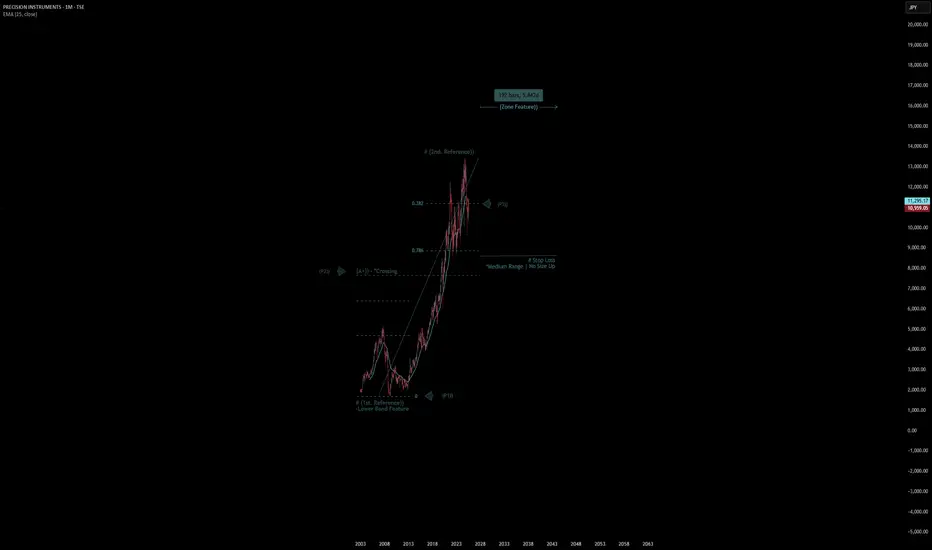
Precision Instruments - Quote | Chart & Forecast SummaryKey Indicators On Trade Set Up In General
1. Push Set Up
2. Range Set Up
3. Break & Retest Set Up
Notes On Session
# Precision Instruments - Quote
- Double Formation
* # (1st. Reference)) - *Lower Band Feature | Subdivision 1
* (A+)) - *Crossing | Completed Survey
* 192 bars, 5.842d | Date Range Method - *(Uptrend Argument))
- Triple Formation
* (P1)) / (P2)) & (P3)) | Subdivision 2
* Weekly Time Frame | Trend Settings Condition | Subdivision 3
- (Hypothesis On Entry Bias)) | Indexed To 100
* Stop Loss Feature Varies Regarding To Main Entry And Can Occur Unevenly
- Position On A 1.5RR
* Stop Loss At 425.00 JPY
* Entry At 540.00 JPY
* Take Profit At 700.00 JPY
* (Uptrend Argument)) & No Pattern Confirmation
- Continuation Pattern | Not Valid
- Reversal Pattern | Not Valid
* Ongoing Entry & (Neutral Area))
Active Sessions On Relevant Range & Elemented Probabilities;
European-Session(Upwards) - East Coast-Session(Downwards) - Asian-Session(Ranging)
Conclusion | Trade Plan Execution & Risk Management On Demand;
Overall Consensus | Buy
BUY GBPUSD 5.8.2025Confluence order: BUY at M15
Type of order: Limit order
Reason:
- The current top is not touching anything, expected to rise to the sub-key of H1 above.
Note:
- Management of money carefully at the last bottom (1,33013)
Set up entry:
- Entry buy at 1,32790
- SL at 1,32597
- TP1: 1,33013 (~1R)
- TP2: 1,33411 (~3,5R)
Trading Method: Price action (No indicator, only trend and candles)

TRBUSDT at Major Decision Point: Breakout or Breakdown Ahead?Yello Paradisers! Is TRBUSDT quietly setting up for a bullish breakout, or is it luring in early buyers before a harsh reversal? With price action unfolding near a key support zone, hidden bullish divergence forming, and the structure still technically intact, it’s time we pay close attention before making any decisions.
💎Currently, TRBUSDT remains in a bullish market structure and is trading near an important support area. Price action is also following a well-defined resistance trendline, which continues to limit upside moves. The presence of hidden bullish divergence suggests potential underlying strength, and this area could act as a springboard for the next move up. However, the lack of volume and broader market indecision means this is a zone where both opportunity and risk are high.
💎Given this context, consolidation is very likely here. For more conservative traders, it would be wise to stay patient and let the structure play out before entering. This is not the time to rush into trades without confirmation. For more aggressive traders, there may be intraday opportunities around this support zone, particularly on lower timeframes, but this approach requires strict risk management. Beginners are strongly advised to avoid trading on lower timeframes at this stage, as the price action remains highly reactive and misleading moves can occur easily.
💎If the price builds a fresh bullish structure from this level, it would significantly increase the probability of continued upside. The current zone also offers favorable risk-to-reward potential, with setups delivering more than a 1:3 ratio. That said, if the price breaks down and closes candle below the defined invalidation zone, our bullish outlook becomes invalid. In that case, the best course of action would be to step aside and wait for a new structure to form, rather than trying to force entries in uncertain conditions.
🎖Strive for consistency, not quick profits. Treat the market as a businessman, not as a gambler. Stay focused on high-probability setups, protect your capital, and let the market come to you. That’s the only path to long-term success in this game.
MyCryptoParadise
iFeel the success🌴

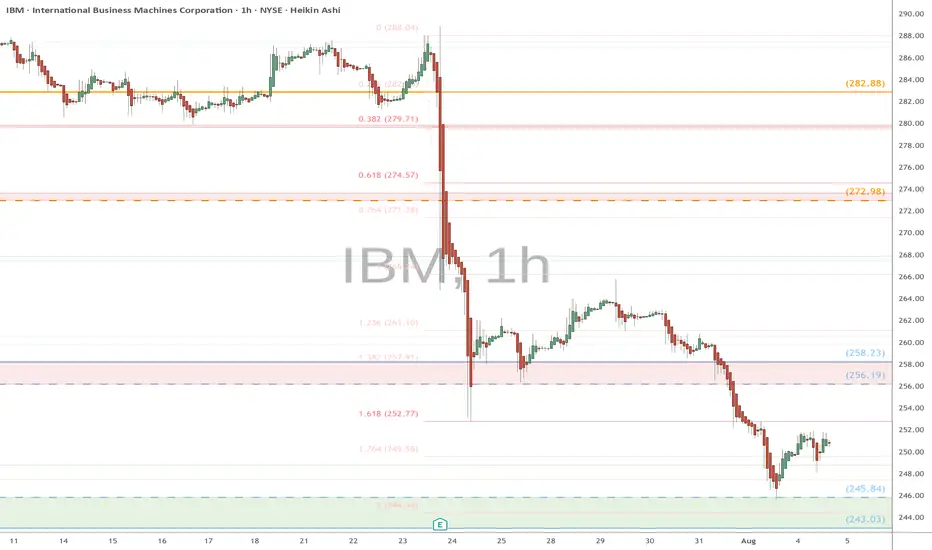
IBM eyes on $243-245: Serious Support zone should give a bounce IBM was dipping on earnings even before market swoon.
It has take a second leg down to support at $243.03-245.84
Should get a decent bounce, even if going lower afterwards.
.
See "Related Publications" for previous charts ----------->>>>>>>>>>
Such as this plot which caught the EXACT BOTTOM:
Hit BOOST and FOLLOW for more such PRECISE and TIMELY charts.
===========================================================
.