XLV SHORTMonthly chart - Head and shoulders pattern with a break below neckline and 200MA. Target for the pattern is around 118 looking to pick up long term shares there.
Support and Resistance

DeGRAM | GBPUSD fixed above the resistance level📊 Technical Analysis
● GBPUSD broke above 1.3425 resistance, confirming a breakout from the descending channel and maintaining higher lows within the current rising structure.
● Price action targets the 1.3575 resistance zone, with momentum supported by a clean breakout retest pattern.
💡 Fundamental Analysis
● Weak US ISM services PMI and softer dollar demand enhance GBP upside, while UK GDP beat expectations, signaling resilience in economic activity.
✨ Summary
Long above 1.3425; target 1.3575. Setup remains valid while price holds above 1.3310.
-------------------
Share your opinion in the comments and support the idea with a like. Thanks for your support!

GBPUSD SWING: SHORT OPPORTUNITYHi there,
Of all the USD pairs, I think GBPUSD is the weakest and I speculate lower prices.
At the very least, to hunt the equal lows the market created by not taking the previous low just before the monthly FVG. That action is suspect - it will induce buyers and drop more shorts on them.
Anyways, watch out for my next post.
Cheers,
Jabari

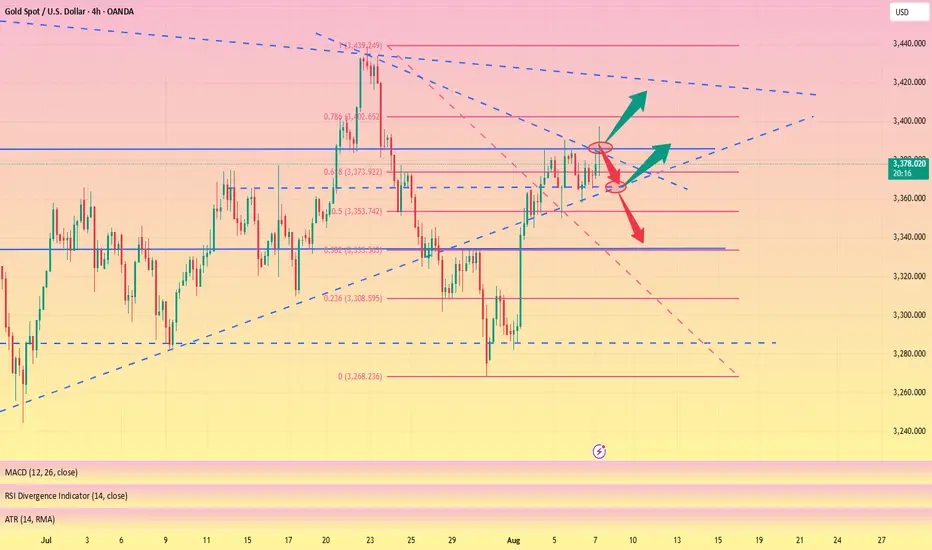
Opportunities only come to those who are preparedThe market expects the probability of the Federal Reserve cutting interest rates in September to be over 70%, with some institutions even predicting as high as 93.6%. Fed officials have recently released dovish remarks. If the rate cut is implemented, it will reduce the opportunity cost of holding gold, which is good for gold prices. The US has imposed tariffs on India and Switzerland, exacerbating global trade tensions and boosting demand for gold as a safe haven. The deadlock in the Iran nuclear talks and the shipping risks in the Red Sea have increased market risk aversion. Focus is on US initial jobless claims data and speeches by Fed officials. If the data is stronger than expected, it may suppress expectations of a rate cut and be bearish for gold. If the US dollar strengthens or geopolitical risks ease, gold prices may come under pressure and fall. Today, gold mainly showed a high-level fluctuation trend, hitting a high of $3397.25/oz in European trading before falling sharply. It is currently trading around $3382. Although gold prices are still in an upward channel, they have recently shown a high sideways trend. The market lacks unilateral driving factors. Gold can be shorted at high levels. It is recommended to short gold in batches around the highs of 3390-3405.

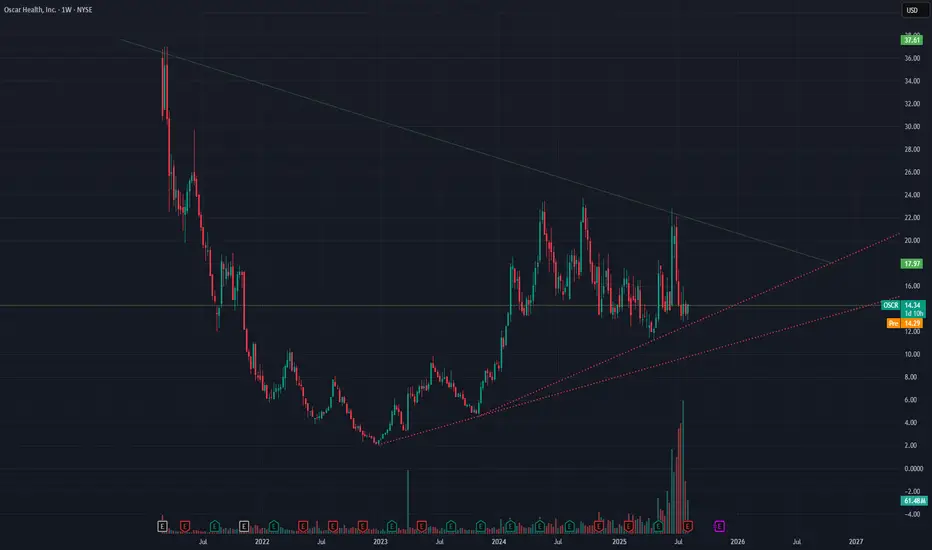
OSCR - When in Doubt, Zoom out.When in doubt, Zoom out. Here we are at the current low point of NYSE:OSCR . As long as this holds which hopefully will, as it holds alot of weight to it, we have only UP from here. Holding alot of Cash, maintaining & raising Guidance marginally are clearly good signs.
What we have to take into account is that the Healthcare Sector as a whole has negative Sentiment, this will eventually change soon. Once it breaks the Green Line, the next resistance is at 26-28.
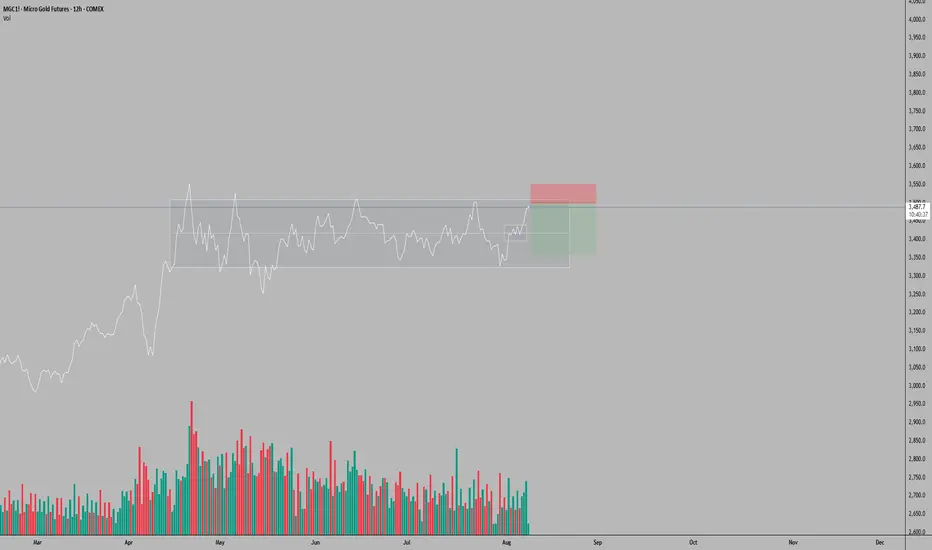
MGC (Micro Gold Futures) Trade Setup – 12H TimeframeOn the 12-hour timeframe, MGC has returned to the upper boundary of the horizontal range established since April 14, 2025. A surge in positive volume on August 7 was preceded by a sharp uptick beginning August 6, followed today by noticeably shallower volume—suggesting volume exhaustion and a potential pause or retracement.
Given today is Friday, profit-taking pressure may materialize following the rapid ascent that began with the breakout above the intermediate 3,400–3,440 zone on August 6. With no major macroeconomic events scheduled that could fuel further upside momentum, a pullback becomes a plausible scenario.
Illustrative Setup: A Sell Limit entry is considered around the 3,500 mark, with a Stop Loss at 3,550—matching the April 25 all-time high—and a Take Profit at 3,360, which aligns with intermediate support within the larger range. This setup offers a risk-reward ratio of approximately 2.8:1, assuming price reacts to overhead resistance and reverts toward the range’s mid-zone.
This analysis is provided solely for educational and entertainment purposes and does not constitute any form of financial or investment advice. Always manage your risk and trade responsibly.
DeGRAM | GBPUSD rebound from the support level📊 Technical Analysis
● GBPUSD rebounded from 1.3142 support with a strong bullish impulse and is consolidating above the reclaimed demand zone near 1.3277.
● Structure shows a potential bullish reversal from the lower bound of the descending channel, aiming for resistance near 1.3400.
💡 Fundamental Analysis
● Dovish Fed repricing after weaker US job additions and soft wage growth pulled yields lower, reducing USD strength.
● BoE's 25 bps hike and upward revisions in UK inflation forecasts reinforced GBP support across rate-sensitive pairs.
✨ Summary
Long above 1.3277. Target 1.3400 → 1.3585. Setup valid while price holds above 1.3142.
-------------------
Share your opinion in the comments and support the idea with a like. Thanks for your support!

DeGRAM | GOLD around the lower boundary of the channel📊 Technical Analysis
● XAUUSD bounced off the rising channel base at 3,280 and reclaimed the mid-range of the 3,294–3,435 consolidation zone, carving out a higher low pattern.
● The price is compressing into the descending resistance, with a break above 3,400 confirming upside extension toward 3,435 and 3,500.
💡 Fundamental Analysis
● Gold demand stays firm as investors hedge against US fiscal concerns after Fitch’s downgrade, while real yields ease on softer employment revisions.
✨ Summary
Buy above 3,310; break >3,400 targets 3,435 → 3,500. Setup invalid below 3,280.
-------------------
Share your opinion in the comments and support the idea with a like. Thanks for your support!

DeGRAM | DOGEUSD broke out of the descending wedge📊 Technical Analysis
● DOGEUSD rebounded from 0.2004 support, breaking the corrective trendline and resuming its climb within the rising channel structure.
● Price is now targeting the 0.2615 resistance, with momentum driven by a sustained series of higher lows and a breakout retest.
💡 Fundamental Analysis
● Broader crypto market gains following BTC’s push above $64k have lifted altcoin sentiment, while DOGE’s network activity rose after an uptick in whale transactions.
✨ Summary
Long above 0.2200; target 0.2615. Setup remains valid while price holds above 0.2004.
-------------------
Share your opinion in the comments and support the idea with a like. Thanks for your support!

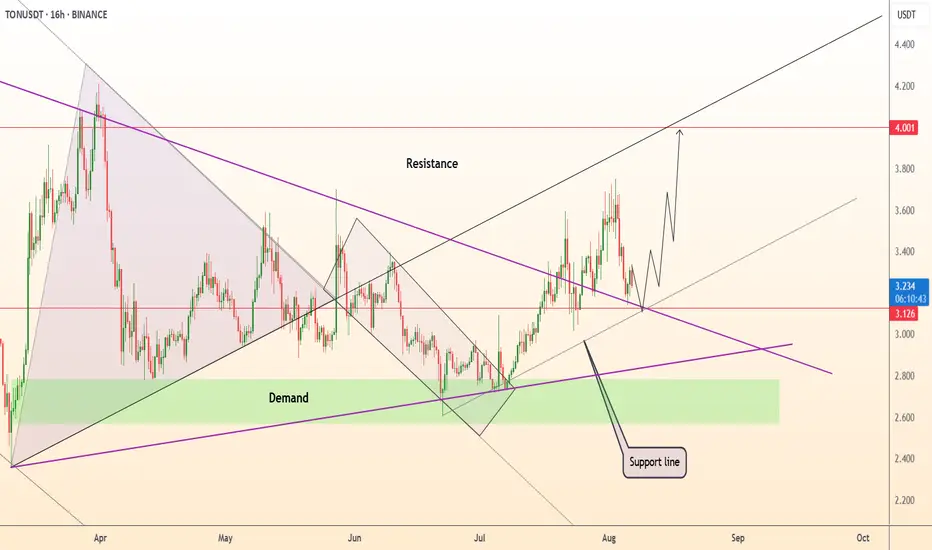
DeGRAM | TONUSD keeps the upward structure📊 Technical Analysis
● TONUSD is forming a higher-low retest on the broken wedge roof and mid-channel support near 3.12, preserving bullish structure after the impulsive breakout.
● Price action is now coiling within a continuation flag aimed at the upper resistance zone around 4.00, aligning with the rising black channel top.
💡 Fundamental Analysis
● TON surged in ecosystem activity after new DeFi integrations and strong Q3 developer funding signals long-term project scalability and increasing investor interest.
✨ Summary
Buy above 3.12; upside targets 3.60 → 4.00. Structure invalidates on a 16 h close below 2.95.
-------------------
Share your opinion in the comments and support the idea with a like. Thanks for your support!
US30 Bullish Bias Builds on Fed and Earnings OptimismUS30 – Market Overview
The market is showing bullish momentum, supported by recent developments from the Federal Reserve and a strong corporate earnings season.
Technically, the price action suggests a continuation of the uptrend toward 44610.
🔻 However, bearish momentum may be triggered if the price breaks below 44170.
🔹 Resistance: 44360, 44610 – 44820
🔹 Support: 44170 – 43960 – 43630

FLOKIUSDT near major daily support & pump hard after breakoutMajor resistances which stop the price from more pump now are 1.Red trendline 2.0.00020$ resistance zone and i think both can soon break and after that market would be extremely bullish after a while.
DISCLAIMER: ((trade based on your own decision))
<<press like👍 if you enjoy💚

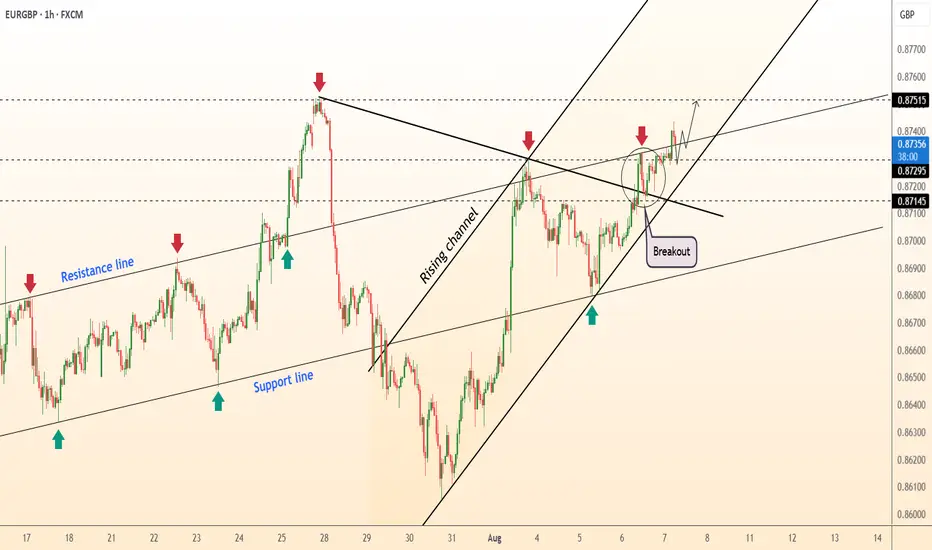
DeGRAM | EURGBP is testing the upper boundary of the channel📊 Technical Analysis
● EURGBP confirmed a breakout from both the wedge and prior descending trendline, now holding above 0.8720 and grinding along the rising intraday channel.
● Bullish continuation is supported by a double retest of the wedge top, with 0.8751 as the next upside target in line with the channel resistance.
💡 Fundamental Analysis
● GBP weakened after dovish BoE statement warning of economic stagnation, while the Euro gained from improved German factory orders and hawkish ECB commentary.
✨ Summary
Buy above 0.8720; breakout continuation eyes 0.8751. Bull bias void on a 1 h close below 0.8710.
-------------------
Share your opinion in the comments and support the idea with like. Thanks for your support!
EUR-NZD Local Long! Buy!
Hello,Traders!
EUR-NZD made a retest
Of the horizontal support
Level of 1.9540 from where
We are already seeing a
Local bullish rebound so
We will be expecting a
Further bullish move up
Buy!
Comment and subscribe to help us grow!
Check out other forecasts below too!
Disclosure: I am part of Trade Nation's Influencer program and receive a monthly fee for using their TradingView charts in my analysis.

The triangle pattern is about to break through and hit 3400#XAUUSD
Although the price of gold was too high last night due to the rise in risk aversion, the upward momentum weakened significantly in the evening, and it fluctuated sideways at a high level. Gold is currently consolidating within a triangle pattern, with a short-term price increase reaching the triangle's boundary. A break above 3385 could lead to significant intraday gains. Meanwhile, the downside is defending short-term support at 3365. As long as this support level remains intact, the bullish trend remains intact. If the European session gives an opportunity to fall back to the 3375-3365 support area without breaking, you can consider going long and look at 3395-3405, and if it breaks, look at 3415.
Let him cook after years of SleepYears of boring range and low profit pump which makes investors and holders sad and upset or even bored but no worries i find out these times are best times for adding some long to my personal wallet on that token lol.
.
so as i mentioned before soon it can start pump and after breaking that red trendline market here would be again exciting once again.
DISCLAIMER: ((trade based on your own decision))
<<press like👍 if you enjoy💚

Oil continues to decline due to geopolitics optimismOil continues to decline due to geopolitics optimism
A Kremlin official announced that Presidents Trump and Putin will hold a summit soon, their first since 2021, with a White House source suggesting it could occur as early as next week. Optimism surrounding potential U.S.-Russia discussions on the Ukraine conflict has alleviated concerns about oil supply disruptions, despite U.S. sanctions targeting India for its continued Russian crude imports. Trump introduced a 25% tariff on Indian goods and signaled possible additional tariffs on China. However, increased OPEC production and ongoing trade tensions remain key concerns, raising fears of slower economic growth and reduced demand.
Technically, USOIL trades just above the 6,300.00 support level. Insignificant rebound from this level is expected with possible decline towards crucial 6,000.00 support level.

NZDUSD to find sellers at current market price?NZDUSD - 24h expiry
The bearish engulfing candle on the weekly chart is negative for sentiment.
Daily signals are mildly bearish.
20 1day EMA is at 0.5956.
Offers ample risk/reward to sell at the market.
The sequence for trading is lower lows and highs.
We look to Sell at 0.5959 (stop at 0.5984)
Our profit targets will be 0.5885 and 0.5875
Resistance: 0.5967 / 0.5986 / 0.6000
Support: 0.5943 / 0.5920 / 0.5900
Risk Disclaimer
The trade ideas beyond this page are for informational purposes only and do not constitute investment advice or a solicitation to trade. This information is provided by Signal Centre, a third-party unaffiliated with OANDA, and is intended for general circulation only. OANDA does not guarantee the accuracy of this information and assumes no responsibilities for the information provided by the third party. The information does not take into account the specific investment objectives, financial situation, or particular needs of any particular person. You should take into account your specific investment objectives, financial situation, and particular needs before making a commitment to trade, including seeking, under a separate engagement, as you deem fit.
You accept that you assume all risks in independently viewing the contents and selecting a chosen strategy.
Where the research is distributed in Singapore to a person who is not an Accredited Investor, Expert Investor or an Institutional Investor, Oanda Asia Pacific Pte Ltd (“OAP“) accepts legal responsibility for the contents of the report to such persons only to the extent required by law. Singapore customers should contact OAP at 6579 8289 for matters arising from, or in connection with, the information/research distributed.

EURUSD - NEW BREAKOUT!Hello Traders!
The EURUSD price formed a rectangle pattern.
At the moment, the resistance level (1.15971 - 1.15830) is broken!
So, I expect a bullish move🚀
__________
TARGET: 1.17390🎯

PUMPUSDT Showing Strong Accumulation StructurePUMPUSDT is developing a compelling base formation, suggesting a possible imminent rally. Price is currently reacting within a key accumulation zone, where early positioning remains strategic. The structure hints at underlying strength, with momentum gradually shifting in favor of bulls.
If the current support zone holds, the setup favors a multi-leg rally. Immediate targets have been mapped for short-term profit-taking, while extended projections align with the final breakout objectives.
Plan: Accumulate within the marked zone and monitor price reaction closely. A break above the immediate neckline will validate continuation toward midterm and final targets.

Major trendline resistance is broken also retest completed One of the major resistances which was red trendline is now broken also retest is completed and market is ready to explode and pump to the upside if BINANCE:BTCUSDT hold strong.
major supports and resistances are also all mentioned on the chart.
First target is easy to hit now but for second one we need valid breakout to the upside near that(0.000017$) resistance zone for sure.
DISCLAIMER: ((trade based on your own decision))
<<press like👍 if you enjoy💚

US CRUDE OIL(WTI): Important Breakout📉USOIL has fallen and closed below a significant daily support level,
which has now become a strong resistance.
I anticipate a downward trend towards the support level at 60.76.

MEMEFI : Risky but goodHello friends🙌
✅Given the good growth we had, we are now in a correction phase, and given that the price has reached a good support area, we can buy one step, of course, with capital management. In case of further correction, the second step of purchase has also been determined, so make a second purchase, of course, with capital management.
✅We have also specified the targets for you.✅
🔥Follow us for more signals🔥
*Trade safely with us*
