AAPL ShortBroader Market Structure (AAPL 1H):
The overall market structure on this 1-hour chart has shifted from a consolidation phase into a clear bearish trend. A Change of Character (CHoCH) occurred at $224.88, marking the breakdown of a key higher low and signaling the end of the previous bullish phase. This was followed by a Break of Structure (BOS) at lower levels, confirming bearish continuation. The structure now favors lower highs and lower lows, indicating a bearish directional bias.
Supply and Demand Analysis:
The supply zone near $224–228 is strong, as price dropped sharply from this area after a brief consolidation, showing aggressive selling and validating it as a significant resistance. Buyers previously stepped in around $194–196, creating a well-respected demand zone; price rallied with conviction from this level in the past, making it a strong base where buyers are likely to be active again.
Price Action Within Marked Region:
Price recently exited the upper consolidation range and is now moving impulsively lower toward the marked demand zone around $194–196. The rejection from supply was swift, and candles within the marked area show sustained bearish momentum with minimal bullish interruption. There is a clear lack of buying interest mid-structure, implying that price may continue descending into the demand zone.
Current Trade Bias & Outlook:
The bias remains bearish, with price likely to test the $194–196 demand area. Expect a potential short-term bounce once that zone is tagged. However, if buyers fail to hold this level, further downside toward $172–174 becomes plausible. An invalidation of this bearish outlook would occur if price reclaims and holds above $208, breaking the recent lower high.
Momentum & Candlestick Behavior:
Momentum favors sellers—price is printing strong bearish candles with minimal wicks, indicating conviction. No significant reversal patterns (like bullish engulfing or hammer candles) are visible yet, which supports continuation lower in the short term.
Support and Resistance

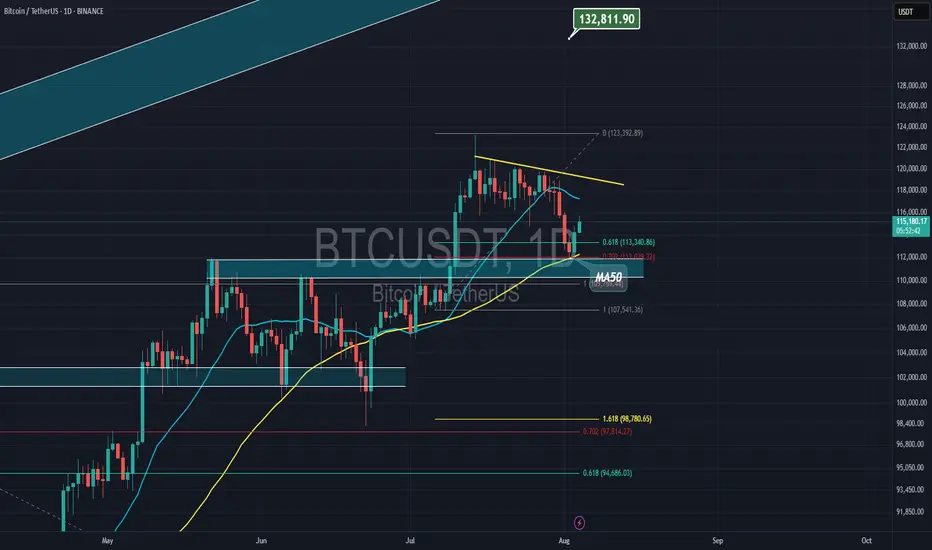
Bitcoin & strong supportBitcoin is holding above 50MA and 61% of Fibonacci, it also has bullish divergence on RSI with bullish engulfing candle. upside movement is coming soon
MAGIC : Magic is neededHello friends🙌
📈Given the good rise we had, the price is now in the ascending channel, now in the specified support areas, you can buy in steps with risk and capital management and move to the specified targets.
🔥Follow us for more signals🔥
*Trade safely with us*

From Fakeout to Takeoff: How the V-Pattern REALLY WorksEver seen a support level break, only for the price to rocket back up in a V-shape? That’s the V-Pattern in action! In this post, Skeptic from Skeptic Lab breaks down the step-by-step mechanics of this powerful setup. From the fakeout that traps short sellers to the surge of buy orders from liquidations, you’ll learn exactly how buyers flip the script and create explosive reversals. Perfect for traders looking to spot high-probability setups. Join me to decode the markets—check out the steps and level up your trading game!

GBP/USD Battle Lines Drawn Ahead of BoESterling broke below the yearly uptrend last week with the decline rebounding off the 2023 high-week close (HWC) / 38.2% retracement of the yearly range at 1.33092-1.3143.
Initial resistance now back at the 2024 high at 1.3434 with a breach above the 2025 HWC at 1.3648 needed to mark resumption of the broader uptrend.
A close below the median-line / 52-week moving average would be needed to suggest a more significant correction is underway towards the 1.618%extension at 1.2903 and 1.2745/73.
BoE is on Tap Thursday- watch the weekly close here.
-MB

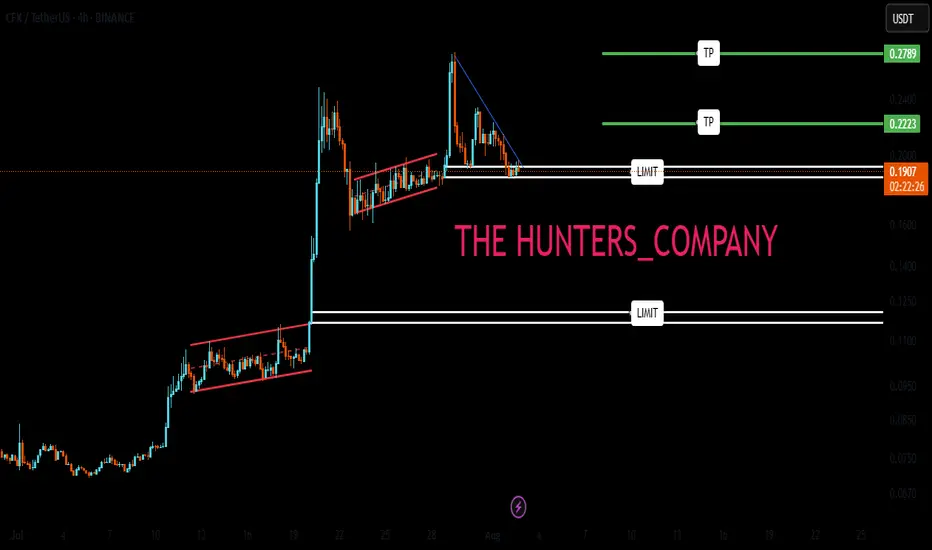
CFX : don't be afraidHello friends🙌
If you take risks, you will win. If you don't, you will regret it.
✅Given the good price growth, now that the price is in a correction phase, there is a good opportunity to buy with risk and capital management, of course, at the specified support levels and move with them to the set targets.
🔥Follow us for more signals🔥
*Trade safely with us*
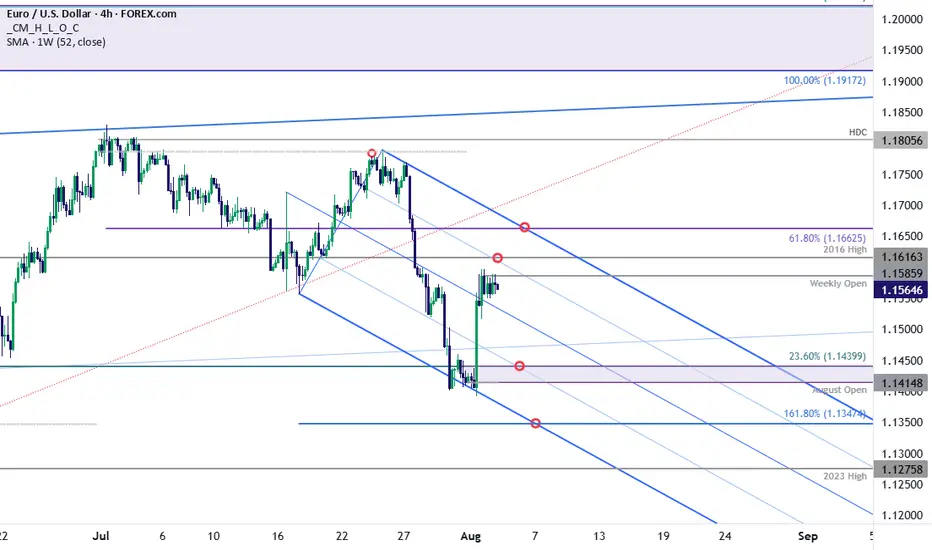
EUR/USD Recovery Testing July BreakdownEuro rebounded off downtrend support last week with the rally extending 1.8% off the monthly low. The focus is on this recovery with resistance objectives eyed at the 2016 high at 1.1616 and the 61.8% retracement of the July sell-off at 1.1662- rallies would need to be limited to this threshold IF price is heading lower on this stretch. A break / close below the monthly open / 23.6% retracement of the yearly range at 1.1415/40 is needed to mark downtrend resumption with subsequent support objective seen at 1.1347 and the 2023 high at 1.1275.
-MB
GBPJPY: trend in 4H timeframeThe color levels are very accurate levels of support and resistance in different time frames, and we have to wait for their reaction in these areas.
So, Please pay special attention to the very accurate trend, colored levels, and you must know that SETUP is very sensitive.
BEST,
MT

BTCUSDT Bearish Expect the resistance 120KBTCUSDT is currently showing signs of a bearish trend, aligning with our previous analysis. The price faced strong resistance near the 120,000 level, from where we expect a move toward the downside.
Technical Insight:
After the recent strong bullish momentum, Bitcoin may enter a corrective phase. This local correction could attract fresh interest from buyers at lower levels. Watch closely for any bounce or consolidation near the 110K 115K zone, which could act as a decision point for the next major move.
Note: A sustained break below 114K could accelerate the downside pressure towards 110K. Conversely, any recovery above 120K would invalidate this bearish scenario and suggest continued bullish strength.
You May find more details in the chart.
Ps: Support Growth like and comments for better analysis Thanks for Supporting.

GOLD Forming Bullish Pattern Read DescriptionGold is showing bullish momentum after a weaker-than-expected NFP report, which undermines the USD strength and increases demand for safe-haven assets like gold. With softer labor data, the market is now pricing in potential Fed rate cuts in the coming months, supporting upside pressure on gold.
Technical Analysis:
Price has respected the support zone and is now forming a bullish structure. If price holds above 3362, bullish momentum is expected to continue a Next targeting 3400 and 3419 – Strong resistance zone from recent highs
You May find more details in the chart.
Trade wisely best of luck Buddies.
Ps: Support with like and comments for better analysis.

SP500 reinforcing a bearish short-term trendThe S&P 500 retreated in the final session of July, weighed down by renewed tariff concerns and ongoing uncertainty surrounding the Fed’s next policy move. Despite the late pullback, the index remains positive for the month overall.
From a technical perspective, the index has declined approximately 2.5% since yesterday, reinforcing a bearish short-term trend. The bearish outlook remains valid as long as the price stays below 6220.
Immediate Support: 6220 – A break below this level could lead to further downside. Next Downside Target: 6150 – If the bearish momentum continues past 6220. if price closes above this, 6250 short-term bullish momentum may build. 6300 – A major resistance; a close above this would invalidate the current bearish outlook.
we have Some Tips about SO500 But Trading range is small Traders.
Ps; Support with like and comments for more analysis.

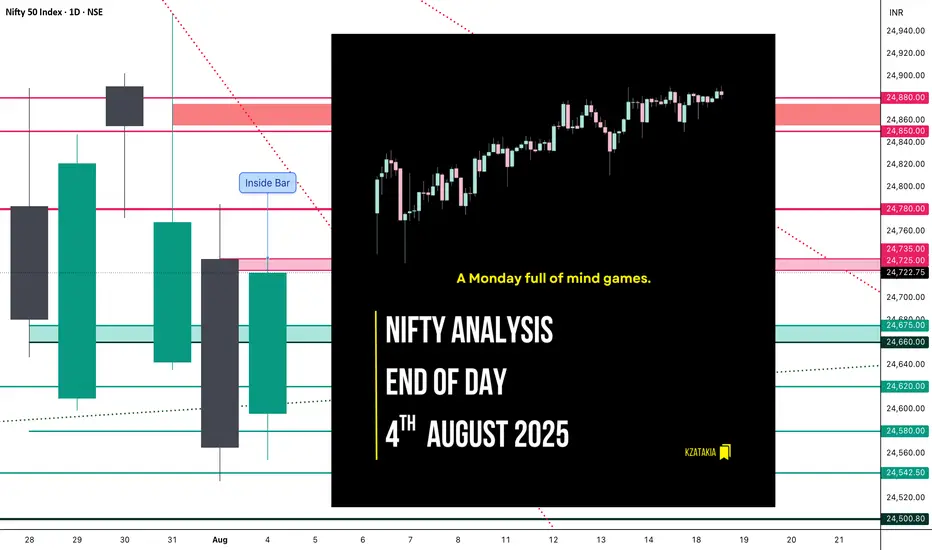
Nifty Analysis EOD – August 4, 2025 – Monday🟢 Nifty Analysis EOD – August 4, 2025 – Monday 🔴
A Monday full of mind games.
Nifty opened with a slight positive gap and immediately tested the TC of CPR, but that optimism didn’t last long — sharp rejection took it to day’s low (24,554). What followed was a rollercoaster: a 100-point recovery, a 50-point pullback — all within 10 minutes. This wild price action defined the rest of the day.
Throughout the session, Nifty remained trapped within the CPR zone. Both sides experienced multiple fakeouts, especially around initial balance (IB) zones. Even when prices nudged toward R1, repeated failed attempts to break above reflected the market’s indecisiveness. The day finally closed near the high, but conviction was still lacking.
Many option buyers likely struggled due to deceptive shadows and unexpected fractal breakouts. The entire price action stayed within Friday’s range — forming an Inside Bar structure on the daily chart. This suggests a potential range breakout trade tomorrow.
The market faced resistance near the Fibonacci 0.618–0.786 retracement of the prior fall — aligning with 24,740–24,780 zones. A close above 24,780 tomorrow could shift momentum back in the bulls’ favour. If not, bears still hold the upper ground.
📈 5 Min Time Frame Chart with Intraday Levels
📉 Daily Time Frame Chart with Intraday Levels
📊 Daily Candle Breakdown
Open: 24,596.05
High: 24,736.25
Low: 24,554.00
Close: 24,722.75
Change: +157.40 (+0.64%)
Candle Type:
🟢 Bullish Marubozu-like — reflects a strong control by buyers after early weakness.
Structure Breakdown:
Real Body: 126.70 pts (Bullish)
Upper Wick: 13.50 pts (Minor resistance near close)
Lower Wick: 42.05 pts (Early dip got bought aggressively)
Key Insight:
Closed near the high of the day — positive bias for tomorrow
Inside Bar formed – Expect a breakout trade
24,780+ closing will turn sentiment bullish
🛡 5 Min Intraday Chart
⚔️ Gladiator Strategy Update
ATR: 209.36
IB Range: 115.95 → Medium
Market Structure: Balanced
Trade Summary:
🕚 11:30 AM – Long Entry → SL Hit
🕛 12:30 PM – Long Entry → SL Hit
🕐 13:10 PM – Short Entry → SL Hit
Tough day — strategy got chopped in noise-heavy moves.
🔍 Support & Resistance Levels
Resistance Zones:
24,725 ~ 24,735
24,780 ~ 24,795
24,860 ~ 24,880
Support Zones:
24,675 ~ 24,660
24,620
24,542 ~ 24,535
24,500
24,470 ~ 24,460
💭 Final Thoughts
"Markets love to test your patience before they reward your conviction."
Today was a lesson in restraint — avoid overtrading when structure lacks clarity. Inside bar gives us a clean slate for tomorrow. Let price lead.
✏️ Disclaimer
This is just my personal viewpoint. Always consult your financial advisor before taking any action.
EurusdExpecting a change of structure on the 4hrs then I sell cause we hv price on a down trend on the 1d and 1w so after the change of structure on the 4hrs then a rejection candle on de 4h I will sell

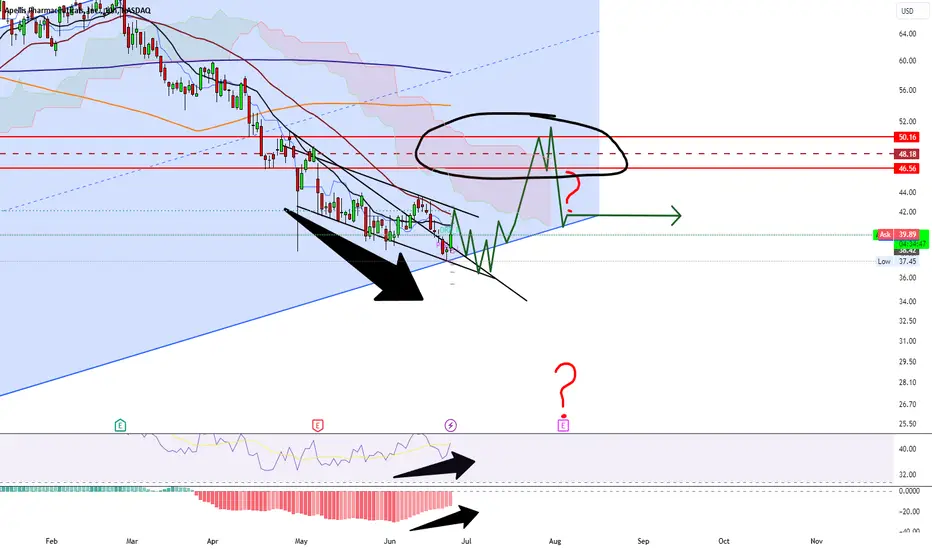
I keep finding all of these falling wedges lolPure call option short term pump.
This is at long term support and can make the turning point for either direction. I would play the move prior to earnings which I think will be a pump to the red resistance.
IF IT DOES hit my levels, be prepared for a rug pull at earnings for buy rumor and sell the news.
Potential 25% stock price gain from here.
Nzdusd We hv price on a down trend so we are expecting a retracment back to de zone and a change of structure on the 4h then I sell

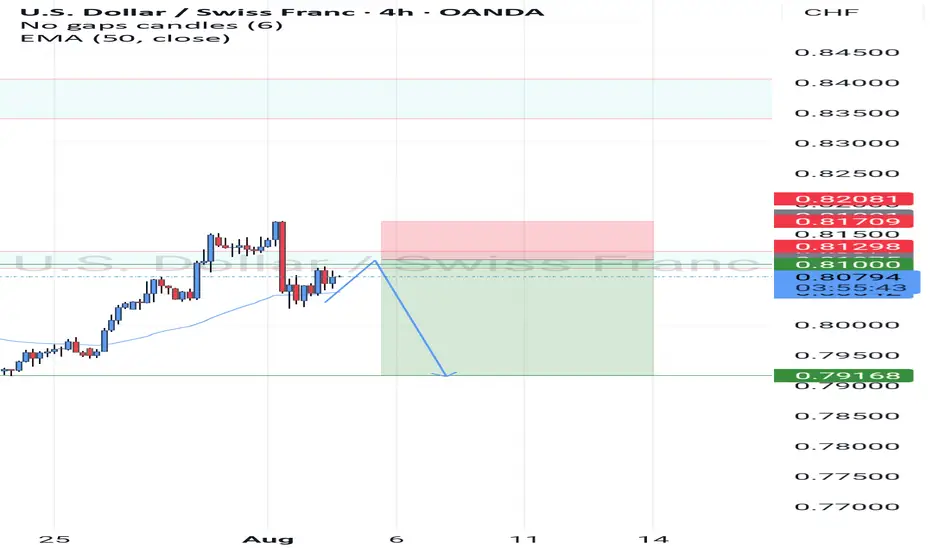
Usdchf As we can see we hv price creating more lower high and lower low so we are expecting a retracment and a change of structure on the 4h then we sell
Short Volatility during rare spikes using leveraged ETF $UVXYOverview
Volatility represents how greatly an asset’s prices swing around the mean price. Historically there are rarely brief volatility flare-ups that present trading opportunities. Trying to anticipate volatile events can be costly, because other market participants generally expect the same well known events, and one never knows how big a volatility spike might arise from a given event. Instead if one merely awaits extreme volatility events, which historically are ephemeral, there's a higher probability trade in shorting it. I've thought about this previously, and took the opportunity with Liberation Day to successfully short volatility.
Volatility Instrument Selection
Choosing an appropriate instrument can aid in the likelihood of a successful short position. Among the options CBOE:UVXY looks attractive for the trade, because it's a leveraged ETF, is highly liquid, and provides options with granular strike prices and expiration dates. Leveraged ETFs are known to decline over time due to
Daily rebalancing and compounding effects
Volatility drag
Cost of leverage
Management fees and expenses
Path dependency
These characteristics of leveraged ETFs provide a structural tailwind to a short position, because the instrument naturally declines over time. This phenomenon easy enough to see on a CBOE:UVXY weekly chart
Moreover selection of a liquid product is prudent. At the time of writing CBOE:UVXY has an average daily volume north of $22 million dollars for the past 30 days.
Trade execution
Execution of the trade starts with recognition of a highly volatile event, this is both technical and discretionary. From there a trader is advised to use their preferred tactics to select entry, stop-loss and exit points. Personally I like to use chart patterns across different timeframes in tandem with Relative Strength Index, and to a lesser extent volume to identify trading setups. I use longer term charts to identify a trend, and shorter timeframe charts to determine entry and exit points. The timeframe(s) depend on the particular instrument and what the charts look like at the time of the trade.
During the Liberation Day Volatility Short trade, I've been using 1W, 1D, 4H and 1H charts.
The 1H chart has been suitable for entering an exiting trades. Head & Shoulders patterns have manifested both on price and momentum alongside declining volume. I've posted a couple CBOE:UVXY minds along the way.
Additional Thoughts
Volatility can also be used generally to anticipate moves in other asset classes, such as stocks, bonds, crypto and commodities. Using the levels from that last chart fed into successful NASDAQ:TQQQ & NASDAQ:SQQQ trades in the aftermath of Liberation Day.

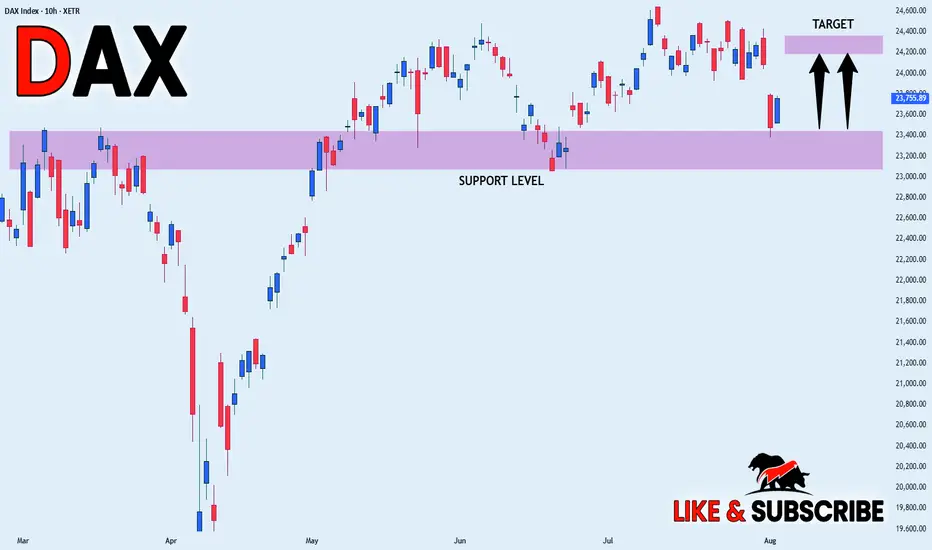
DAX WILL GROW|LONG|
✅DAX is trading in an
Uptrend and the index made
A bullish rebound from the
Horizontal support of 23,400
Which reinforces our bullish
Bias and we will be expecting
A further bullish move up
LONG🚀
✅Like and subscribe to never miss a new idea!✅
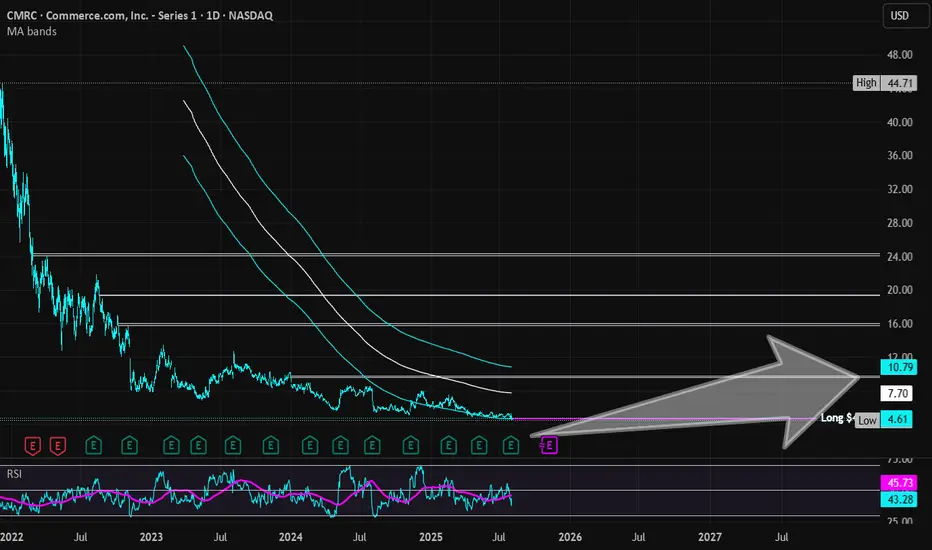
Commerce.com | CMRC | Long at $4.68BigCommerce recently rebranded to Commerce.com NASDAQ:CMRC . Full disclosure: I am an initial stockholder at $7.15, but grabbing more shares below $5 - average current holding is $5.68.
During the most recent earnings call for NASDAQ:CMRC , the company announced AI-driven partnerships with Google Cloud (Gemini) and PROS Holdings to enhance product discovery and pricing. They are now focused on "agentic commerce" (a new paradigm in online shopping where AI-powered agents autonomously handle the entire shopping process, from product discovery to purchase, on behalf of users) and B2B growth (Quick Start Accelerator program). The shift of this company focusing away from standard shopping experiences to new AI-powered ones is a major catalyst for me believing this company can grow significantly. Companies like NASDAQ:URBN , NYSE:TPR , NYSE:DELL , NYSE:VFC use NASDAQ:CMRC and others will surely hop on board if the AI shopping enhances consumer experiences.
However, the economy is VERY shaky right now and consumers are spending less. There is a chance the growth outlook for NASDAQ:CMRC (4.6% annual revenue growth through 2028) may not occur. Thus, this is a **highly speculative** investment. I would not be surprised if the economy flips and this tanks to near or below $1 in the near-term. With that in-mind, this is a long-term position build for me until targets are hit. If I have to hold for years, I am okay with that as long as the major fundamentals do not change. Those without thick skin should stay away...
From a technical analysis perspective, the price has entered and is riding my historical simple moving average area. This usually signifies the accumulation phase of a stock cycle and is what I will be doing - which is why I am adding shares at $4.68.
Targets into 2028:
$7.00 (+49.6%)
$9.50 (+103.0%)
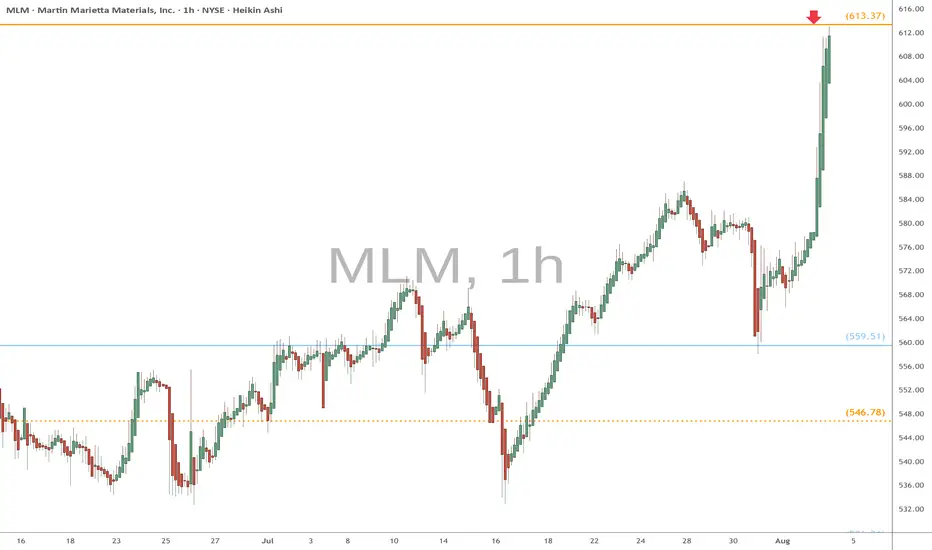
MLM heads up at $613.37: Golden Genesis fib may STOP the SurgeMLM had news of acquisition and a partnerhip.
It has just hit a Golden Genesis fib at $613.37
Look for a Dip-to-Fib or Break-n-Retest to join.
Previous Analysis that caught the BREAK OUT up to this fib:
Hit BOOST and FOLLOW for more such a PRECISE and TIMELY charts.
==========================================================
.
SMCI – Sell the Spike, Buy the Dip Again?With SMCI approaching a key resistance zone around $64, I'm preparing for a potential pullback. If the price fails to break through that level convincingly, we could see a healthy dip — which I’ll use to re-enter. This is a classic “sell high to buy lower” setup — let the market breathe, then strike.
🟢 Entry Points (Buy the Dip):
$49
$45
$40
🔴 Profit Targets:
✅ $55 – quick bounce zone
✅ $60 – key resistance
✅ $65+ – if momentum continues
📌 Let the chart come to you — don’t chase.
Disclaimer:
This analysis is for educational and informational purposes only and does not constitute financial advice. Always do your own research and evaluate your risk tolerance before making any investment decisions.

MTEC - Breakout Sideways MTEC - CURRENT PRICE : RM1.15
MTEC broke out nearest resistance RM1.14 and closed as solid bullish candlestick at RM1.15. The volume was higher than previous day indicating strong buying interest. This bullish momentum may propel the share price higher in the upcoming session.
ENTRY PRICE : RM1.15
TARGET : RM1.25
SUPPORT : RM1.08

US30 TRADE IDEA 4 AUGUST 2025The US30 (Dow Jones Industrial Average) is showing signs of a near-term bearish bias after breaking down from its rising daily channel and rejecting at the 44,700–45,100 supply zone, which coincides with a key former support level now acting as resistance. From a Smart Money Concepts perspective, this zone represents a recent order block where institutional selling pressure originated, making it a high-probability area to look for short entries if price retests with bearish confirmation, such as a daily bearish engulfing candle, a long rejection wick, or a clear lower-high formation. The first major downside target lies around 43,062, aligning with an intermediate demand zone, with an extended target toward 42,500, where deeper demand and prior consolidation converge. Stops should be placed above 45,150 to invalidate the bearish setup. Conversely, if price drops into the 42,800–43,000 demand zone and shows strong bullish reversal patterns, there is scope for a tactical countertrend long back toward 44,700–45,100, provided that geopolitical and macro conditions turn supportive. Fundamentally, the market remains caught between optimism over potential Federal Reserve rate cuts later this year and uncertainty stemming from the Fed’s cautious, data-dependent stance. Geopolitical risks—particularly heightened tensions in the Middle East and ongoing U.S.–China trade friction—are adding to volatility and could weigh on global risk sentiment, especially if oil prices spike and inflation concerns reemerge. These risks, combined with political uncertainty in the U.S., favor selling into rallies until there is a clear shift in macro direction. Key events to monitor include upcoming Fed communications, developments in Middle East conflicts, and any major U.S.–China trade headlines, all of which could either reinforce the short bias or trigger a sentiment-driven reversal. For now, the preferred approach is to sell into strength near the supply zone with defined risk, manage positions closely around the 43,000 demand area, and remain flexible to flip bias if price action and fundamentals align for a reversal.
