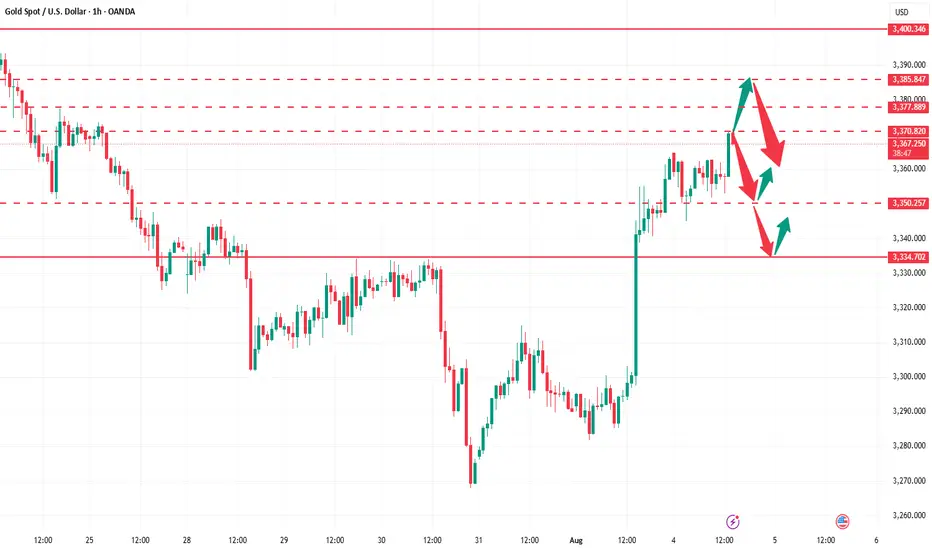
Why do you always miss the real opportunities?Judging from the current gold trend, gold rose to a high of around 3368 and then entered a narrow range of fluctuations. Our previous long plan failed to continue to hold at the high level. Although some brothers may feel regretful, the market is always full of variables. We must flexibly adjust our thinking according to market changes. At present, there is a need for a retracement on the technical side. This retracement is not a trend reversal, but provides space for subsequent bullish momentum. Overall, the bullish trend is still dominant, but the current price is approaching the important pressure area of 3370-3385. The short-term carrying capacity has weakened, and it is not advisable to chase highs blindly. It is recommended to be cautious at high levels in operations. In the short term, it can be given priority to try to intervene with short positions in batches in the 3370-3385 area, waiting for a technical correction. If it subsequently retraces to the key support area of 3350-3335 and stabilizes, you can consider the long position layout again and continue to participate in the main bull trend.
Gold operation suggestion: short in batches in the 3370-3385 area, with the target at 3355-3350. If it falls back to the 3350-3335 area and stabilizes, consider entering a long position at the right time.
Support and Resistance
HSBC eyes on $53.xx: Key Resistance to recovery of UpTrendHSBC looking quite strong compared to other banks.
Just poked through a key Resistance at $53.01-53.40
Strong break should retest highs above at $58.11-58.65
.
Previous Analysis that caught a long PERFECTLY
=================================================

Long-Term Spot Technical Analysis of INJ CoinWhen evaluating INJ coin for long-term spot investments, it is evident that the price continues its downward movement after being rejected from the daily resistance level at $16.33. If INJ fails to receive a strong buying reaction from the $13.16 support in the coming days, the downtrend is likely to persist.
Our preferred long-term spot entry zone lies between the $11.86 – $11.26 support range. If INJ retraces to the blue support zone marked on the chart, we intend to accumulate with a long-term target of $23.
As long as INJ continues to close daily candles above the $10 level, we will maintain our long-term spot positions. Should the price rebound from the $11.86 – $11.26 zone, our initial upside target will be $16.33.
Not Financial Advice (NFA).

XAUUSD:BUYThere is no need to worry about holding long orders mentioned last Friday. Gold prices continued to rise this week after a pullback. The price has risen to 3372. According to the research team of our swing trading analysis team, the bullish trend will continue.
Earlier I informed members that some buy orders were closed at high levels. At that time, the short-term high was around 3370. After closing the long orders, the price subsequently fell. This is the advantage of swing trading. You can use accurate trading signals to trade in batches in the short term, thereby creating opportunities for quick profits.
After the pullback, there is still good room for buying and opportunities.

WMB eyes on $61.xx: Significant Resistance should give a Dip-BuyWMB moving up nicely with energy stocks for AI.
Just hit a significant resistance at $61.14-61.26
Looking for a Dip-to-Fib or Break-n-Retest here.

THE KOG REPORT - NFP UPDATE 1H 1H:
This is the chart we used last week for the FOMC and NFP KOG Reports. From the chart we can see the low was captured for FOMC and NFP didn’t give us an undercut low. We’ve kept the potential target box from the Report and for now we’ll stick with it. Red box defence is active below at the 3340-5 level and the ideal target stands above in the oval as long as we remain above the 3340 bias level.
KOG’s bias for the week:
Bullish above 3340 with targets above 3370, 3373, 3379 and above that 3384
Bearish on break of 3340 with targets below 3330, 3320 and below that 3310
RED BOXES:
Break above 3365 for 3372, 3375, 3379, 3384 and 3390 in extension of the move
Break below 3350 for 3346, 3340, 3335 and 3330 in extension of the move
Please do support us by hitting the like button, leaving a comment, and giving us a follow. We’ve been doing this for a long time now providing traders with in-depth free analysis on Gold, so your likes and comments are very much appreciated.
As always, trade safe.
KOG

PII eyes on $59.27: Golden Genesis may give a Dip-to-Fib entryPII earnings report spiked it into Golden Genesis at $59.27
Looking for a dip to enter on the strength of earnings.
Golden Covid below at $56.59 or green zone around $54

GOLD (XAUUSD): Very Bullish SetupGold experienced strong bullish momentum on Friday, breaking above a minor daily resistance with a confirmed Change of Character (CHoCH), suggesting a potential continuation of bullish trend.
Retesting the broken structure, the price formed a rising triangle on an hourly timeframe, with a breakout of its neckline serving as a strong intraday bullish signal.
I anticipate that the bullish trend will persist, targeting 3400.

The next bull week gonna start soonWe had new ATH around 123K$ and market is now facing some correction and fall and i think soon we can expect end of this correction and also more gain this time will lead price to new ATH at least around 137K$.
it seems that red trendline is not broken yet and for confirmation of breakout we need price at least stay above 116K$ and close daily candle above there.
DISCLAIMER: ((trade based on your own decision))
<<press like👍 if you enjoy💚

The bull market here will continue if the price break 4K$ As we can see on chart two major resistances which are reason of killing BINANCE:ETHUSDT each time are the red trendline and also the 4K$ resistance zone and soon i believe ETH now has the power to break this resistances and start new high volume pump the targets like 5000$ and new ATH.
DISCLAIMER: ((trade based on your own decision))
<<press like👍 if you enjoy💚

DOGE kill all leverage players and now ready to rocketAbout 30% of dump is insane and huge amount even for the holders which where positive and happy about new market pump after years but this market specially the BINANCE:DOGEUSDT market makers are in another level of surprising us.
but soon i think we will see huge gain and pump here so get ready!!
DISCLAIMER: ((trade based on your own decision))
<<press like👍 if you enjoy💚

GOLD is simply targeting 3600$ in next month In next few weeks the gold can see more rise and pump and we are looking for at least +10% here and targets like 3600$ are not anymore long-term targets and with this tension of war and ... soon that rise and even more will surprise us on the chart.
DISCLAIMER: ((trade based on your own decision))
<<press like👍 if you enjoy💚

Gold (XAUUSD) – Waiting for Buy Opportunity Near Range SupportWe're currently inside a range and approaching its lower boundary.
There was a chance to go long a bit lower, but there’s still time — the highlighted zone looks like a solid area to consider longs.
We’re patiently waiting for price to enter the zone and give us a valid buy signal.
No rush. Let the market come to us

Good comeback candle by Nifty today. Nifty fought back against the Tariff odds today and gained 157.4 points. The combination of Friday's candle and today's candle are forming a Bullish Harami kind of pattern. Harami in Japanese means pregnant woman. Usually this is a Bullish pattern but it requires a follow up positive candle in its support. So if we get a positive candle tomorrow then we can consider Friday's low as a good temporary support.
Supports for Nifty currently remain at: 24482 (Important Trend line resistance), 24317, 24186 (Father line support on daily chart), The zone between 23932 (final support, below this level Bears can take total control of the index).
Resistances for Nifty currently remain at: 24802, 24906 (Mother line resistance on daily chart), 25007, 25249-25346 (Important trend line resistance zone, a closing above 25346 will give control of the index to Bulls).
Disclaimer: The above information is provided for educational purpose, analysis and paper trading only. Please don't treat this as a buy or sell recommendation for the stock or index. The Techno-Funda analysis is based on data that is more than 3 months old. Supports and Resistances are determined by historic past peaks and Valley in the chart. Many other indicators and patterns like EMA, RSI, MACD, Volumes, Fibonacci, parallel channel etc. use historic data which is 3 months or older cyclical points. There is no guarantee they will work in future as markets are highly volatile and swings in prices are also due to macro and micro factors based on actions taken by the company as well as region and global events. Equity investment is subject to risks. I or my clients or family members might have positions in the stocks that we mention in our educational posts. We will not be responsible for any Profit or loss that may occur due to any financial decision taken based on any data provided in this message. Do consult your investment advisor before taking any financial decisions. Stop losses should be an important part of any investment in equity.

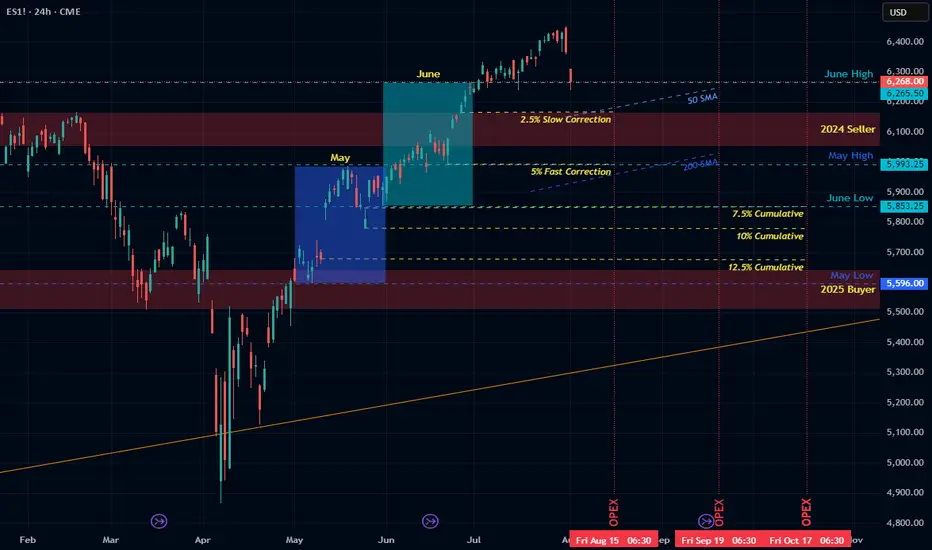
Path into Q3Outlook for the Next Few Months
• Now–August OpEx: -2.5% to -5% slow correction
• August–September OpEx: potential 5–7.5% additional decline
• By late Q3: cumulative 10–12.5% drawdown (target S&P ~5700).
• October: possible bounce — or acceleration if data worsens
• End of Year: risk of deep drop à la Oct–Dec 2018 if trends continue
Macro Backdrop
• Watch for margin compression, CPI surprise, and unemployment uptick
• Private data shows more fragility than government numbers
• QRA-driven liquidity tightening may amplify downside risk
Political Timing and Fed Policy
• Administration may welcome controlled decline to enable early 2026 rate cuts
• If market doesn’t decline soon, blow-off top/melt-up into midterms possible
JBM AutoJay Bharat Maruti Ltd. (currently trading at ₹85.65 is a leading auto component manufacturer and a key supplier to Maruti Suzuki India Ltd. The company specializes in sheet metal components, rear axle assemblies, fuel necks, and exhaust systems. It also designs and develops dies, moulds, and automotive machinery. As a joint venture between the Arya Group and Maruti Suzuki, JBML plays a critical role in India’s passenger vehicle supply chain.
Jay Bharat Maruti Ltd. – FY22–FY25 Snapshot
Sales – ₹2,078 Cr → ₹2,344 Cr → ₹2,292 Cr → ₹2,314 Cr Stable topline with cyclical volume shifts across OEM demand
Net Profit – ₹27 Cr → ₹37 Cr → ₹31 Cr → ₹50 Cr Earnings recovery driven by cost control and operating leverage
Operating Performance – Moderate → Moderate → Strong → Strong Margin improvement from process optimization and scale
Dividend Yield (%) – 0.83% → 0.90% → 0.92% → 0.95% Steady payouts aligned with cash flow visibility
Equity Capital – ₹22.00 Cr (constant) No dilution; stable capital structure
Total Debt – ₹370 Cr → ₹360 Cr → ₹345 Cr → ₹330 Cr Gradual deleveraging supported by internal accruals
Fixed Assets – ₹820 Cr → ₹845 Cr → ₹870 Cr → ₹895 Cr Capex focused on automation and tooling upgrades
Institutional Interest & Ownership Trends
Promoter holding stands at 73.52%, indicating strong strategic control. FII and DII interest remains moderate, typical of auto ancillary mid-caps. Delivery volumes show accumulation by domestic funds aligned with auto recovery and OEM-linked growth.
Business Growth Verdict
Jay Bharat Maruti is stabilizing with improving margins and OEM visibility Debt levels are declining with consistent operating cash flows Capex remains focused on automation and tooling precision Dividend payouts reflect financial discipline and shareholder alignment
Management Con Call
Management highlighted strong order visibility from Maruti Suzuki’s new model launches. Focus remains on improving operational efficiency through robotic welding and die automation. Export potential is being explored through Tier-1 partnerships. FY26 outlook includes mid-single-digit revenue growth and margin expansion through cost rationalization and higher plant utilization.
Final Investment Verdict
Jay Bharat Maruti Ltd. offers a reliable auto ancillary story with deep OEM integration and operational resilience. Its improving profitability, strong promoter backing, and disciplined capital structure make it suitable for accumulation by investors seeking exposure to India’s passenger vehicle supply chain. The company’s automation-led capex and strategic alignment with Maruti Suzuki provide long-term growth visibility.

How long can the decline in US crude oil prices last?
💡Message Strategy
On Monday (August 4) during the Asia-Europe session, WTI fell for three consecutive days, with a drop of 1.16% today, trading around 66.55. OPEC+'s decision to increase production, coupled with geopolitical and economic policies, has jointly formed the expectation that oil prices will be "weak and volatile, dominated by downward pressure."
Short-Term: Increased Supply Drives Price Decline
OPEC+'s decision to increase production directly led to further declines in oil prices on Monday (Brent crude fell 0.28% to $69.23/barrel, and WTI fell 0.46% to $67.01/barrel), extending Friday's decline. Market expectations of oversupply reinforced bearish sentiment, particularly as the UAE's additional production increase (accounting for 2.4% of global demand) further amplified the signal of easing supply. However, India's announcement to continue purchasing Russian crude oil partially offset the impact, limiting the price decline and failing to shift the short-term downward trend.
Medium-Term: Supply-Demand and Policy Risks Intertwine
On the Supply Side: OPEC+'s production increase plan may be paused after September, as Goldman Sachs anticipates accelerated OECD inventory accumulation and fading seasonal demand support. However, if US shale oil production is forced to cut production at break-even points due to low oil prices, OPEC+ may adjust its strategy and even consider further releasing the remaining 1.66 million barrels/day of production capacity, which would continue to suppress oil prices.
Long-Term: Market Share Competition and Structural Overcapacity
OPEC+'s production increase strategy aims to reshape the global oil landscape by squeezing out high-cost producers, such as US shale oil, through low prices. Due to rising equipment costs driven by tariffs and low oil prices, US shale oil companies have cut capital expenditures, resulting in a decline in the number of active drilling rigs and a slowdown in production growth. This strategic game is likely to keep oil prices in a low range for a long time, with significant long-term downward pressure. Unity within OPEC+ and coordination between Saudi Arabia and the UAE will be key to policy implementation.
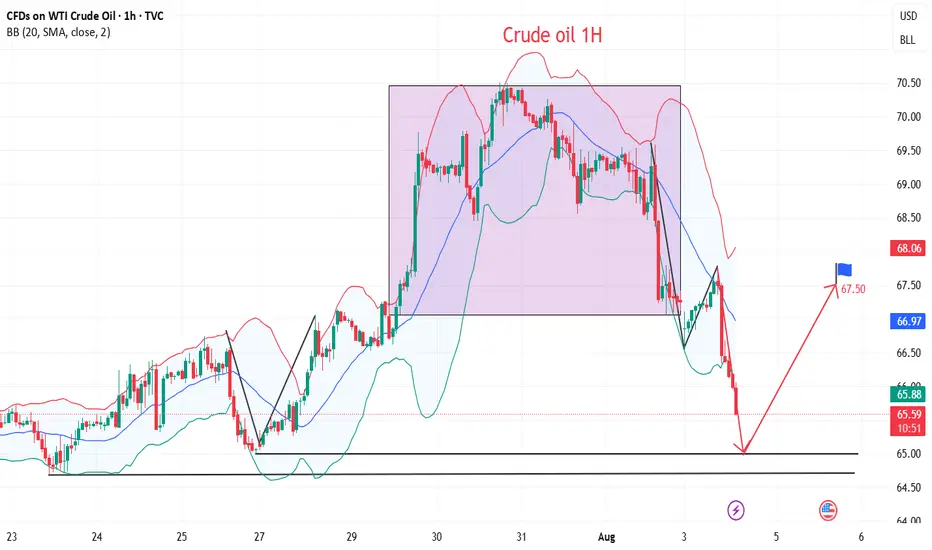
📊Technical aspects
Crude oil's short-term (1H) trend has reversed downward from its highs. The moving averages are diverging and aligning downward, indicating a downward trend in the short term.
The K-line chart has continued to close with small real bodies, and the MACD indicator is about to form a golden cross near the zero axis, signaling weakening downward momentum and a bullish bias on pullbacks. Crude oil is expected to remain weak and downward today, with a potential correction near $65.00.
ARKQ heads up at $83.xx: Proven Resistance break should RUN hardARKQ about to try a well proven resistance again.
Dual fibs mark the rejection zone $82.83-83.34
Looking for a Break-and-Retest for long entries.

USNAS100 Holds Bearish Below 23045USNAS100 – Overview
The index maintains a bearish momentum as long as it trades below the pivot zone between 22990 and 23045.
To confirm a bullish reversal, the price must break above 23045 and close a 1H candle above it.
On the downside, a break below 22875 would reinforce bearish pressure, opening the path toward the next support at 22720.
Support: 22875 • 22720
Resistance: 23150 • 23295
Bias:
🔻 Bearish below 23045
🔺 Bullish only with a confirmed 1H close above 23045

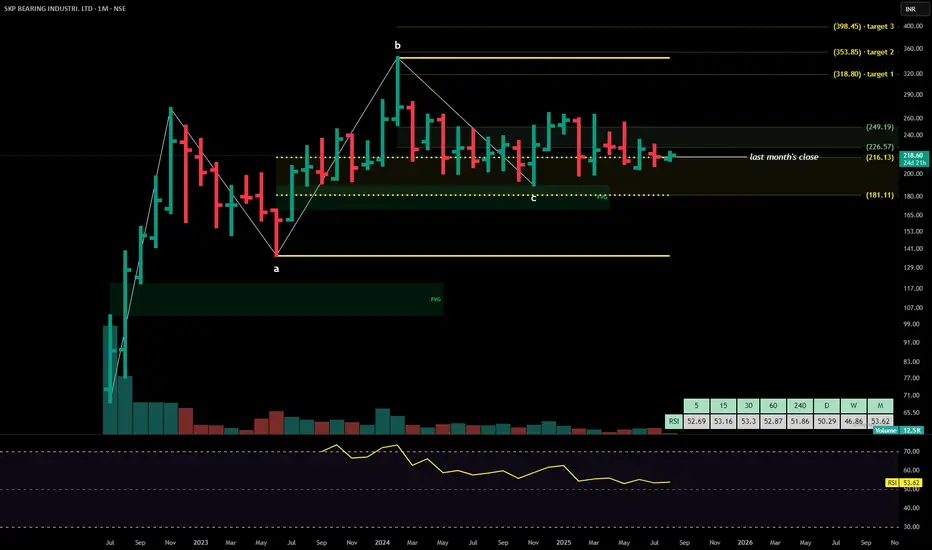
SKP BEARINGSSKP Bearing Industries Ltd.
is a precision rolling element manufacturer specializing in needle rollers, cylindrical rollers, pins, and steel balls. The company serves domestic and international OEMs across automotive, textile, and industrial sectors. With over three decades of experience and IATF-16949 certification, SKP has built a reputation for quality, customization, and reliability. It has also diversified into renewable energy through wind and solar power assets.
SKP Bearing Industries Ltd. – FY22–FY25 Snapshot
Sales – ₹51.66 Cr → ₹70.33 Cr → ₹78.50 Cr → ₹85.20 Cr Growth driven by export orders and OEM client expansion
Net Profit – ₹10.68 Cr → ₹2.97 Cr → ₹5.10 Cr → ₹7.25 Cr Volatility due to margin compression and capex absorption
Operating Performance – Strong → Moderate → Moderate → Strong Recovery expected as new capacity stabilizes
Dividend Yield (%) – 0.00% → 0.49% → 0.52% → 0.55% Modest payouts initiated post listing
Equity Capital – ₹16.60 Cr (constant) Stable post-IPO structure
Total Debt – ₹25.21 Cr → ₹28.90 Cr → ₹27.10 Cr → ₹25.50 Cr Controlled leverage with improving coverage
Fixed Assets – ₹32.32 Cr → ₹59.79 Cr → ₹63.50 Cr → ₹67.80 Cr Capex focused on automation and precision tooling
Institutional Interest & Ownership Trends
Promoter holding stands at 73.50%, indicating strong control and long-term commitment. Institutional interest remains limited due to SME listing, but HNI and PMS desks have shown interest post IPO. Delivery volumes reflect quiet accumulation aligned with industrial capex and export recovery themes.
Business Growth Verdict
SKP is expanding steadily across rolling element categories Margins are stabilizing post capex and input cost volatility Debt is manageable and aligned to growth Capex supports long-term scale and product diversification
Management Con Call
Management emphasized strong demand visibility from auto and industrial OEMs, especially in export markets. Recent capex is expected to enhance precision and throughput, with margin recovery projected in FY26. Renewable energy assets are contributing to captive power needs, reducing operational costs. Focus remains on expanding product range and entering new geographies with customized rolling solutions.
Final Investment Verdict
SKP Bearing Industries Ltd. offers a niche industrial manufacturing story with export potential and operational depth. While recent earnings have been volatile, the company’s capex cycle, promoter confidence, and product specialization position it well for long-term value creation. Suitable for staggered accumulation by investors seeking exposure to precision engineering and industrial components.
XAUUSD 30M Range Trap Holding, But Will Bulls Break Above $3366Gold is currently trading within a well defined intraday range, with clear resistance around $3,366.36 and support near $3,339.78. After a strong initial move, price action has stalled, reflecting indecision and balanced order flow between buyers and sellers.
The market now approaches a key inflection point:
→ A confirmed 30 minute candle close above $3,366.36 would signal potential bullish continuation, with immediate targets at $3,368.99 and $3,371.11
→ Conversely, a close below $3,339.78 may trigger a downside move toward $3,331.66, followed by $3,328.21
Momentum remains neutral within the range, and any premature entries carry increased risk of whipsaw. Patience is essential, a clean breakout with structure and volume confirmation will offer higher probability trade setups.
This remains a rangebound environment until proven otherwise. Breakout traders should stay alert, but disciplined.
#XAUUSD #Gold #TechnicalAnalysis #PriceAction #SupportResistance #BreakoutWatch #MarketStructure #30mChart

BTC Retrace RoadMap and 3 nearby supports worth watching NOWThis is a near-term followup to my big picture linked below.
Dip is underway after orbiting our Genesis Fib at 117.9k.
Quickly approaching the next three supports worth watching.
Supports get stronger below but each one needs to slow the dip.
$ 115,140 is a minor fib but possible end of dip wave.
$ 113,9xx is a double fib that should be pretty strong
$ 111,661 is the sister Genesis fib, and a MUST HOLD
.
Big Picture chart and why 117.9k was KEY
=======================================================
.

US 10-year yield threatening to breach key supportAfter Friday’s US jobs report, US Treasury yields fell across the curve. This caused the benchmark 10-year yield to retest the area below the 6M resistance level at 4.417% and settle at the 3M support from 4.211%. The mentioned support level has acted as a familiar floor since May this year. Therefore, a rejection of this base could refocus attention on 4.417% as an upside target, while a breakout might open the possibility for price to decline towards a 1Y support at 4.038%.
Written by the FP Markets Research Team
