US 10-year yield threatening to breach key supportAfter Friday’s US jobs report, US Treasury yields fell across the curve. This caused the benchmark 10-year yield to retest the area below the 6M resistance level at 4.417% and settle at the 3M support from 4.211%. The mentioned support level has acted as a familiar floor since May this year. Therefore, a rejection of this base could refocus attention on 4.417% as an upside target, while a breakout might open the possibility for price to decline towards a 1Y support at 4.038%.
Written by the FP Markets Research Team
Support and Resistance

GOLD (XAUUSD): Detailed Support & Resistance Analysis
Here is my fresh support & resistance analysis for Gold.
Vertical Structures
Vertical Resistance 1: Rising trend line
Horizontal Structures
Support 1: 3327 - 3344 area
Support 2: 3246 - 3275 area
Resistance 1: 3431 - 3451 area
The price is currently coiling on a trend line.
Your next bullish confirmation will be its breakout.
❤️Please, support my work with like, thank you!❤️
I am part of Trade Nation's Influencer program and receive a monthly fee for using their TradingView charts in my analysis.

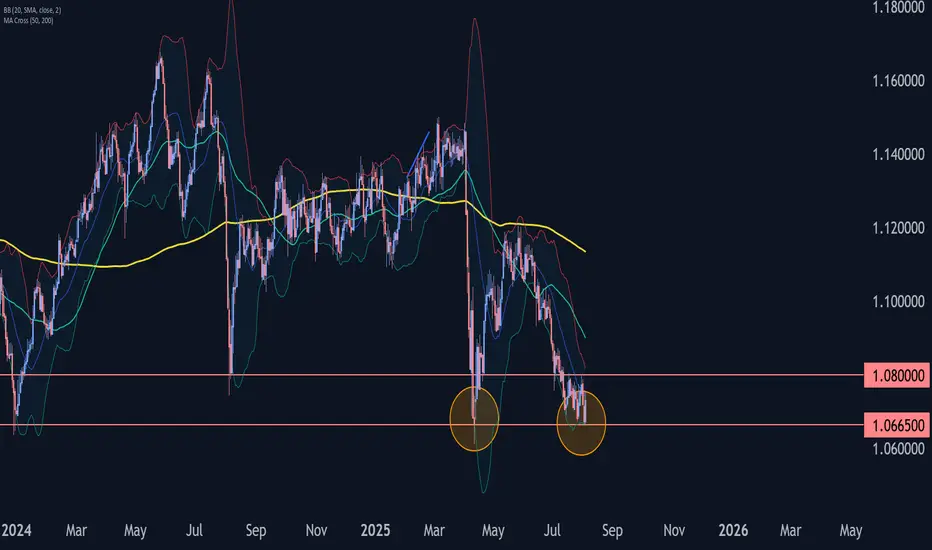
GBPCHF Wave Analysis – 4 August 2025
- GBPCHF reversed from key support level 1.0665
- Likely to rise to the resistance level 1.0800
GBPCHF currency pair recently reversed from the support zone between the pivotal support level 1.0665 (former strong support from April) and the lower daily Bollinger Band.
The upward reversal from this support zone will likely form the daily Japanese candlesticks reversal pattern Bullish Engulfing, if the pair closes today near the current levels.
Given the strength of the support level 1.0665 and the bullish divergence on the daily Stochastic, GBPCHF can be expected to rise to the next resistance level 1.0800 (which stopped earlier corrections (ii) and ii).
Silver Wave Analysis – 4 August 2025- Silver reversed from the support zone
- Likely to rise to the resistance level 39.45
Silver recently reversed from the support zone between the support level 36.20 (which also stopped wave ii at the start of July), lower daily Bollinger Band and the 38.2% Fibonacci correction of the upward impulse from May.
The upward reversal from this support zone created the daily Japanese candlesticks reversal pattern, Piercing Line – which marked the end of the earlier correction 2.
Given the clear daily uptrend, Silver can be expected to rise to the next resistance level at 39.45 (top of earlier impulse wave 1 from July).

AUDUSD Breakout and Potential RetraceHey Traders, in today's trading session we are monitoring AUDUSD for a buying opportunity around 0.64700 zone, AUDUSD was trading in a downtrend and successfully managed to break it out. Currently is in a correction phase in which it is approaching the retrace area at 0.64700 support and resistance zone.
Trade safe, Joe.

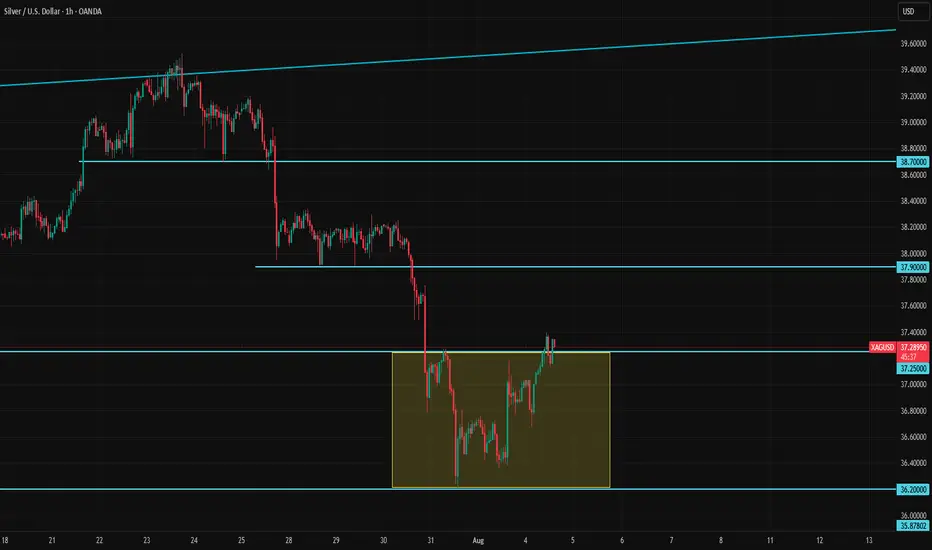
Silver Tries to Regain Lost Ground After the DipSilver has formed a solid bottom between 37.25 and 36.20 and is now attempting to break higher and recover some of its recent losses. There is some support from gold helping to push the price upward, but it remains unclear whether silver can hold above the 37.25 level long enough to take another step higher.
If it does, the price may return to the 37.90–38.30 zone, where it could stabilize and decide whether to move further up.
Below 37, however, the outlook becomes more cautious. A drop below this level could trigger additional selling pressure, so traders should be alert to downside risks if that support fails.
XAU/USD Approaches Resistance – Watch 3374 CloselyGOLD Overview
Gold is currently approaching the 3374 resistance level. A 1H candle close above 3374 could trigger further upside toward the next resistance zones at 3401 and 3402.
However, if the price fails to hold above 3365 and starts to decline, this would indicate a potential bearish reversal toward the support levels at 3350 and 3333.
The next short-term move will depend on how price reacts around the 3374 zone — watch for either a confirmed breakout or rejection.
🔹 Key Technical Levels:
Pivot Line: 3365
Resistance: 3374 • 3388 • 3402
Support: 3350 • 3333
Scenarios:
🔺 Bullish: 1H close above 3374 → Targets: 3388 / 3402
🔻 Bearish: Failure to hold above 3365 → Downside toward 3350 / 3333

Maintain the bullish theme and go long on pullbacks#XAUUSD
Gold fell to a low of around 3345 during the day and then rebounded rapidly. It is currently repeatedly testing the 3355-3353 line.👨💻
Although Federal Reserve Chairman Powell has not given clear instructions, the market is generally optimistic about the September interest rate cut. 📈The bullish sentiment in the market still exists, and the moving average continues to spread upward, laying a solid foundation for market bulls🐂
If gold cannot effectively fall below 3355-3353 during the European session, then gold is expected to rise again during the NY session. First, if the gold price breaks through the intraday short-term high of 3365,🚀 the gold price may reach a rebound of 61.8%, which is around 3373. 🎯
If the European session hits the resistance level of 3365 and is rejected,🙅♂️ it may trigger a small pullback to 3345-3340 to provide long trading opportunities.🐂 Once it falls below 3340, 🐻it is necessary to stop loss in time and pay attention to the first-line defense situation of 3333

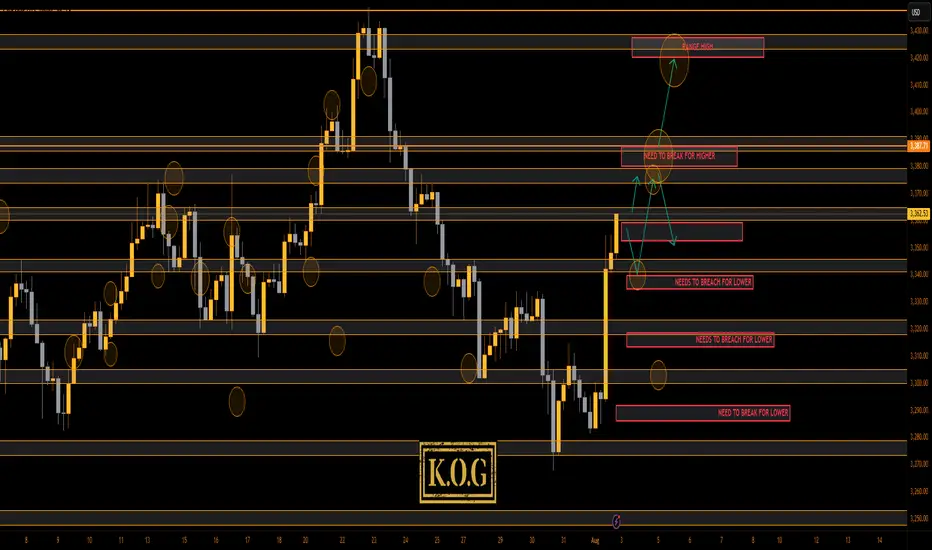
THE KOG REPORT THE KOG REPORT:
Due to there being no KOG Report last week so we won’t reference it, however, we did post the FOMC and NFP reports for the wider community to help them navigate the moves, which as you can see from the pinned ideas worked well.
So, what can we expect in the week ahead?
After the move we observed for NFP on Friday we would like to see some retracement in the sessions ahead. Looking at the 4H chart we have a reversal in play, but we still have no break out of this range! We’re simply playing the highs and the lows while price chops and whipsaws within it, which could be causing some new traders confusion and frustration.
We have a support level below 3350 and below that 3340 which will be the bias level for this week as bullish above. We then have the intra-day resistance level 3365-70 while there is an extension of the move into the 3385 level. Ideally, what we want to see here is support levels hold or a quick continuation on the open into the higher red box levels and the a potential for a RIP. That RIP however is most likely going to be a scalp unless we come down and break below that 3345-50 level.
We want to see how this reacts at these higher levels and if we do get a break of the boxes, otherwise, there is a chance we see another curveball like we suggested a couple of weeks ago, and we correct this whole move back downside with the first hurdle being 3340-35 on the flip.
We’re going to keep it simple here for now and usual we’ll update during the week once we have a clearer understanding of whether this wants to attempt a new all time high or not.
Please note, our liquidity indicator is suggesting a little higher but a pullback is on the way.
We’ll keep you updated.
KOG’s bias for the week:
Bullish above 3340 with targets above 3370, 3373, 3379 and above that 3384
Bearish on break of 3340 with targets below 3330, 3320 and below that 3310
RED BOXES:
Break above 3365 for 3372, 3375, 3379, 3384 and 3390 in extension of the move
Break below 3350 for 3346, 3340, 3335 and 3330 in extension of the move
Please do support us by hitting the like button, leaving a comment, and giving us a follow. We’ve been doing this for a long time now providing traders with in-depth free analysis on Gold, so your likes and comments are very much appreciated.
As always, trade safe.
KOG
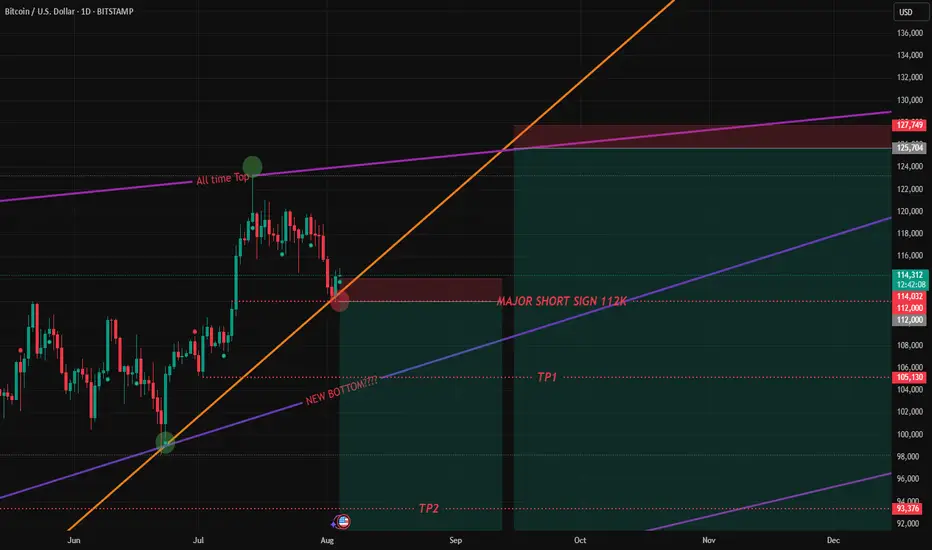
BTC over viewOn BTC 1D chart, we can easily see things started when WW3 news related hovering around. Shows on chart is the most likely SHORT scenario with all major marks. If Btc keep pumping up to 116k, I'll wait it until 125k (at the All time Top mark) to hit another Short on the list.
US30 Rejected Support at 43340 – Bearish Below 43960US30 – Overview
The price rejected perfectly from the projected support at 43340 and currently maintains a bearish momentum as long as it trades below the pivot level at 43960.
As long as the price remains under this level, we expect a move toward 43630, and a break below that may lead to a retest of 43340.
However, a 4H candle close above 43960 would shift the outlook to bullish, with upside potential toward 44170 and possibly 44360.
Support: 43630 • 43340
Resistance: 44170 • 44360
Bias:
🔻 Bearish below 43960
🔺 Bullish confirmation on 4H close above 43960

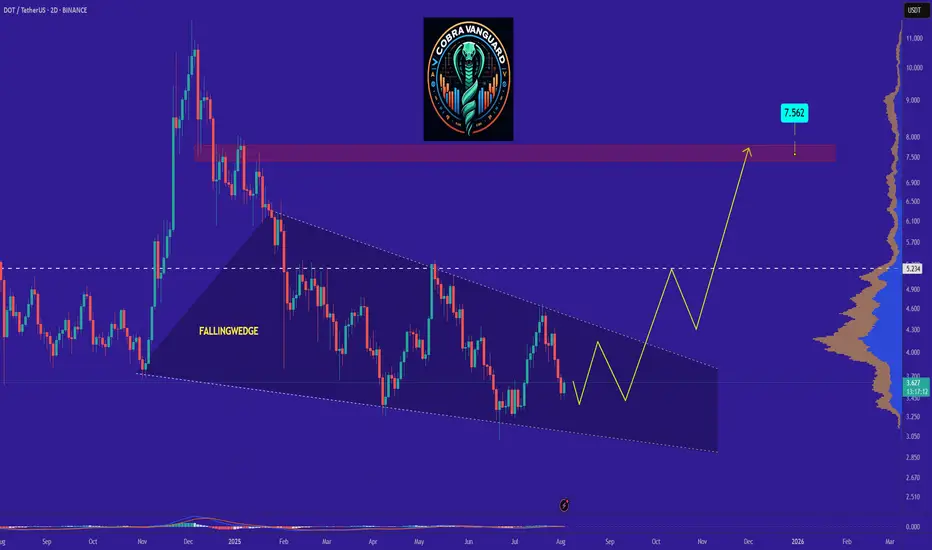
DOT is bullish now and many Traders don't see itSo if you pay attention to the DOT chart you can see that the price has formed a Ascending wedge which means it is expected to price move as equal as the measured price movement.( AB=CD )
NOTE: wait for break of the WEDGE .
Best regards CobraVanguard.💚
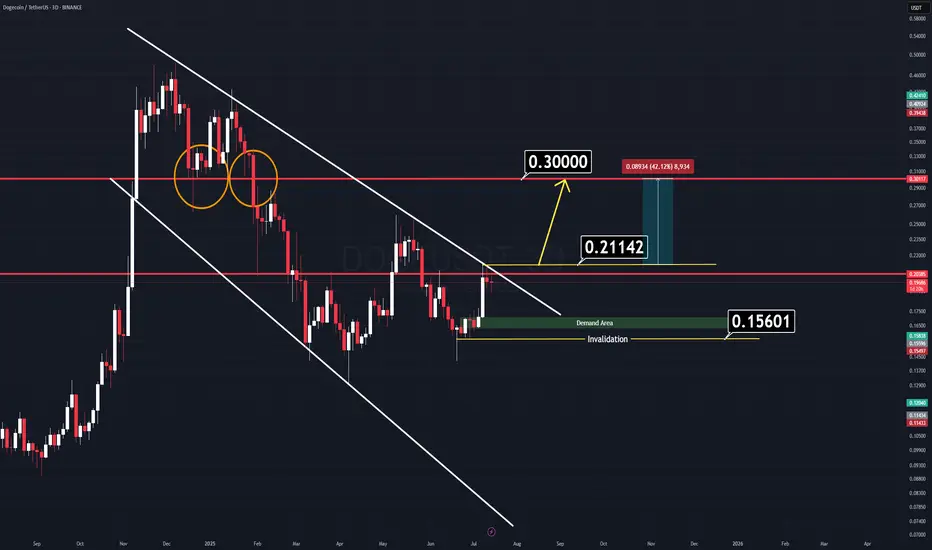
DOGE Analysis (3D)There’s a very simple and clear chart setup on Dogecoin (DOGE) right now.
We have two major horizontal key levels and a channel that is about to break down. If the price manages to close above the yellow-marked line ($0.21142), we can expect a strong rally to follow.
There’s no need for complicated indicators cluttering the screen — all relevant levels are clearly marked on the chart.
Two Logical Entry Approaches:
1️⃣ Breakout Entry: Enter on a confirmed breakout. (Waiting for a daily candle close on a memecoin might slightly reduce your profit range, but it’s the safer approach.)
2️⃣ Demand Zone Entry: Wait for the price to retrace to the green demand zone — though this scenario seems less likely for now.
A combined approach can work best: enter on breakout, use the horizontal levels as support, and set a tight stop-loss to manage risk.
Good Luck.
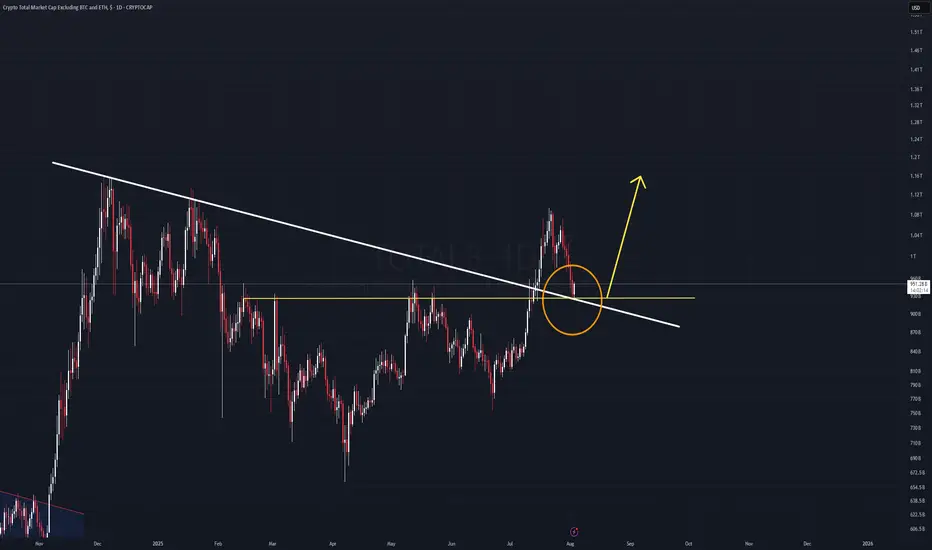
TOTAL 3 Analysis (1D)The TOTAL3 chart is currently retesting a key diagonal trendline that was broken previously. This is a classic bullish retest scenario.
If the current daily candle closes green, and is followed by a strong impulsive candle without invalidation, it could signal the start of a new leg upward, right from this zone.
The $900B market cap level remains the key support.
As long as TOTAL3 holds above this threshold, the bullish bias remains intact.
This structure could lead to momentum across the altcoin market.
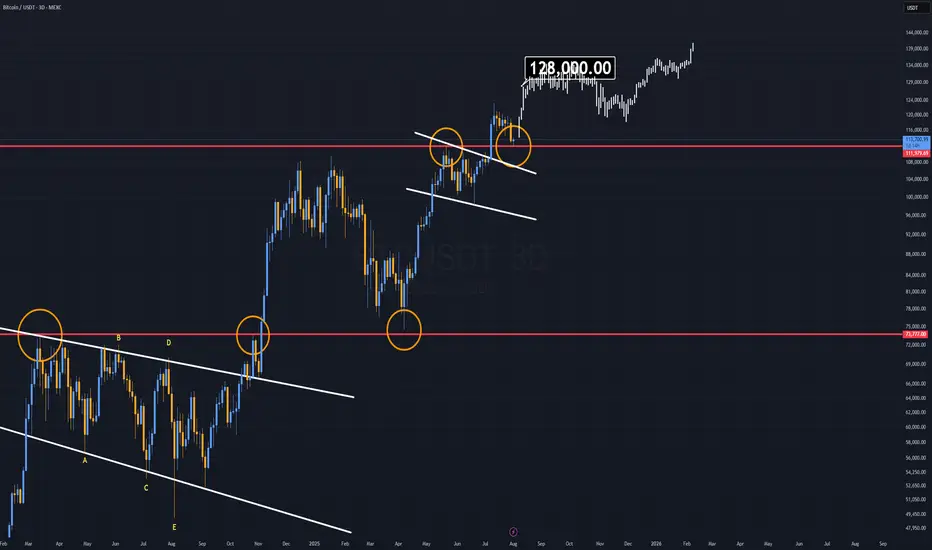
Bitcoin Analysis (3D)Bitcoin is currently trading in a very specific zone that resembles a classic bull flag continuation pattern, similar to the one we saw during last year’s rally.
Back then, a slow-forming bull flag broke to the upside, pushed to new all-time highs, and then retested the top of the same flag before continuing higher.
Now, we are witnessing a similar setup, but this time the formation has developed much faster.
The key difference:
While last year’s bull flag took a longer time to mature, the current one is more compressed, indicating a potentially sharper move if confirmed.
The $108K daily level is critical.
As long as Bitcoin remains above this level, the structure favors a new rally.
This could be the start of another impulsive leg, targeting the $128K Area.
LONG ON NZD/JPYNZD/JPY has given us a CHOC (change of character) on the lower timeframe after finding support.
I expect NJ to pullback to demand and then rise to the next level of supply for over 100 pips.

SPX500 Dips Ahead of NFP as Tariff Risks RiseSPX: S&P 500 Dips to Close July — Still Positive for the Month Amid Tariff Tensions & Fed Uncertainty
The S&P 500 retreated in the final session of July, weighed down by renewed tariff concerns and lingering uncertainty around the Fed’s next move. Despite the late pullback, the index remains positive for the month overall.
Looking ahead, non-farm payrolls (NFP) and U.S. jobs data are expected to have a strong impact on market direction. In addition, August 1st marks a key date for potential tariff developments, which could trigger further volatility.
Technical Outlook – SPX500
The index has dropped approximately 2.5% since yesterday and maintains a bearish bias as long as it trades below 6283. If the price continues to slide, the next downside target is 6246, with further support at 6223.
However, if the price manages to close above 6289 on the 1H timeframe, it could trigger a bullish recovery toward 6320 and 6341.
Pivot Line: 6283
Support Levels: 6246 • 6223
Resistance Levels: 6320 • 6341

STERLING FINANCIAL HOLDINGS COMPANY BULLISHRiding off the back of improving finances every quarter, strong governance and leadership structure in the bank, impressive and competitive digital products, and a record number of onboarded new-to-bank customers between April and June 2025, the handwriting is on the wall; this long-standing gold mine in the Nigerian financial market is about to produce the goods.
At a very undervalued price, the market looks poised to reach its previous high and even surpass it.
Technically, the structure looks set in a 1,2,3,4,5 Elliott motive wave structure.
Wave 3 could be on its way now. Great time to buy.

Testing $3,500 Support, Rebound Ahead?Instrument: ETHUSD
Timeframe: Daily
Date: August 4, 2025
Analysis:
ETH fell 7.9% to $3,500 from $3,800, testing support after failing to break its high. The hawkish FOMC and rising BTC.D (62%) pressured altcoins. I entered the dip on $3,500, as shared on X and my previous report
Chart Setup:
Support: $3,500
Resistance: $3,600, $3,800

BTCUSD: Consolidating at $112K, Watching $120KInstrument: BTCUSD
Timeframe: Daily
Date: August 4, 2025
Analysis:
BTC dropped to $112,000, down 5.1% from $118,000, holding above the $112,000 support. The hawkish FOMC triggered this pullback, but $112K is a key level. I scaled in on the dip as seen in my previous BTC idea and X
Chart Setup:
Support: $112,000, $100,000
Resistance: $115,000, $120,000

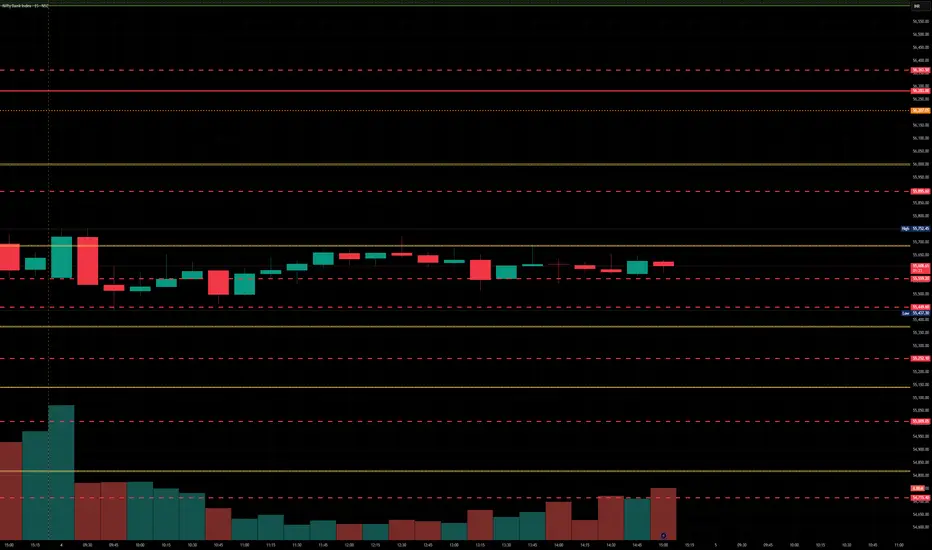
BankNifty levels - Aug 05, 2025Utilizing the support and resistance levels of BankNifty, along with the 5-minute timeframe candlesticks and VWAP, can enhance the precision of trade entries and exits on or near these levels. It is crucial to recognize that these levels are not static, and they undergo alterations as market dynamics evolve.
The dashed lines on the chart indicate the reaction levels, serving as additional points of significance. Furthermore, take note of the response at the levels of the High, Low, and Close values from the day prior.
We trust that this information proves valuable to you.
* If you found the idea appealing, kindly tap the Boost icon located below the chart. We encourage you to share your thoughts and comments regarding it.
Wishing you successful trading endeavors!
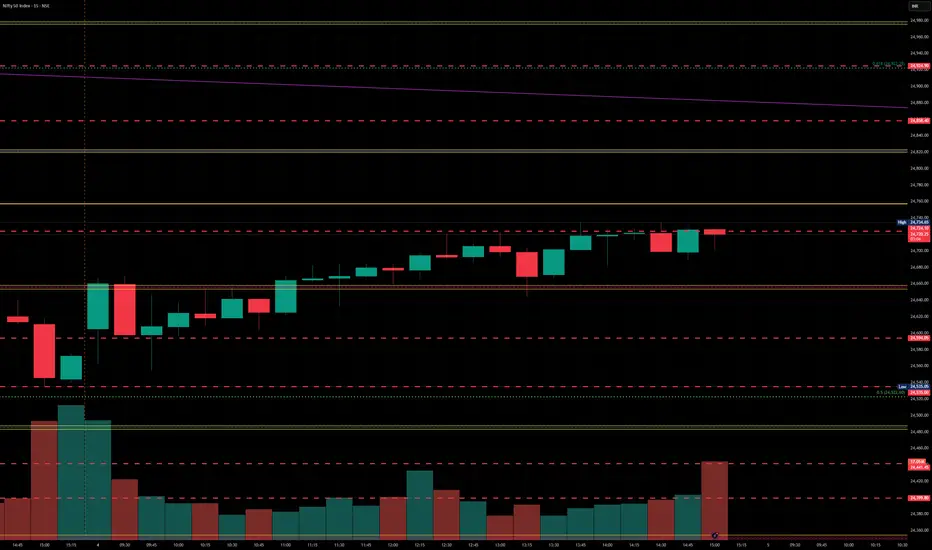
Nifty levels - Aug 05, 2025Nifty support and resistance levels are valuable tools for making informed trading decisions, specifically when combined with the analysis of 5-minute timeframe candlesticks and VWAP. By closely monitoring these levels and observing the price movements within this timeframe, traders can enhance the accuracy of their entry and exit points. It is important to bear in mind that support and resistance levels are not fixed, and they can change over time as market conditions evolve.
The dashed lines on the chart indicate the reaction levels, serving as additional points of significance to consider. Furthermore, take note of the response at the levels of the High, Low, and Close values from the day prior.
We hope you find this information beneficial in your trading endeavors.
* If you found the idea appealing, kindly tap the Boost icon located below the chart. We encourage you to share your thoughts and comments regarding it.
Wishing you success in your trading activities!