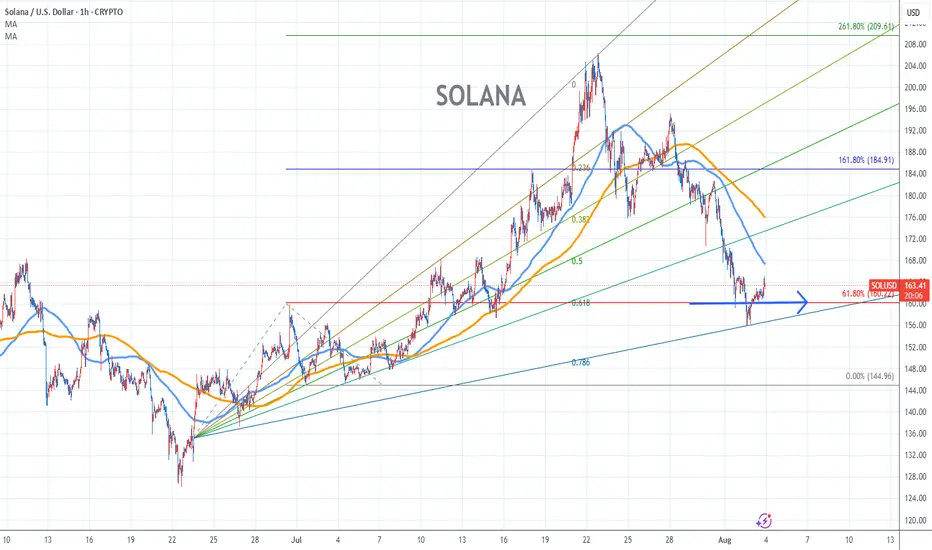
SOLANA Chart Fibonacci Analysis 080325Trading Idea
1) Find a FIBO slingshot
2) Check FIBO 61.80% level
3) Entry Point 160/61.80%
Chart time frame:B
A) 15 min(1W-3M)
B) 1 hr(3M-6M)
C) 4 hr(6M-1year)
D) 1 day(1-3years)
Stock progress:A
A) Keep rising over 61.80% resistance
B) 61.80% resistance
C) 61.80% support
D) Hit the bottom
E) Hit the top
Stocks rise as they rise from support and fall from resistance. Our goal is to find a low support point and enter. It can be referred to as buying at the pullback point. The pullback point can be found with a Fibonacci extension of 61.80%. This is a step to find entry level. 1) Find a triangle (Fibonacci Speed Fan Line) that connects the high (resistance) and low (support) points of the stock in progress, where it is continuously expressed as a Slingshot, 2) and create a Fibonacci extension level for the first rising wave from the start point of slingshot pattern.
When the current price goes over 61.80% level , that can be a good entry point, especially if the SMA 100 and 200 curves are gathered together at 61.80%, it is a very good entry point.
As a great help, tradingview provides these Fibonacci speed fan lines and extension levels with ease. So if you use the Fibonacci fan line, the extension level, and the SMA 100/200 curve well, you can find an entry point for the stock market. At least you have to enter at this low point to avoid trading failure, and if you are skilled at entering this low point, with fibonacci6180 technique, your reading skill to chart will be greatly improved.
If you want to do day trading, please set the time frame to 5 minutes or 15 minutes, and you will see many of the low point of rising stocks.
If want to prefer long term range trading, you can set the time frame to 1 hr or 1 day.
Support and Resistance
GBP/AUD SHORT 200 PIPS 1-10 RR🎯 1. Resistance at Trendline & Horizontal Zone
The price is touching a descending trendline (in yellow), coupled with a horizontal resistance zone (light-blue/boxed) just above.
This area acted as support earlier and now has flipped to resistance—classic supply–resistance confluence.
2. Structure Shift – Lower High Forming
The most recent swing high is lower than the previous peak, indicating weakening momentum and possible shift into a downtrend.
Market structure aligns in favor of sellers.
3. Trendline Rejection (Backtest)
The price attempted to breach the descending line but failed and pulled back below it.
Indicates lack of bullish conviction and a likely continuation downward.
4. Risk–Reward Zone
The red zone indicates your stop-loss placed just above the resistance zone/trendline confluence — a tight and logical level.
The large blue rectangle below represents your potential profit target — good R:R.
In essence, you're risking small for a larger reward.
5. Confirmation via Price Action
Notice the recent wick-up into resistance followed by bearish rejection (candles showing rejections).
This is a typical reversal signal at a strong confluence area.

XAUUSD – Bullish Reversal or Just a Deep Correction?Last week was a wild one for Gold.
After a quiet start and some choppy price action, the market dropped hard on Wednesday, breaking not only the 3300 key level but also the 3280 horizontal support — and what followed was anything but calm.
As expected after a strong move, the price pulled back to retest the broken support.
But Friday changed everything.
Instead of continuing down, Gold reversed sharply, fueled by weaker-than-expected NFP data. Price surged 800 pips from low to high, breaking above both the 3310 resistance zone and the weekly high around 3335.
________________________________________
🧭 Key Question:
Are we back in the bullish trend, or is this just a strong correction of the 3440 → 3270 drop?
Since May, Gold has lacked a clear trend — so a step-by-step trading approach is the most advisable to adopt.
________________________________________
🔍 Outlook:
Given the strength of the reversal and the break above two important resistance levels, my bias is bullish.
• 📌 Support: 3335 — a pullback into this zone could offer a buy opportunity in line with the recent momentum.
• 📌 Resistance: 3375 is the next key level to watch.
• ❌ Invalidation: A drop below 3310 would cancel the current bullish scenario.
🧠 Final Thoughts
Gold’s recent move challenges both bulls and bears.
Yes, the bounce was strong. Yes, key resistance levels broke.
But with no clear trend since May, chasing long term direction can be risky.
That’s why a step-by-step approach is the most advisable to adopt — let the market confirm each move before committing to the next.
For now, the breakout above 3310 and 3335 leans the bias to the upside.
However, staying reactive — not being stuck with an idea — is the smartest approach.
Disclosure: I am part of TradeNation's Influencer program and receive a monthly fee for using their TradingView charts in my analyses and educational articles.

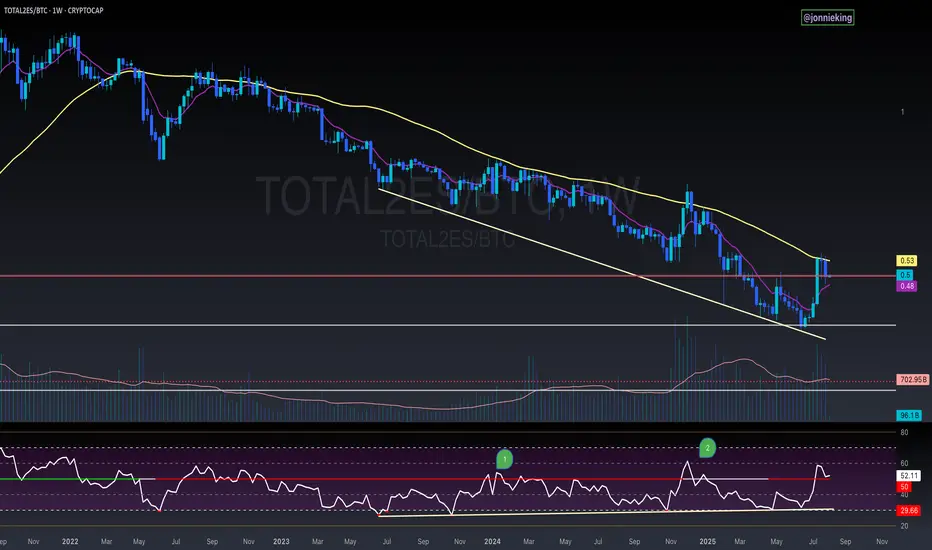
$TOTAL2ES/BTC Weekly Close AlertA bit concerning seeing CRYPTOCAP:TOTAL2 get rejected at the 50WMA and close below it for the 3rd consecutive week against CRYPTOCAP:BTC
Also flirting below the neckline breakout.
PA is still above the EMA9, which needs to hold to keep momentum.
Saving grace is the bullish divergence on the RSI.
GBPUSD Long1. Broader Market Structure
The overall trend currently shows a bearish bias. A clear Change of Character (CHoCH) occurred at 1.28790, where price broke below the previous higher low, signaling a potential shift in sentiment. This was confirmed by a Break of Structure (BOS) at 1.28257, where price broke through another significant support, confirming the downtrend continuation. These breaks suggest sellers are gaining control, and further downside movement is more likely unless key levels are reclaimed.
2. Supply and Demand Zones
There is a visible supply zone around the 1.28790–1.28257 region, where price previously dropped sharply—this indicates a strong supply area, as sellers overwhelmed buyers there. On the demand side, we observe zones forming near 1.27340 and lower around 1.26990. The reaction from 1.27340 has been relatively weak, with shallow bounces, implying limited buyer strength. If price drops into the 1.26990 area and buyers step in more aggressively, it may provide a firmer base for a reversal.
3. Price Action in Marked Region
Within the bordered area you highlighted, price is consolidating slightly below 1.278, failing to reclaim previous minor highs. It’s hovering below both the CHoCH and BOS levels, confirming seller pressure. The most likely scenario is a short-term retest of the broken structure around 1.282, potentially providing a better price for sellers to re-enter before continuation downward. However, if price fails to bounce and breaks below 1.27340, we should expect a deeper push into the lower demand zone at 1.26990.
4. Trade Bias, Direction, and Invalidation
The current trade bias is bearish, with expected continuation to the downside as long as price remains below 1.28257. The key invalidation level for this bearish outlook is a close above 1.28790, which would flip the structure back in favor of buyers and invalidate the bearish continuation.
5. Momentum and Candle Confirmation
Momentum favors sellers, with candles showing more aggressive pushes downward and smaller, hesitant pullbacks upward. No strong bullish engulfing or reversal patterns are currently visible, reinforcing the bearish pressure.

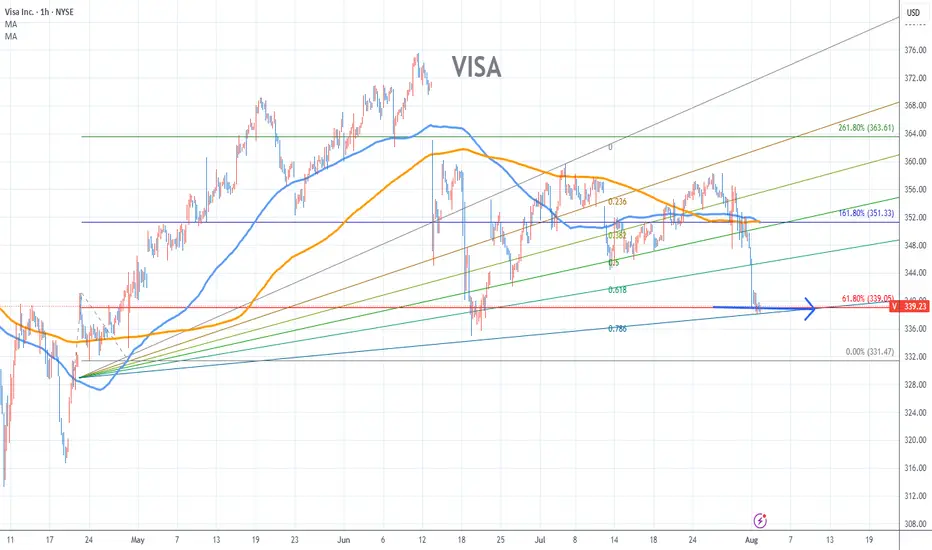
VISA Chart Fibonacci Analysis 080325Trading Idea
1) Find a FIBO slingshot
2) Check FIBO 61.80% level
3) Entry Point 339/61.80%
Chart time frame:B
A) 15 min(1W-3M)
B) 1 hr(3M-6M)
C) 4 hr(6M-1year)
D) 1 day(1-3years)
Stock progress:C
A) Keep rising over 61.80% resistance
B) 61.80% resistance
C) 61.80% support
D) Hit the bottom
E) Hit the top
Stocks rise as they rise from support and fall from resistance. Our goal is to find a low support point and enter. It can be referred to as buying at the pullback point. The pullback point can be found with a Fibonacci extension of 61.80%. This is a step to find entry level. 1) Find a triangle (Fibonacci Speed Fan Line) that connects the high (resistance) and low (support) points of the stock in progress, where it is continuously expressed as a Slingshot, 2) and create a Fibonacci extension level for the first rising wave from the start point of slingshot pattern.
When the current price goes over 61.80% level , that can be a good entry point, especially if the SMA 100 and 200 curves are gathered together at 61.80%, it is a very good entry point.
As a great help, tradingview provides these Fibonacci speed fan lines and extension levels with ease. So if you use the Fibonacci fan line, the extension level, and the SMA 100/200 curve well, you can find an entry point for the stock market. At least you have to enter at this low point to avoid trading failure, and if you are skilled at entering this low point, with fibonacci6180 technique, your reading skill to chart will be greatly improved.
If you want to do day trading, please set the time frame to 5 minutes or 15 minutes, and you will see many of the low point of rising stocks.
If want to prefer long term range trading, you can set the time frame to 1 hr or 1 day.
EURUSD LongOn the 15-minute EUR/USD chart, the broader market structure is bullish. A significant Change of Character (CHoCH) occurred around 1.15164, breaking prior bearish structure and indicating a shift in momentum. This was followed by a confirmed Break of Structure (BOS) at approximately 1.15959, confirming bullish continuation and establishing a new higher high.
Looking at the demand zones, we see a strong reaction from the 1.13915–1.14400 area, where buyers stepped in aggressively, initiating a powerful rally. This base is still valid and represents a high-probability area of interest. A secondary demand zone around 1.15100–1.15350 has also formed, and although price has revisited it once already, the reaction was controlled, suggesting buyers are still active there—though slightly weaker than the lower zone.
In the marked region, price is currently pulling back after failing to continue upward past a minor supply level near 1.15800–1.15950. It is retracing toward the local demand zone at 1.15100–1.15350, where we expect a potential bullish bounce. The price action shows a clean retracement with no aggressive selling yet, keeping the bullish bias intact.
Current trade bias is bullish, with the expectation of a continuation to the upside targeting the supply zone between 1.16500–1.17000. The key invalidation level for this bullish scenario would be a clean break and close below 1.15100, which would signal a deeper correction or reversal.
Momentum still favors buyers, given the strong initial impulse and lack of aggressive selling on the pullback. No strong reversal candlestick patterns are present yet, suggesting the retracement may still be developing.
There is no major financial news or macroeconomic catalyst at the moment to invalidate this technical setup. The chart favors a bounce from demand and continuation toward higher supply zones, assuming the key level holds.

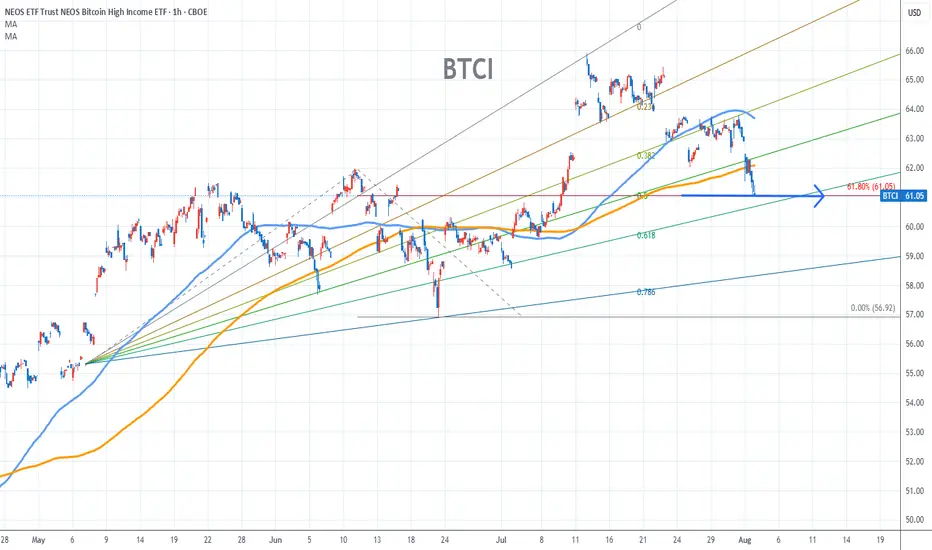
BTCI Chart Fibonacci Analysis 080325Trading Idea
1) Find a FIBO slingshot
2) Check FIBO 61.80% level
3) Entry Point 61/61.80%
Chart time frame:B
A) 15 min(1W-3M)
B) 1 hr(3M-6M)
C) 4 hr(6M-1year)
D) 1 day(1-3years)
Stock progress:C
A) Keep rising over 61.80% resistance
B) 61.80% resistance
C) 61.80% support
D) Hit the bottom
E) Hit the top
Stocks rise as they rise from support and fall from resistance. Our goal is to find a low support point and enter. It can be referred to as buying at the pullback point. The pullback point can be found with a Fibonacci extension of 61.80%. This is a step to find entry level. 1) Find a triangle (Fibonacci Speed Fan Line) that connects the high (resistance) and low (support) points of the stock in progress, where it is continuously expressed as a Slingshot, 2) and create a Fibonacci extension level for the first rising wave from the start point of slingshot pattern.
When the current price goes over 61.80% level , that can be a good entry point, especially if the SMA 100 and 200 curves are gathered together at 61.80%, it is a very good entry point.
As a great help, tradingview provides these Fibonacci speed fan lines and extension levels with ease. So if you use the Fibonacci fan line, the extension level, and the SMA 100/200 curve well, you can find an entry point for the stock market. At least you have to enter at this low point to avoid trading failure, and if you are skilled at entering this low point, with fibonacci6180 technique, your reading skill to chart will be greatly improved.
If you want to do day trading, please set the time frame to 5 minutes or 15 minutes, and you will see many of the low point of rising stocks.
If want to prefer long term range trading, you can set the time frame to 1 hr or 1 day.
8/1/25 - AMZN: new SELL mechanical trading signal.8/1/25 - AMZN: new SELL signal chosen by a rules based, mechanical trading system.
AMZN - SELL SHORT
Stop Loss @ 234.11
Entry SELL SHORT @ 214.75
Target Profit @ 181.53
Analysis:
Higher timeframe: Prices have stayed below the upper channel line of the ATR (Average True Range) Keltner Channel and reversed.
Higher timeframe: Victor Sperandeo's (Trader Vic) classic 1-2-3/2B SELL pattern...where the current highest top breakout price is less or only slightly peaking higher than the preceding top price.

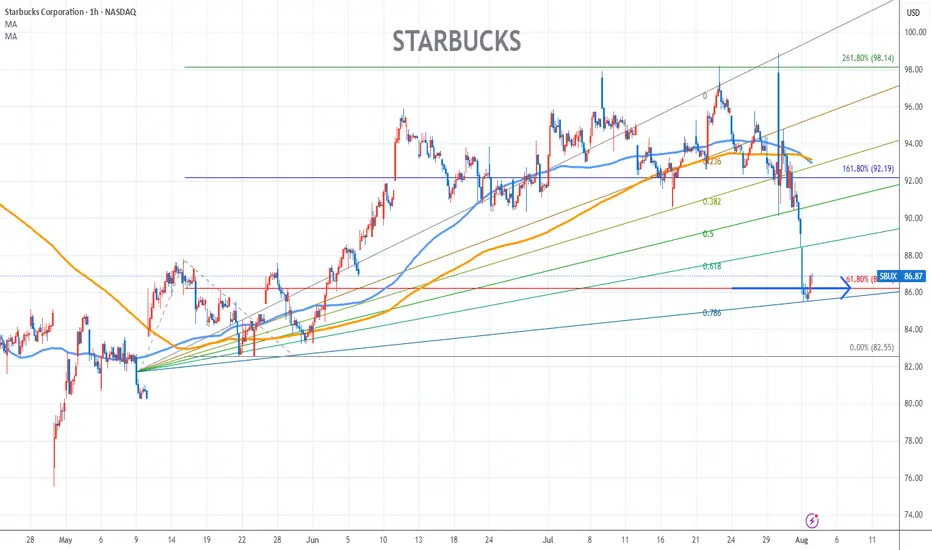
Starbucks Chart Fibonacci Analysis 080325Trading Idea
1) Find a FIBO slingshot
2) Check FIBO 61.80% level
3) Entry Point 86/61.80%
Chart time frame:B
A) 15 min(1W-3M)
B) 1 hr(3M-6M)
C) 4 hr(6M-1year)
D) 1 day(1-3years)
Stock progress:C
A) Keep rising over 61.80% resistance
B) 61.80% resistance
C) 61.80% support
D) Hit the bottom
E) Hit the top
Stocks rise as they rise from support and fall from resistance. Our goal is to find a low support point and enter. It can be referred to as buying at the pullback point. The pullback point can be found with a Fibonacci extension of 61.80%. This is a step to find entry level. 1) Find a triangle (Fibonacci Speed Fan Line) that connects the high (resistance) and low (support) points of the stock in progress, where it is continuously expressed as a Slingshot, 2) and create a Fibonacci extension level for the first rising wave from the start point of slingshot pattern.
When the current price goes over 61.80% level , that can be a good entry point, especially if the SMA 100 and 200 curves are gathered together at 61.80%, it is a very good entry point.
As a great help, tradingview provides these Fibonacci speed fan lines and extension levels with ease. So if you use the Fibonacci fan line, the extension level, and the SMA 100/200 curve well, you can find an entry point for the stock market. At least you have to enter at this low point to avoid trading failure, and if you are skilled at entering this low point, with fibonacci6180 technique, your reading skill to chart will be greatly improved.
If you want to do day trading, please set the time frame to 5 minutes or 15 minutes, and you will see many of the low point of rising stocks.
If want to prefer long term range trading, you can set the time frame to 1 hr or 1 day.
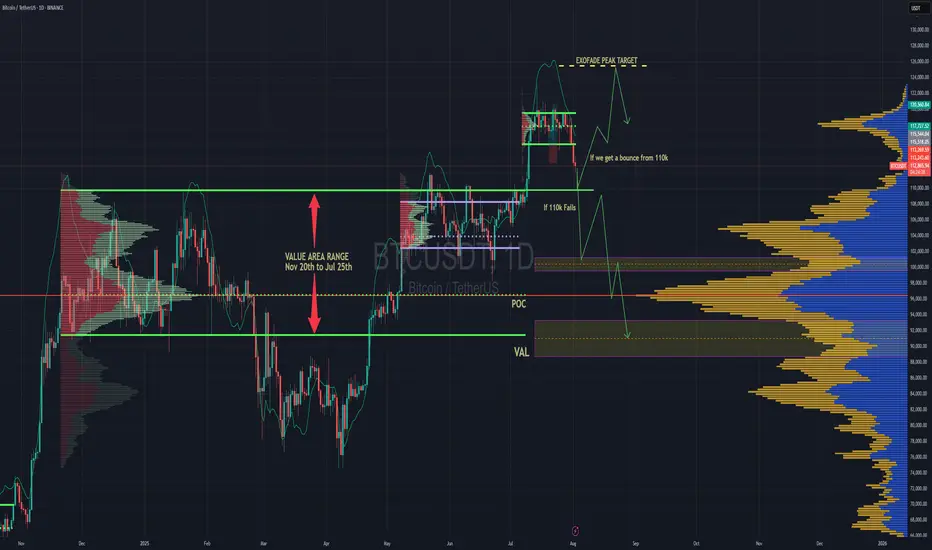
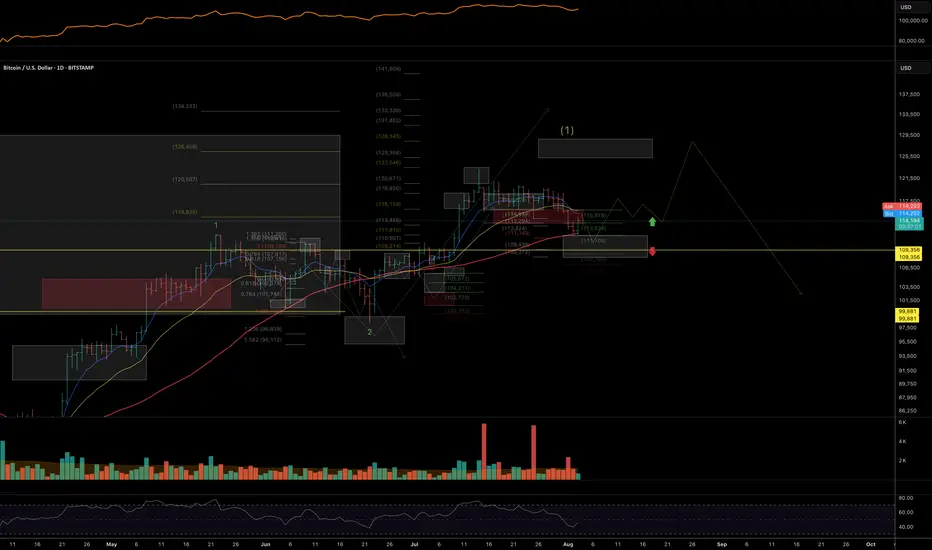
BTC Forecast For August & September. The Only Roadmap You Need !This is one is so obvious, its a no brainer , and would likely be very easy to trade as long as you follow this road map i have provided.
The Value Area High at 110k price range is most important upcoming battle line between bull vs bear. If bulls fail to get a strong bounce from 110k and we close at least 2 daily candles below it. Then it would mean bears have full control and the implication of that is that since we would at that point be closing back inside an established Value Area range, formed between Nov 20th to Jul 25th, then it would mean the probability of price selling all the way down to re-test the VAL (value area low) at $91.6k would instantly become very very high.
After re-testing $91.6k we'll watch and see what happens.
It'll either hold after grabbing some liquidity below and stay in the Value Area Range until further notice Or we lose it and the sell off continues. Bear market will be in full swing if that happens and you can bet a ton of weak hands will start to exit due to max pain & cascading long liquidations. Fear index will be back in the red at that point as capitulation starts to set in. Alot of new alts and meme coins will be completely obliterated.
Bullish Continuation Scenario
If bulls get a strong bounce from 110k and don't close back inside the Value Area Range below, then we could continue up to a make a new ATH for a classic trend pullback continuation trade. Once we get back above 115.4k, the dream of a new ATH will become much more realistic. There is an UFA(Unfinished Auction) at 120.8k which is only visible to traders using the market profile or footprint chart. This make poor high and needs to be taking out at some point.
For the Price target to the upside, we would be using the peak formation line of the ExoFade indicator.
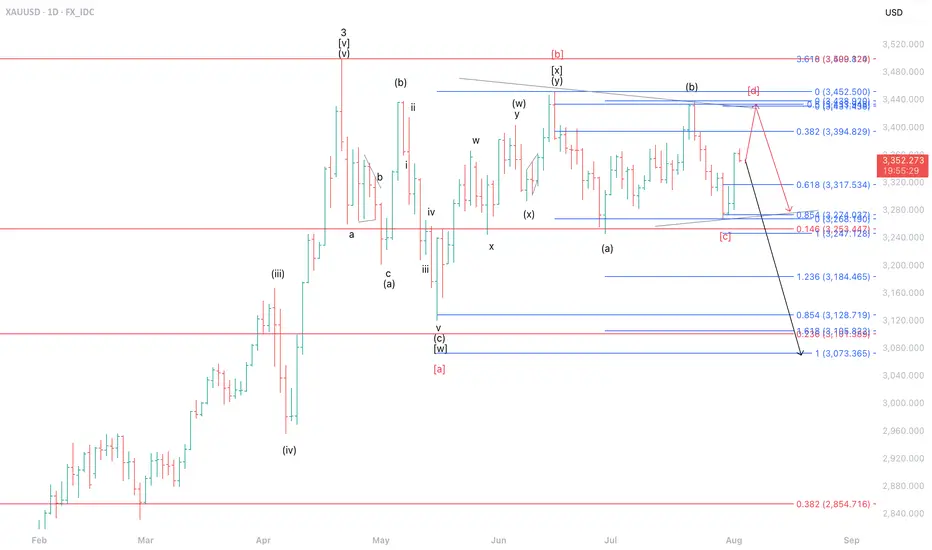
Potential Reversal After Complex CorrectionThe current movement of gold (XAUUSD) is estimated to be forming part of wave ii of wave (c) of wave under the black label scenario. This implies that XAUUSD has the potential to undergo a deeper correction, targeting the 3,073–3,184 range.
However, under the alternative red label, the price action appears to be developing a triangle pattern as part of wave of wave 4. In this scenario, XAUUSD still holds the potential for further upside toward the 3,394–3,438 area, which also coincides with a Fibonacci cluster zone, serving as a critical resistance region.
GU Long Then, ShortM: Downtrend, made a new low
W: Uptrend, respecting the lows
D: Uptrend, price broke and retested trendline
4H: Downtrend, price broke and retested trendline retraced 50% and hit -27 on 4H fib and reversed to go long
1H: Downtrend, price broke and retested support. Then went aggressively long on NFP news (-jobs)
DXY is show bullish divergence
GU minor and daily trend is showing bearish divergence.
CURRENTLY: I'm looking for price to go long to retest support as resistance, then continue short.

$BTC Weekly Close Keeps Bullish StructureCRYPTOCAP:BTC looking hopeful closing the Week just above previous ATH POI and above the SMA9.
PA needs to stay above this to keep bullish momentum.
the CME Gap was filled, which was the main objective on this correction.
Let’s see how the market reacts on judgement day tomorrow 🤓
COTIUSDT – One Bullet, Not All-InThe blue box looks like a solid area to risk 1R — but let’s keep our feet on the ground.
This isn’t about predicting tops or bottoms. It’s about testing structure with confirmation.
🟦 A single, well-managed attempt is okay — but in case a Q3 correction kicks in, this setup could still get stopped out. So instead of going heavy on leverage, I lean toward spot entries here. Spot buys also good!
All risk-on markets typically experience significant corrections in the third quarter of the year and struggle to recover from this correction until the end of the year.
🧭 Execution Flow
🔔 Alert on the blue box
🕐 Drop to 1H
📈 Look for breakout with rising CDV
✅ One controlled entry — no overexposure.
📌I keep my charts clean and simple because I believe clarity leads to better decisions.
📌My approach is built on years of experience and a solid track record. I don’t claim to know it all but I’m confident in my ability to spot high-probability setups.
📌If you would like to learn how to use the heatmap, cumulative volume delta and volume footprint techniques that I use below to determine very accurate demand regions, you can send me a private message. I help anyone who wants it completely free of charge.
🔑I have a long list of my proven technique below:
🎯 ZENUSDT.P: Patience & Profitability | %230 Reaction from the Sniper Entry
🐶 DOGEUSDT.P: Next Move
🎨 RENDERUSDT.P: Opportunity of the Month
💎 ETHUSDT.P: Where to Retrace
🟢 BNBUSDT.P: Potential Surge
📊 BTC Dominance: Reaction Zone
🌊 WAVESUSDT.P: Demand Zone Potential
🟣 UNIUSDT.P: Long-Term Trade
🔵 XRPUSDT.P: Entry Zones
🔗 LINKUSDT.P: Follow The River
📈 BTCUSDT.P: Two Key Demand Zones
🟩 POLUSDT: Bullish Momentum
🌟 PENDLEUSDT.P: Where Opportunity Meets Precision
🔥 BTCUSDT.P: Liquidation of Highly Leveraged Longs
🌊 SOLUSDT.P: SOL's Dip - Your Opportunity
🐸 1000PEPEUSDT.P: Prime Bounce Zone Unlocked
🚀 ETHUSDT.P: Set to Explode - Don't Miss This Game Changer
🤖 IQUSDT: Smart Plan
⚡️ PONDUSDT: A Trade Not Taken Is Better Than a Losing One
💼 STMXUSDT: 2 Buying Areas
🐢 TURBOUSDT: Buy Zones and Buyer Presence
🌍 ICPUSDT.P: Massive Upside Potential | Check the Trade Update For Seeing Results
🟠 IDEXUSDT: Spot Buy Area | %26 Profit if You Trade with MSB
📌 USUALUSDT: Buyers Are Active + %70 Profit in Total
🌟 FORTHUSDT: Sniper Entry +%26 Reaction
🐳 QKCUSDT: Sniper Entry +%57 Reaction
📊 BTC.D: Retest of Key Area Highly Likely
📊 XNOUSDT %80 Reaction with a Simple Blue Box!
📊 BELUSDT Amazing %120 Reaction!
📊 Simple Red Box, Extraordinary Results
📊 TIAUSDT | Still No Buyers—Maintaining a Bearish Outlook
📊 OGNUSDT | One of Today’s Highest Volume Gainers – +32.44%
📊 TRXUSDT - I Do My Thing Again
📊 FLOKIUSDT - +%100 From Blue Box!
📊 SFP/USDT - Perfect Entry %80 Profit!
📊 AAVEUSDT - WE DID IT AGAIN!
I stopped adding to the list because it's kinda tiring to add 5-10 charts in every move but you can check my profile and see that it goes on..

I am bullish on GOOGLE stockI am bullish on GOOGLE stock
Following last week's pullback, I see a positive ride back to the all-time high (ATH) around $209 or beyond.
Trade with care.
I look forward to connecting with you.
Please share your thoughts in the comment section, share, like and follow

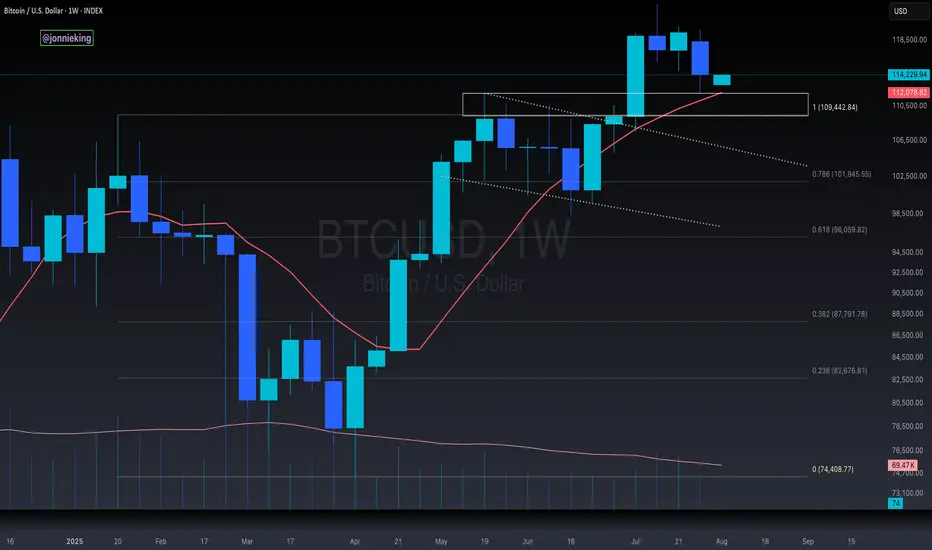
BTCUSD – Retest of Key Support at 111,900After setting a new all-time high at 123,229.00, BTCUSD has pulled back and is currently reacting to the 111,900.00 support area. This level aligns with prior structure and may provide a short-term floor if bullish momentum returns.
Support at: 111,900.00 🔽 | 100,622.00 | 87,589.00
Resistance at: 116,190.00 🔼 | 120,011.00 | 123,229.00
🔎 Bias:
🔼 Bullish: Price must hold above 111,900.00 and reclaim 116,190.00 to set up for a potential retest of the all-time high.
🔽 Bearish: A breakdown below 111,900.00 opens the door for deeper correction toward 100,622.00 and 87,589.00.
📛 Disclaimer: This is not financial advice. Trade at your own risk.

AUS200 – Retest of 8,634.00 After Swing High RejectionAUS200 pulled back sharply after tagging the recent high at 8,784.83, now testing the 8,634.00 support zone which aligns with the 21 SMA. This level is acting as the immediate battleground.
Support at: 8,634.00 🔽 | 8,530.00 | 8,400.00
Resistance at: 8,784.83 🔼
🔎 Bias:
🔼 Bullish: If price stabilizes above 8,634.00 and reclaims bullish momentum, we could see another retest of the high at 8,784.83.
🔽 Bearish: A daily close below 8,634.00 puts 8,530.00 and 8,400.00 in play, especially if the 21 SMA fails to hold as dynamic support.
📛 Disclaimer: This is not financial advice. Trade at your own risk.

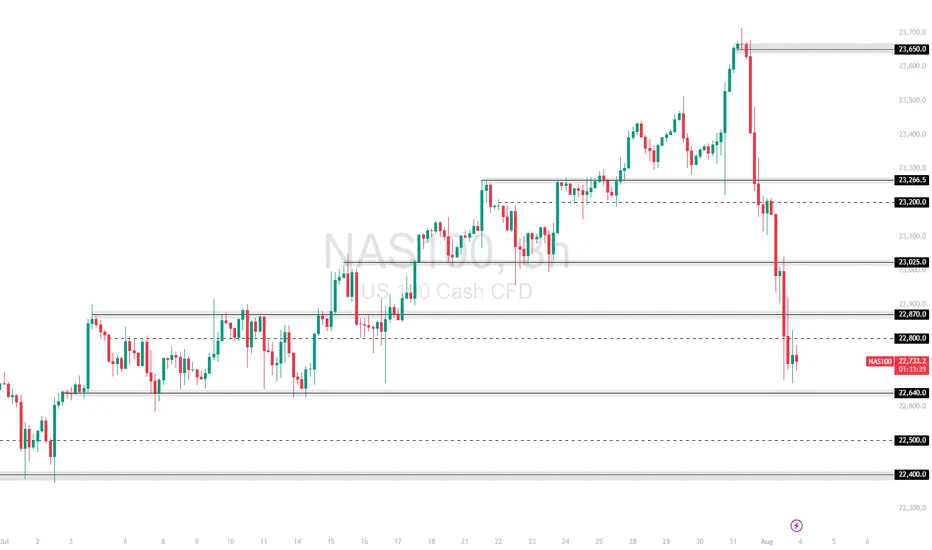
NAS100 Slammed by Fed Data and Trump Trade Remarks Can 22,640 ?The NAS100 plunged after strong US economic data fueled expectations of tighter Fed policy, and Trump's renewed push for aggressive trade deals rattled tech sentiment. After rejecting the 23,665 🔼 resistance, the index dropped sharply through multiple support levels.
Price is now consolidating just above the 22,640 🔽 zone, a key near-term support.
Support: 22,800 🔽, 22,640 🔽, 22,500 🔽
Resistance: 23,025 🔼, 23,277 🔼, 23,332 🔼
Bias:
🔽 Bearish: A breakdown below 22,640 could trigger a move toward 22,500. If that fails, 22,400 becomes the next target.
🔼 Bullish: A reclaim of 23,025 would be the first sign of bullish recovery.
📛 Disclaimer: This is not financial advice. Trade at your own risk.
NASDAQ: Bears In Control! Sell it!Welcome back to the Weekly Forex Forecast for the week of Aug 4 - 8th.
In this video, we will analyze the following FX market:
NASDAQ (NQ1!) NAS100
The NAS 100 was weakened by bad job numbers, mixed earnings reports, and tariff wars. In the short term, it is bearish. Sell it down to the Weekly/daily +FVG for high probability buys from those levels.
Buying at current levels is not advised. Wait for a valid market structure shift to the upside before going long.
Enjoy!
May profits be upon you.
Leave any questions or comments in the comment section.
I appreciate any feedback from my viewers!
Like and/or subscribe if you want more accurate analysis.
Thank you so much!
Disclaimer:
I do not provide personal investment advice and I am not a qualified licensed investment advisor.
All information found here, including any ideas, opinions, views, predictions, forecasts, commentaries, suggestions, expressed or implied herein, are for informational, entertainment or educational purposes only and should not be construed as personal investment advice. While the information provided is believed to be accurate, it may include errors or inaccuracies.
I will not and cannot be held liable for any actions you take as a result of anything you read here.
Conduct your own due diligence, or consult a licensed financial advisor or broker before making any and all investment decisions. Any investments, trades, speculations, or decisions made on the basis of any information found on this channel, expressed or implied herein, are committed at your own risk, financial or otherwise.

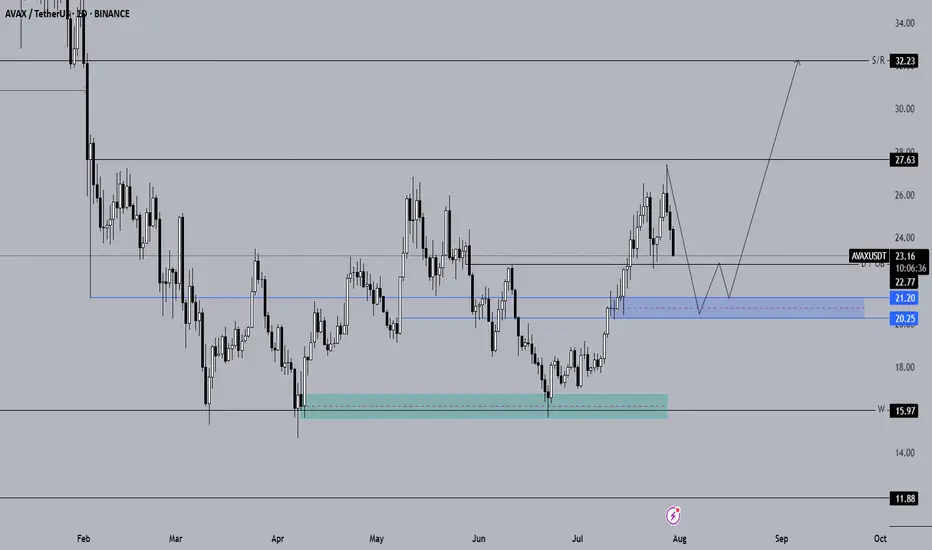
Long-Term Technical Analysis of AVAX CoinWhen evaluating AVAX for long-term investments, the blue support zone highlighted on the chart stands out as the key area to monitor for potential spot entries. If AVAX closes daily candles below the $22.77 level, it is expected to continue its downward trend.
The primary spot buy zone for AVAX is identified between the $21.20 – $20.25 support range. If the price retraces into the blue zone on the chart, we plan to initiate spot positions. Should AVAX show a reversal from this area, our next upside targets are $27.63 and $32, respectively.
If AVAX fails to generate a strong reaction from the blue zone and continues to decline, we will then monitor the $18 support level. As long as AVAX holds above $18, our bullish outlook from this analysis remains valid.
Not Financial Advice (NFA).
Altcoins and BTC: Macro Structures, Key Levels, and What’s NextIn this Sunday's market crypto-market analysis, I'm sharing trend structures and key support zones for the total altcoin market cap (excluding BTC and ETH), as well as for ETH, XRP, BNB, SOL, HYPE, and BTC. I also outline my main scenarios for market movement through the end of August and the rest of the year.
Key takeaways:
- Impulsive structures are shifting to diagonal structures — less stable and growth cycle is likly approaching the final phase of this market cycle.
- As long as prices hold above key macro support zones, the uptrend structure remains intact.
- I don’t rule out another sell-off early this week, deeper into support zones, followed by a potential rebound through late August, then a phase of consolidation (ideally staying above the current correction lows from the July top), and one final rally to new highs starting mid-autumn and continuing toward year-end.
-I expect ETH, XRP, and BNB to be the primary beneficiaries of the next wave of growth.
Total Altcoin Market Cap (Excluding BTC & ETH)
Support zone: 955-913B
Target resistance zone: 1.19-1.26T
BITSTAMP:ETHUSD
Support zone: 3400–3200 (possible extension to 3000)
Target resistance zone: 4300–5100+
BINANCE:XRPUSDT
Support zone: 2.7–2.5
Target resistance zone: 5.2+
BINANCE:SOLUSDT
Support zone: 170–150
Target resistance zone: 250–300
CRYPTO:HYPEHUSD
Support zone: 33–30
Target resistance zone: 60–72
BINANCE:BNBUSD
Support zone: 510–530
Target resistance zone: 960–1000
BTC Dominance
BITSTAMP:BTCUSD
Support zone: 111–109K
Target resistance zone: 125–130/135K
If you’d like me to cover a specific coin, leave a comment — I’ll include it in future updates or prepare a short video breakdown.
Thanks for your attention, and I wish everyone a strong start to the week and well-grounded investment decisions!
S&P 500: Bearish For The Short Term! Sell It!Welcome back to the Weekly Forex Forecast for the week of July 28 - Aug 1st.
In this video, we will analyze the following FX market for the week of Aug 4-8th:
S&P 500 (ES1!)
The S&P 500 rose Friday to fresh highs, following a busy week of tariff updates and earnings. The S&P ended the week with its fifth straight record close, its longest such streak in over a year.
No reason to consider selling. Wait for pullbacks to FVGs for high probability buys.
FOMC and NFP loom. Be careful to avoid new entries during news times.
Enjoy!
May profits be upon you.
Leave any questions or comments in the comment section.
I appreciate any feedback from my viewers!
Like and/or subscribe if you want more accurate analysis.
Thank you so much!
Disclaimer:
I do not provide personal investment advice and I am not a qualified licensed investment advisor.
All information found here, including any ideas, opinions, views, predictions, forecasts, commentaries, suggestions, expressed or implied herein, are for informational, entertainment or educational purposes only and should not be construed as personal investment advice. While the information provided is believed to be accurate, it may include errors or inaccuracies.
I will not and cannot be held liable for any actions you take as a result of anything you read here.
Conduct your own due diligence, or consult a licensed financial advisor or broker before making any and all investment decisions. Any investments, trades, speculations, or decisions made on the basis of any information found on this channel, expressed or implied herein, are committed at your own risk, financial or otherwise.
