XAGUSD (SILVER): Sells For Now, Down To 35.80In this Weekly Market Forecast, we will analyze the XAGUSD (SILVER) for the week of Aug 4-8th.
Silver was strong, sweeping a 2012 high. Then sellers stepped in for the next couple of weeks, printing bearish candles. Friday say a late rally on weak job numbers, weakening the USD and allowing Silver and other asset pairs to outperform it in the short term.
Due to the bearish close of last week's candle, the indication is the rally was a market reaction, and that the slide will continue into this week.
Until there is a bullish break of market structure, buys are not a great idea. Stick with sells, down to the Monthly +FVG.
Enjoy!
May profits be upon you.
Leave any questions or comments in the comment section.
I appreciate any feedback from my viewers!
Like and/or subscribe if you want more accurate analysis.
Thank you so much!
Disclaimer:
I do not provide personal investment advice and I am not a qualified licensed investment advisor.
All information found here, including any ideas, opinions, views, predictions, forecasts, commentaries, suggestions, expressed or implied herein, are for informational, entertainment or educational purposes only and should not be construed as personal investment advice. While the information provided is believed to be accurate, it may include errors or inaccuracies.
I will not and cannot be held liable for any actions you take as a result of anything you read here.
Conduct your own due diligence, or consult a licensed financial advisor or broker before making any and all investment decisions. Any investments, trades, speculations, or decisions made on the basis of any information found on this channel, expressed or implied herein, are committed at your own risk, financial or otherwise.
Support and Resistance

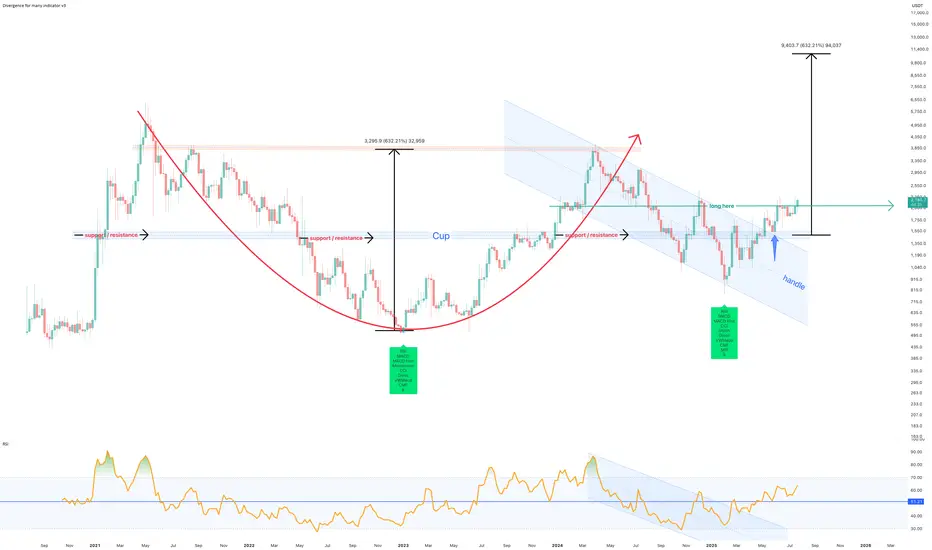
July 2025 - Marker DAO (MKR) to $10k before EthereumThe above forecast is predicted to strike before October 2025. Ethereum will never reach $10k in its lifetime, which a study for another post.
A 75% correction is shown on the above 6 day chart that began in March 2024. A number of compelling reasons now exist for a strong upward move.
Support and resistance
Look left, price action confirms support on past resistance, which follows a strong positive divergence. The resistance has held since May 2022. Incidentally on the topic of divergences, on the same time frame with the same settings, Ethereum prints a double negative divergence over the same period. (see below).
The trend
Both Price action and RSI resistances have broken out. RSI confirms a trend reversal on past resistance.
A Cup and Handle pattern confirmation
The forecast is derived from the Cup and Handle pattern topping out at around $10.5k, however it is not suggested to wait until this area before profits are taken.
Is it possible price action continues to print lower lows? Sure.
Is it probable? No.
Ww
Ethereum 6 day double negative divergencies
My bullish view on BTCIf we break upwards in this channel we will see 134k and/or 140k depending on the resistance on the trend lines!

XAUUSD WEEKLY ANALYSIS Hey everyone happy new week and hope you had a great weekend 😇😎…So here’s my analysis on Gold this week tho last week analysis didn’t played out perfectly cuz price missed our entry zone with just some few pips,You can check my last post for that….So I will be looking for buys on Gold this week and waiting if price would drop down to 3250 zone to execute buys kinda same entry from last week but cleaned my chart and marked the zone with a clear mind again and also if price doesn’t drop to our entry zone then Gold will be heading to 3434 zone which is sellers zone and there’s a possibility I might take sells from that spot but I will update you guys if am on a trade…Let’s have a great success week…

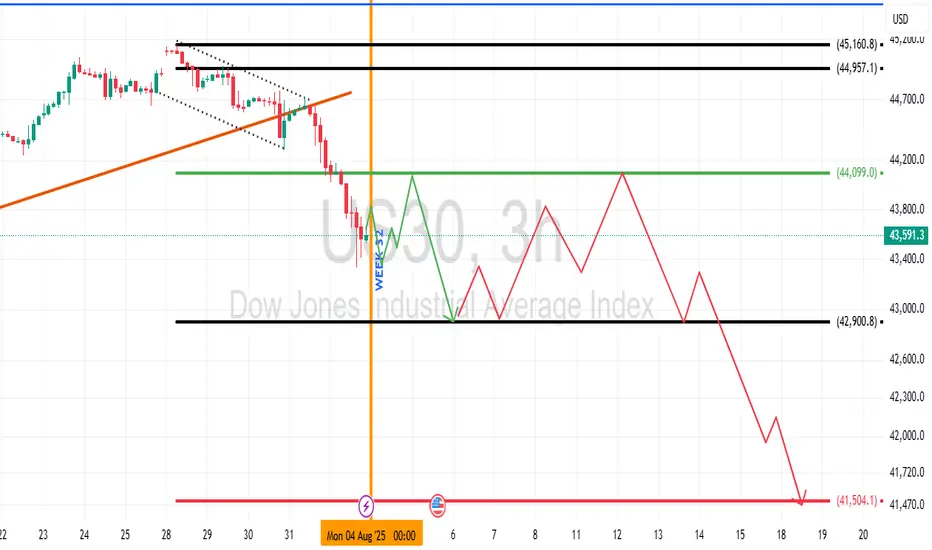
US 30 Dow Jones Industrial Average Week 32 OutlookUS 30, along with related indices, is likely to range for most of the week with early sells to confirm the support of interest. Best interest is in the bearish sentiment right now.
Key Levels for the Month 08/2025 ∷Gold∷🐍 Key Levels Overview for the Month 🐍
__________________________
Trend Base Lines
3268🐂🐂3403
3411🏛🏛3557
3505🐻🐻3725
__________________________
Resistances🔀
4049
3883
3751
,
3634
,
3610
3591
,
3518
3466
3435
3404
Mids∷∷∷
3717
3573
,
3508
3495
,
3456
,
3422
3398
3372
Supports🔀
3552
3422
3411
3386
,
3337
,
3328
,
3297
3281
3261

XAUUSD (GOLD): Bullish Impulsive Move Up Friday! Wait For Buys!In this Weekly Market Forecast, we will analyze the Gold (XAUUSD) for the week of Aug 4 - 8th.
Gold is bullish on the Monthly, Neutral on the Weekly, Bullish on the Daily.
The aggressive move higher after bad job numbers caused a shift in the market from bearish to bullish on the D1 time frame.
Be wary of the pullback, as that move is likely to be corrected, but that would set up a great long opportunity!
Enjoy!
May profits be upon you.
Leave any questions or comments in the comment section.
I appreciate any feedback from my viewers!
Like and/or subscribe if you want more accurate analysis.
Thank you so much!
Disclaimer:
I do not provide personal investment advice and I am not a qualified licensed investment advisor.
All information found here, including any ideas, opinions, views, predictions, forecasts, commentaries, suggestions, expressed or implied herein, are for informational, entertainment or educational purposes only and should not be construed as personal investment advice. While the information provided is believed to be accurate, it may include errors or inaccuracies.
I will not and cannot be held liable for any actions you take as a result of anything you read here.
Conduct your own due diligence, or consult a licensed financial advisor or broker before making any and all investment decisions. Any investments, trades, speculations, or decisions made on the basis of any information found on this channel, expressed or implied herein, are committed at your own risk, financial or otherwise.

TANTALIZER LONG IDEATANTALIZER stock is looking promising. There was a bullish divergence on the awesome oscillator (daily timeframe), which was followed by a bullish change of character. This is a confirmation that the stock is ready to go higher. Price has recently dropped to the demand zone confluenced with trendline and support level, which is a good point to take a long position. After mitigating the demand zone, there was a rejection showing that buyers are willing to push price higher.
To take advantage of this long opportunity, one can buy at the current market price. The first target is N2.99 (24.58%) and the final target is N3.45 (43.75%). The stop can be at 2.10 (-12.50%).
Confluences for the long idea:
1. Bullish market structure
2. Trendline
3. Awesome oscillator divergence
4. Rejection candle
5. Support level
Disclaimer: This is not a financial advice. The outcome maybe different from the projection. Don't take the signal if you're not willing to accept the risk.

GBPJPY - Catching The Falling Knife... ConservativelyDon't catch the falling knife! This is a common warning in the trading industry. Although i do agree with it (in some circumstances), I think what's more important is for us to perform analysis and be confident on where that knife may find a floor at.
In the case of the OANDA:GBPJPY I think we've seen that floor which may present us with the opportunity to but IF... I say if because simply making that prediction isn't enough. As a trade, what I want to see if some sort of signal from the market (while at that level) that price is more likely to do what I predict, than not.
If you have any questions, comments or want to share your views, please do so below. Also be sure to hit that like button & give me a follow, that way you don't miss my future trading ideas.
Akil

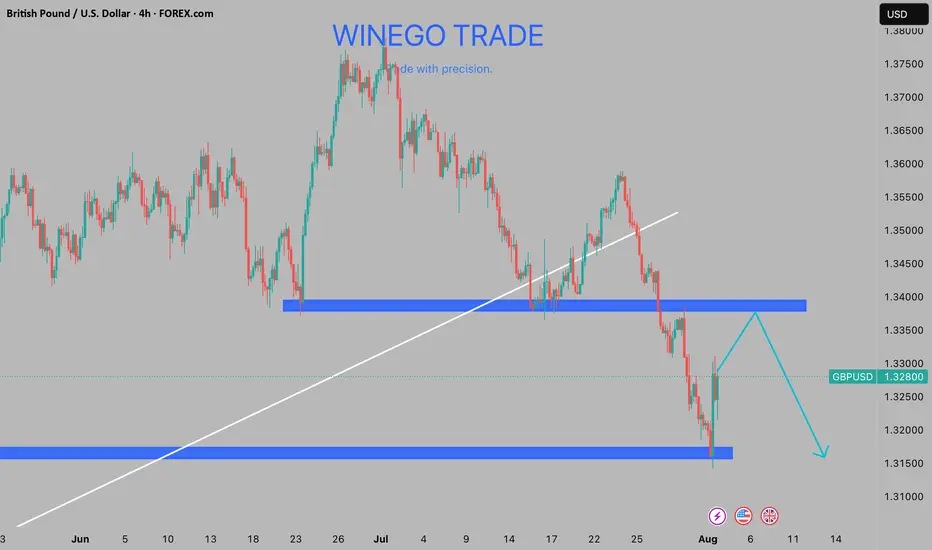
GPBUSD: BULLISH?The British Pound (GBP) has demonstrated a notable recovery in recent trading sessions, regaining some upside momentum on Friday. Despite this rebound, The GBP/USD pair's technical setup suggests that a rally towards the 1.3400 psychological level is necessary before any further drop. The pair's ability to breach this level will likely determine its short-term trajectory, with a successful break above paving the way for further gains and a failure to break above potentially leading to renewed selling pressure.
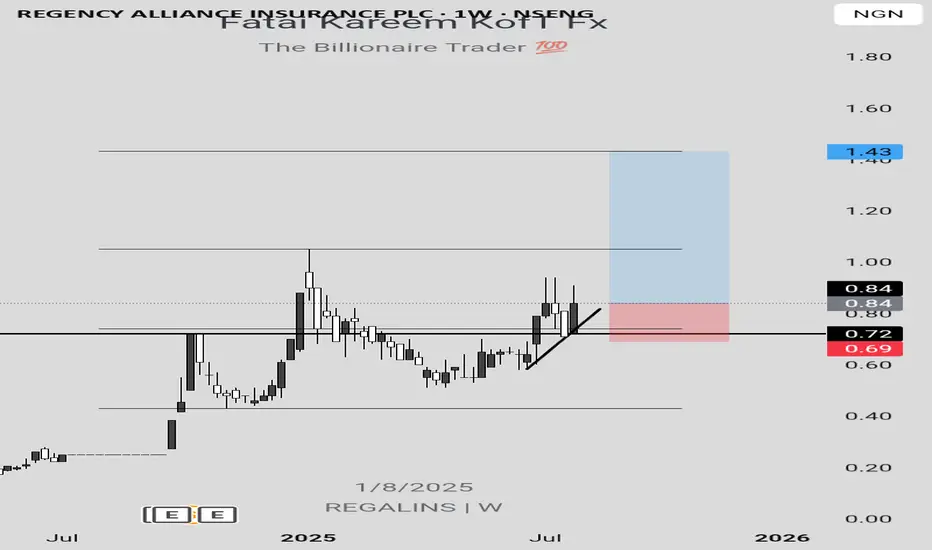
REGALINS LONG IDEA REGALINS stock is yet to take out the recent high which is the target for the current move. Hence, this serves as a long opportunity as confirmed by the bullish engulfing candlestick formation after testing resistance turned to support level. To take advantage of this long opportunity, one can buy at the current market price. The first target is N1.05 (25%) while the final target is N1.43 (70.24%). The stop can be at N0.69 (17.86%) below the support level.
Confluences for the long idea:
1. Bullish engulfing candlestick confirmation
2. Resistance turned to support level
3. Bullish market structure
4. Trendline
Disclaimer: This is not a financial advice. The outcome maybe different from the projection. Don't take the signal if you're not willing to accept the risk.
Higher Timeframe Ice Zone - Lower Timeframe Double TopAfter a pretty rough end to the week the FX:EURUSD has rallied up into an Ice Zone - Which is a previous price level that has acted as both support and resistance in the recent past.
As we venture down to the lower timeframe we'll see that price action has also formed a double top level at that pattern which is a classic price pattern for a bearish reversal.
If you're looking for a more conservative entry then waiting for a 2618 opportunity could be something you do as well.
Please leave any questions or comments below & be sure to give me a follow if you want to be notified of my trading ideas.
Akil

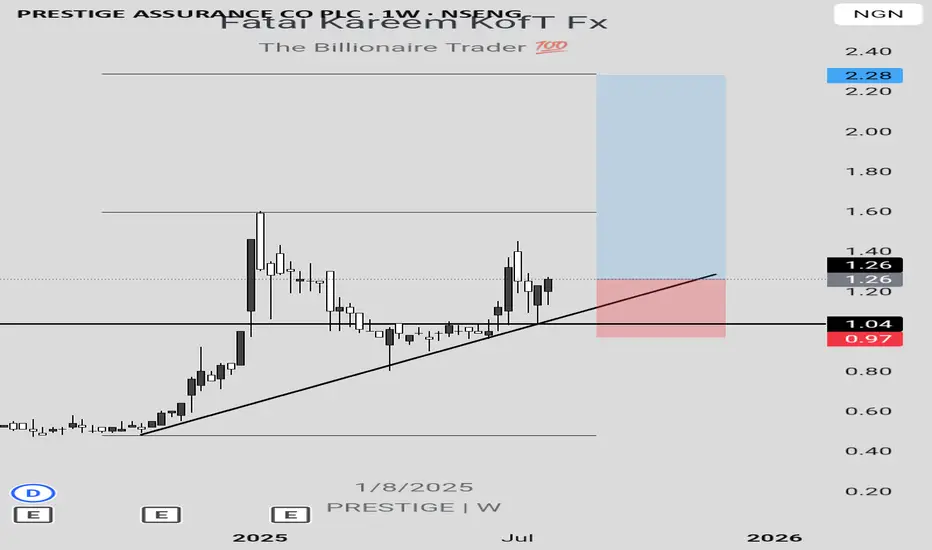
PRESTIGE LONG IDEA PRESTIGE stock has presented a long opportunity after coming from a support level and trendline. The 2 bullish weekly candles are strong indications that buyers are willing to push price higher. To take advantage of this long opportunity, one can buy at the current market price. The first target is N1.59 (26.19%) while the final target is N2.28 (80.95%) based on 1.618 Fibonacci level. The stop can be at N0.97 below the support level and trendline.
Confluences for the long idea:
1. Strongly buying momentum
2. Support level
3. Trendline
4. Bullish market structure
Disclaimer: This is not a financial advice. The outcome maybe different from the projection. Don't take the signal if you're not willing to accept the risk.
NSLTECH LONG IDEANSLTECH stock presents a long opportunity based on the market structure, support level and trendline. To take advantage of this long opportunity, there are different approaches. An aggressive approach is to buy at the current market price since price is in the discount level. Then, add more long positions when price gets to the support level around N0.60 and N0.57. While a conservative approach is to wait for price to get to the support level and give a candlestick confirmation before entering a long position. The stop can be at N0.45 (23.73%) while the final target is N1.33 (125.42%).
Confluences for the long idea:
1. Bullish market structure
2. Trendline
3. Support level
4. Discount level.
Disclaimer: This is not a financial advice. The outcome maybe different from the projection. Don't take the signal if you're not willing to accept the risk.

Anticipating DJIOn the daily timeframe, the current position of the Dow Jones Industrial Average (DJI) is projected to follow one of three possible scenarios:
Scenario 1 (Black Label):
DJI is currently in the process of forming Wave iv of Wave , implying that any short-term rebound is likely to be limited. The index may test the resistance area between 43,953–44,142, but remains vulnerable to further downside correction thereafter.
Scenario 2 (Red Label):
In this scenario, Wave 4 is considered complete, allowing DJI to resume its upward momentum. A breakout would signal the start of Wave 5, targeting the 45,324–46,465 range for a potential new higher high.
Scenario 3 (Blue Label):
Here, DJI is assumed to be in the midst of Wave 4 of Wave (5). A corrective move is expected first, potentially revisiting the support zone around 42,262–43,028, before continuing its bullish trend to form a new higher high.

GUINEAINS LONG IDEA GUINEAINS stock presents a long opportunity based on trendline and support level. To take advantage of this opportunity, there's a need to wait for price to drop to the support level around N75 and N73. An aggressive approach is to enter a long position at that price while a conservative approach is to wait for a candlestick confirmation such as bullish engulfing or hammer. The last high around N1.23 (68.49%) can be the target while the stop can be around N0.57 (21.92%).
Confluences for the long idea:
1. Bullish trendline
2. Support level
3. Bullish market structure.
Disclaimer: this is not a financial advice. The outcome maybe different from the projection. Don't take the signal if you're not willing to accept the risk.

Long trade www.tradingview.com
🟢 Buyside Trade
Pair: LINKUSD
Date: Saturday, 5th July 2025
Time: 8:00 PM
Session: Tokyo Session PM
Time Frame: 4Hr TF Entry
🔢 Trade Metrics
Entry Price: 13.161
Take Profit (TP): 25.814 (+96.14%)
Stop Loss (SL): 12.984 (−1.34%)
Risk-Reward Ratio: 70.32: 1
📈 Chart Analysis
Structure: Price broke the previous consolidation zone and retested key support levels near the 13.16 area before launching upward.
Indicators:
200 WMA (Yellow) & 50 EMA (Blue) both support continuation.
Break of market structure confirmed prior resistance as new support.

EURUSD: POTENTIAL SELLING OPPORTUNITYThe EURUSD pair rebounded from the 1.160 resistance level after the NFP report last Friday, forming a Double Top pattern on the 4-hour chart. This pattern is a strong indication of a potential bearish reversal. With the price having broken below the neckline, it's now approaching a retest of this level and the previously broken trendline.
Key areas to watch include:
1. The neckline around 1.1600, which is expected to act as resistance.
2. The trendline between 1.1670-1.1700, which could provide additional resistance to confirm the bearish outlook.
Possible scenarios include:
Bearish Outlook (Preferred): If the price encounters resistance at these levels and fails to break higher, it may lead to a decline.
This setup suggests a potential selling opportunity, with traders looking to short the pair near the resistance zones.

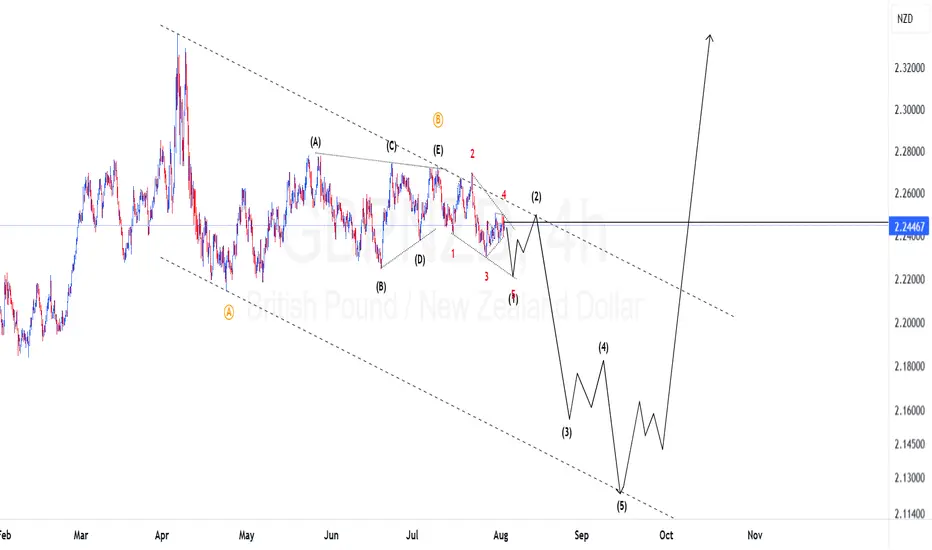
GBPNZD Elliot waves updatePrice is still on the first wave of wave C. Given the current wave structure it looks like we should expect first wave to unfold as a leading diagonal. If we are correct then during the coming week we should expect price to gain momentum to the down side to complete the leading diagonal with the 5th wave. To take advantage of this bearish bias one should find areas of resistance and other confluences to take the trade.
Bitcoin Outlook – Early August🟩 1M Timeframe (Monthly Overview)
The August monthly candle has just begun forming, so it’s too early to draw solid conclusions. While there’s selling pressure visible, it’s not yet a confirmed reversal on the higher timeframe.
🟨 1W Timeframe (Weekly View)
On the weekly chart, structure leans bearish. If momentum continues, a mid-term downside target of $105,000 remains in play.
🟧 1D Timeframe (Daily Perspective)
The daily chart shows some buying interest around $108,500, suggesting a possible short-term rebound.
However, if price fails to hold above this level, it may drop to retest the $105,000 zone.
A break below that would open the door for a move toward $102,000.
⸻
🧭 Key Notes:
1. If the bearish view is to remain valid, price must not break above $120,000.
A higher high would indicate potential trend continuation on the bullish side.
2. Rebounds are possible along the way.
Opening a short position in the current zone is viable, but a tight stop-loss around $114,500 ± $500 is advised.
This level is a lower high on the 4H timeframe — a critical pivot that, if held, confirms bearish continuation.
But if price breaks above it, the downtrend scenario weakens, and traders may wait for a re-entry closer to the $120,000 resistance zone.
⸻
🧠 Summary & Strategy:
• Monthly: too early to call
• Weekly: bearish bias, targeting $105,000
• Daily: watch $108,500 for short-term support
• Downside levels: $105,000 → $102,000
• No new high above $120,000 if bears are to stay in control
• Short entries okay here; SL ~ $114,500 ± $500
• Wait to re-short at $120,000 if invalidated

BTCUSDT | Key Trend Channel Breakdown & Major Support AheadBitcoin has broken below a key trend channel on the 4H chart, currently trading around $113,891. Price is reacting after a sharp drop, approaching a major demand zone located between $107.5K and $109K, which previously acted as a strong support.
📉 Downside Potential:
Main Demand Zone: $107.5K – $109K
A possible bullish reaction is expected here if buyers step in aggressively.
📈 Upside Targets if Price Rebounds:
First Target: Upper boundary of local channel – ~$117.5K
Second Target: Full bullish recovery – ~$135K
⚠️ Note: This move comes after an extended consolidation and a sudden breakdown. Pay close attention to the lower boundary zone, as failure to hold could trigger a deeper correction.
📊 Chart Type: BTCUSDT – 4H (Binance)
🔧 Tools Used: Trend Channels, Support/Resistance Zones
📅 Date: August 3, 2025

Only by understanding the trend can you be firmly bullish.The market is changing rapidly, and going with the flow is the best way to go. When the trend comes, just go for it. Don't buy at the bottom against the trend, so as not to suffer. Remember not to act on impulse when trading. The market is good at dealing with all kinds of dissatisfaction, so you must not hold on to orders. I believe many people have experienced this. The more you resist, the more panic you will feel, and the floating losses will continue to magnify. You will not be able to eat or sleep well, and you will miss many opportunities in vain. If you also have these troubles, then you might as well follow Tian Haoyang's rhythm and try to see if it can make you suddenly enlightened. If you need help, I will always be here, but if you don't even extend your hand, how can I help you?
Gold rose unilaterally after the positive non-farm payrolls on Friday, hitting a new high this week. This week's K-line closed in a hammer shape, and the gold hourly line has a double bottom structure. However, gold should not have such a big retracement for the time being. The 3335-3330 line below is also an important support. So gold will mainly be bought on dips above 3335-3330 next week. Technically, there is still room for growth next week. The bulls continued to attack at the end of Friday and closed at 3363. Next week, we will continue to pay attention to the short-term suppression at the 3370-3375 line above. In terms of operations, we will continue to maintain retracement and buy. If your current operation is not ideal, I hope I can help you avoid detours in your investment. Welcome to communicate and exchange. Judging from the current gold trend, the short-term resistance above next week will be around 3370-3375, with a focus on the important pressure line of 3395-3400. Keep buying on pullbacks, and try to maintain a stable wait-and-see position in the middle. I will prompt the specific operation strategy at the bottom, so please pay attention in time.
Gold operation strategy: Go long on gold when it retraces to around 3340-3330, target 3370-3375, and continue to hold if it breaks through.

Potential 4H Head and shouldersA potential h&s could be shaping, the daily trend is down but the weekly chart is looking for support.
