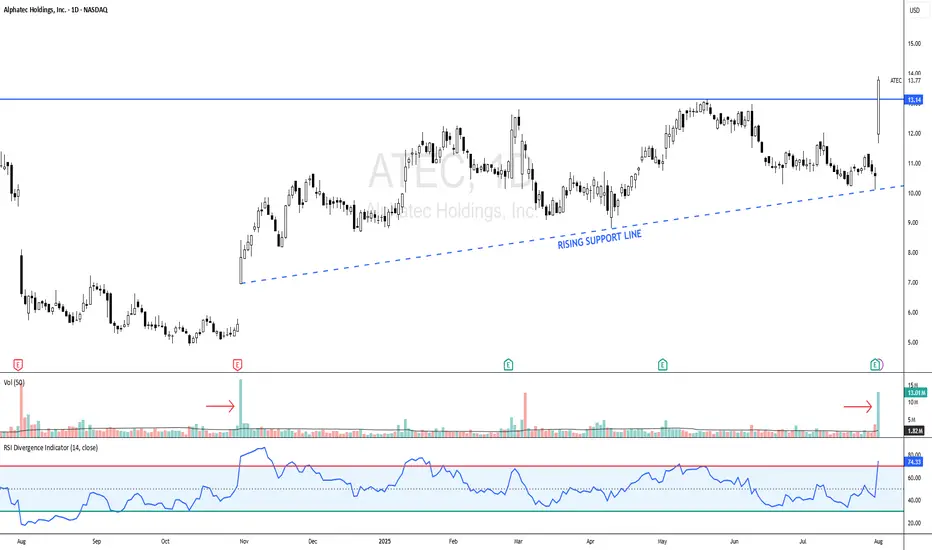
ATEC - NEW 52-WEEK HIGHATEC - CURRENT PRICE : 13.77
ATEC made a new 52-week high last Friday with burst in trading activity. Look at the volume pointed by red arrows. On 31 Oct 2024 there was a significant gap up with high volume, from there the stock continue rises - indicating strong buying interest. Now same scenario happens - gap up with strong volume (hint a strong bullish momentum). Take note also that there is a rising support line - indicating demand is getting higher. There is possibility that the stock may trend higher in near term.
ENTRY PRICE : 13.15 - 13.80
TARGET : 16.50 and 18.70
SUPPORT : 12.75
Support and Resistance
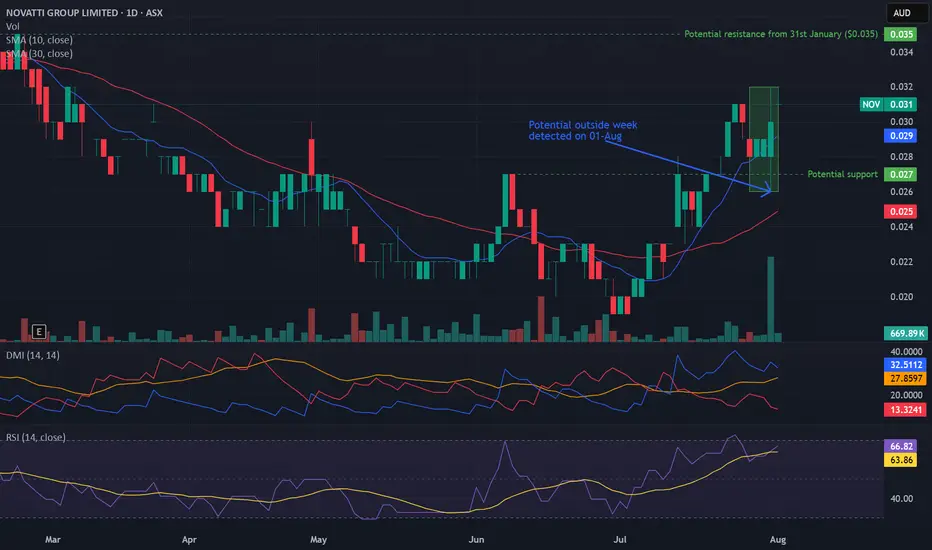
Potential outside week and bullish potential for NOVEntry conditions:
(i) higher share price for ASX:NOV above the level of the potential outside week noted on 31st July (i.e.: above the level of $0.032).
Stop loss for the trade would be:
(i) below the low of the outside week on 31st July (i.e.: below $0.026), should the trade activate.
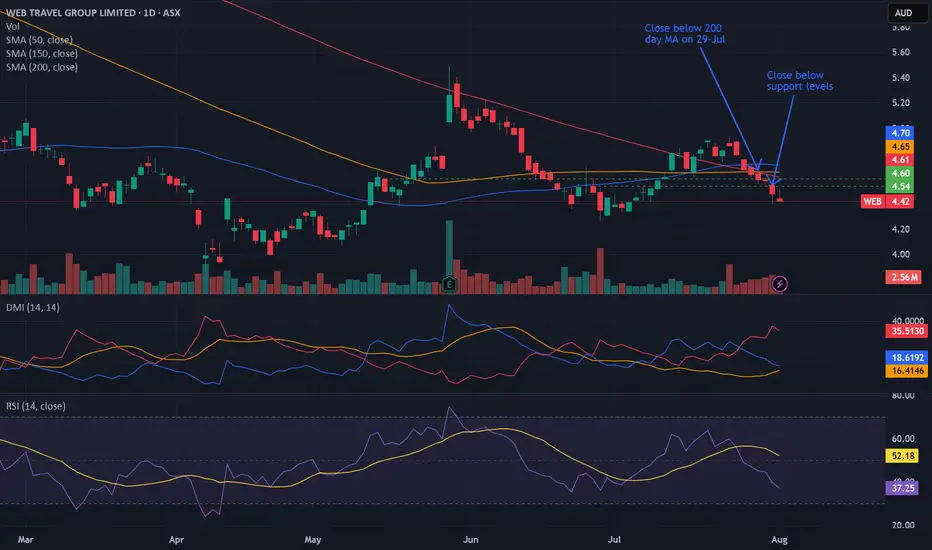
Bearish potential detected for WEBEntry conditions:
(i) lower share price for ASX:WEB along with swing of DMI indicator towards bearishness and RSI downwards, and
(ii) observing market reaction around the share price of $4.54 (open of 26th June).
Stop loss for the trade would be:
(i) above the declining 50 day moving average (currently $4.70), or
(ii) above the low of the candle on 24th July prior to the gap-down prior to the close below the 200 day moving average (i.e. just above $4.78), or
(iii) above the recent swing high on 23rd July (i.e.: above $4.93), depending on risk tolerance.
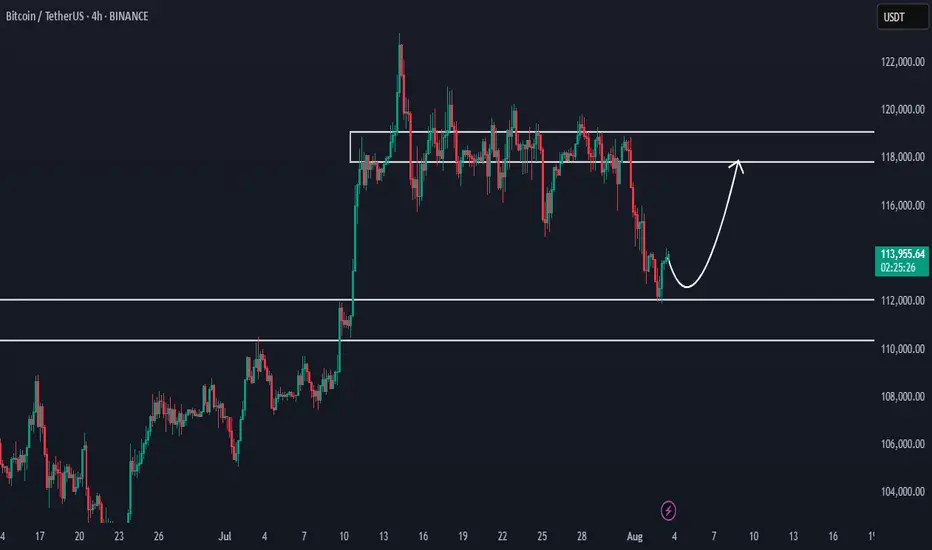
Bitcoin at Key Support - Watching for Bullish ShiftHello everybody!
Bitcoin has reached a very important demand/support zone between 110,000–112,000.
If this area holds, we could see bullish momentum building on the chart.
Currently, we are waiting for confirmations.
We're watching closely for any change in market structure or a trend shift.
If it happens, we can expect the price to move up to around 118,000.
Manage your risk and trade safe!
EURJPY about to enter into a DowntrendRecently EURJPY reached high points in the chart at 173.016
From there it fell and continued downwards.
I took a quick demo trade with an inverse risk to reward. Not the ideal thing to do, but I didn't want to keep my TP higher than 173.016 since we know it's a strong resistance level.
Got a quick win there.
Now, on the 4H, we can see that one huge red candle look out the previous five green candles.
It indicates that selling pressure is incoming.
This would be a good time to sell now. But I do want to see price go below 171.540 just to get that extra confirmation. Just in case, price decides to consolidate or go high for a while.
Have to stay vigilant with this market now.
TP1 will be 171.100.
TP2 will be 170.000
TP3 will be 168.800
Lets see how this trade plays out.

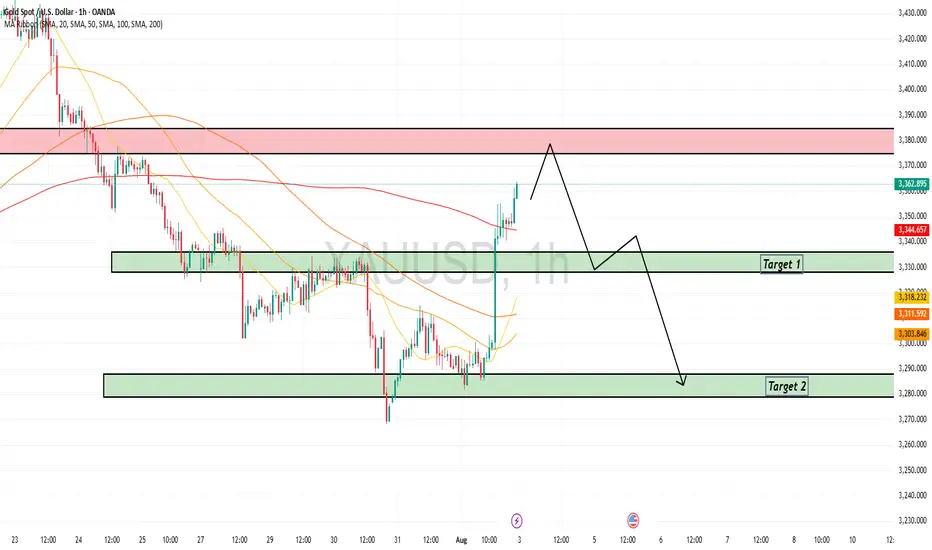
Monday's market forecast and related layout#XAUUSD
Judging from the monthly chart, although July closed with a large positive line, there is still great resistance above 3439-3501. Possible gold price trends for next week are as follows:
1. If gold prices open higher, focus on the previous highs of 3375-3385. If resistance and pressure are encountered, consider shorting, aiming for a volatile decline, retracing Friday's gains.
2. The market is volatile and sideways, so wait and see.
3. Gold fell back. Referring to Friday’s trading strategy, you can consider going long around 3335 to bet on a short-term rebound. Leave yourself some room for participation (the possibility of touching 3338 again and rebounding is not ruled out)

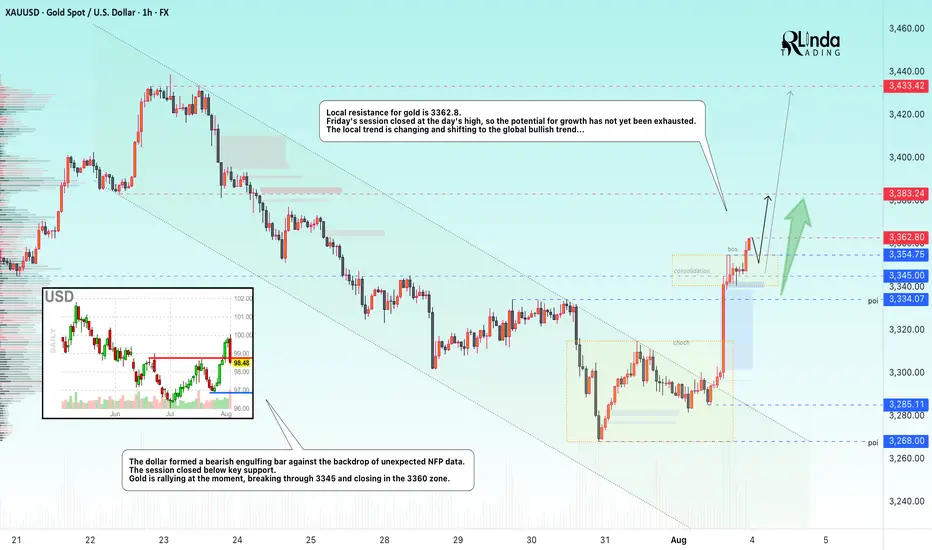
GOLD → The rally following weak NFP data may continueFX:XAUUSD is moving into distribution (rally) on the back of unexpected NFP data released on Friday. The dollar is plummeting...
Fundamentally, the gold market is getting support from an influx of funds after the unexpectedly weak NFP report. Against this backdrop, Trump said that the employment data had been “rigged” to make him look bad...
I believe that the situation is somewhat different: the president's administration failed to control this moment, hoping to see positive dynamics. Powell now has a small trump card to control his actions. The reduction in interest rates will most likely be postponed until the fall.
Technically, on D1, gold is rebounding from the support of the global trading range, forming a local bullish trend that coincides with the global one.
Resistance levels: 3362.8, 3383, 3433
Support levels: 3345, 3334
Gold is exiting the local downward channel, breaking through resistance at 3334 and 3345. Consolidation is forming, and by the end of the session, the price will break through resistance at 3354.75. The market is quite strong. Focus on two levels: 3362.8 and 3354.7. At the opening of the session, the price may attempt to break through the resistance level of 3362.8. If gold consolidates above this level, growth may continue. If not, then before further growth, the market may test the support level...
Best regards, R. Linda!
Patria Investments Limited Quote | Chart & Forecast SummaryKey Indicators On Trade Set Up In General
1. Push Set Up
2. Range Set Up
3. Break & Retest Set Up
Notes On Session
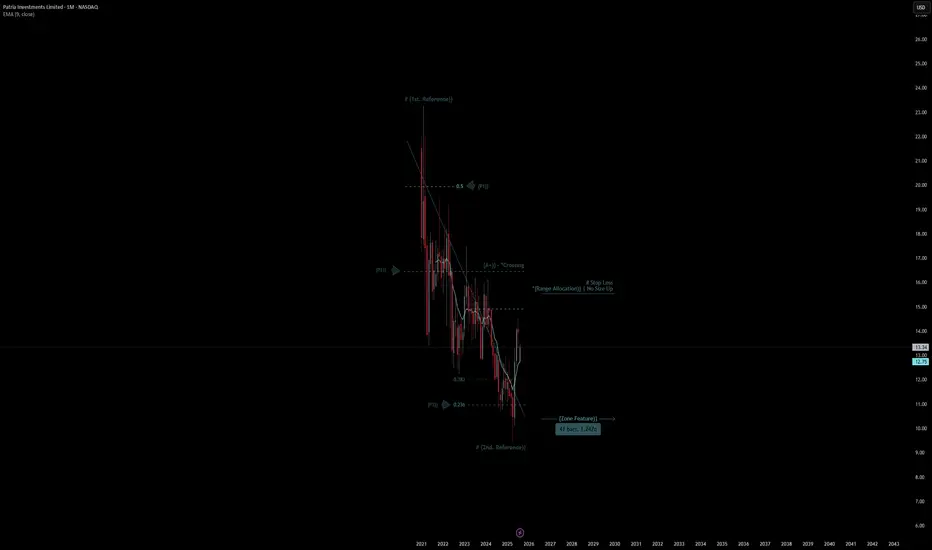
# Patria Investments Limited Quote
- Double Formation
* # (1st. Reference)) At 23.00 USD| Subdivision 1
* (A+)) - *Crossing | Completed Survey
* 41 bars, 1.247d | Date Range Method - *(Downtrend Argument))
- Triple Formation
* (P1)) / (P2)) & (P3)) | Subdivision 2
* Monthly Time Frame | Trend Settings Condition | Subdivision 3
- (Hypothesis On Entry Bias)) | Regular Settings
* Stop Loss Feature Varies Regarding To Main Entry And Can Occur Unevenly
- Position On A 1.5RR
* Stop Loss At 15.00 USD
* Entry At 13.00 USD
* Take Profit At 10.00 USD
* (Downtrend Argument)) & No Pattern Confirmation
- Continuation Pattern | Not Valid
- Reversal Pattern | Not Valid
* Ongoing Entry & (Neutral Area))
Active Sessions On Relevant Range & Elemented Probabilities;
European-Session(Upwards) - East Coast-Session(Downwards) - Asian-Session(Ranging)
Conclusion | Trade Plan Execution & Risk Management On Demand;
Overall Consensus | Sell
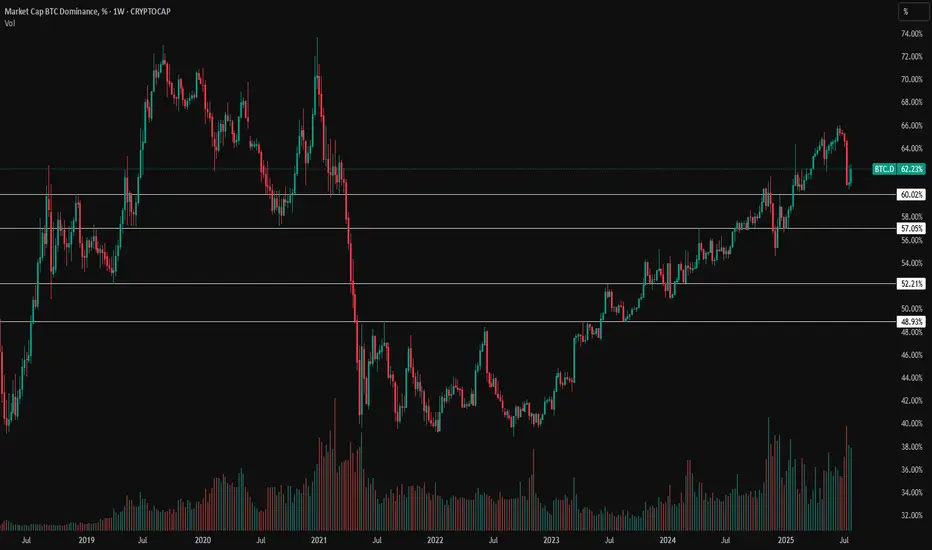
Bitcoin.Dominance Key LevelsThese are the important BTC.D levels we need to be looking at:
60% - ETH will finally break $4k.
60%-57% - ETH all time high
57%-52% - This is the most important range. If we fill this 5% gap, ETH will be at a very nice all time high price which we have been waiting for for years.
53%-49% - ETH continues to pump and at an all time high, I dont know if any further drop in BTC.D will be fueled by mainly just ETH or if we will see a ETH --> midsize marketcap --> small size marketcap rotation of money like we did in the 2021 altseason. If we do fill that 57%-52% gap mentioned above and i see money start to rotate into other coins fueled by euphoria, i will be looking at coins such as GETTEX:QNT , EURONEXT:ALGO , CRYPTOCAP:LINK any many more.
Below 49% - money to be made everywhere, throw your money in and watch it go up 50% in one day. be smart, but there will be opportunities everywhere. dont throw all your money in one place, enjoy euphoria for a bit, but you want to sell while everybody is euphoric and thinks price will never go down.
I'm not saying these levels ARE going to be hit, im just speaking on what I think will happen WHEN these levels DO get hit.
I mostly have my eyes on Ethereum Ecosystem coins, but i also have my eyes on a lot of AI coins. Everybody is investing in AI currently, in 2021 we saw Facebook announce their Metaverse and we saw metaverse coins like INDEX:GALA go up 9x.
Beach Energy (BPT.ASX): Long-Term Compression Near Historical Su📚 Description
This monthly chart of Beach Energy (BPT.ASX) reveals a multi-decade compression pattern forming near historical support levels. With price currently at 1.140 AUD, the setup invites a macro-technical perspective for long-term positioning.
🔍 Key Observations
• Historical Range: Since 1991, BPT has oscillated between deep cyclical lows and explosive rallies, often tied to oil price cycles and domestic energy policy.
• Compression Zone: Price action since 2011 shows tightening volatility, forming a descending triangle with support around 1.10–1.15 AUD.
• Volume Profile: Recent monthly candles show declining volume, suggesting accumulation rather than distribution.
• Oscillators:• Momentum indicators (values: 50.97, 44.32, 15.76) show divergence — a potential early signal of reversal.
• Red and blue lines suggest a crossover setup forming, historically a precursor to trend shifts.
🌏 Macroeconomic Angle
Australia’s energy sector is undergoing a structural shift, and Beach Energy sits at the intersection of several key trends:
🛢️ Oil Price Trends
• Global oil prices remain volatile, but long-term supply constraints and geopolitical tensions (e.g., Middle East, Russia) support elevated price floors.
• BPT’s historical rallies often coincide with Brent crude surges — a macro tailwind worth monitoring.
🚢 LNG Export Dynamics
• Australia is one of the world’s top LNG exporters, and demand from Asia (Japan, South Korea, China) continues to grow.
• Beach Energy’s exposure to domestic gas and LNG infrastructure positions it to benefit from rising export volumes and favorable pricing contracts.
• Government policy shifts toward energy security and decarbonization may further support domestic producers.
📈 Inflation & Rate Cycles
• As central banks pivot from tightening to neutral or easing, energy equities often outperform due to their inflation-hedging characteristics.
• BPT’s low valuation and asset base make it a potential beneficiary of capital rotation into hard assets.
---
🧠 Educational Insight
This chart is a textbook example of long-term compression in commodity-linked equities. Traders and investors can use this to:
• Understand how macro cycles (e.g., oil prices, energy demand) reflect in equity price structure.
• Apply monthly timeframe analysis to filter out noise and identify strategic entry zones.
• Combine volume, oscillator divergence, and price structure for higher conviction setups.
🛠️ Potential Strategy
• Watch for breakout above descending resistance (~1.20 AUD) with volume confirmation.
• Risk management: Stop below historical support (~1.05 AUD).
• Target zones: 1.40 AUD (swing), 1.80 AUD (macro breakout).
Not financial advice.

BP/JPY: Strong Bullish Reversal from DemandThe GBP/JPY currency pair has exhibited a strong bullish reversal from a key demand zone, indicating renewed bullish momentum. This pair continues to follow the broader bullish bias observed in GBP crosses, with the Japanese yen (JPY) weakness primarily driven by the Bank of Japan's (BoJ) dovish policy stance.
Technical Analysis (4H Chart)
Upon examining the 4-hour chart, a clear pattern emerges. The pair has demonstrated a bullish rejection from the 195.30-195.50 demand zone, signifying a potential shift in market sentiment. Currently, the pair is trading at 195.58, rebounding from strong support and setting up for a potential upward leg.
Projection
Given the current technical setup, the projection suggests that as long as the 195.34 level holds, GBP/JPY could push toward 197.31, with potential for 199.72 if GBP strength persists. This outlook is contingent upon the pair maintaining its bullish momentum and breaching key resistance levels.
Fundamental Analysis
The fundamental analysis reveals a bullish bias, driven by several key factors:
1. GBP: Supported by BOE's cautious but tight stance: The Bank of England's (BOE) cautious but tight monetary policy stance, driven by persistent inflation pressures, provides support for the GBP.
2. JPY: Remains fundamentally weak: The JPY remains fundamentally weak due to the BoJ's dovish policy stance and avoidance of major policy tightening. Intervention threats only provide short-term support.
3. Risk Sentiment: Mild risk-on conditions favor GBP: Mild risk-on conditions in the market favor the GBP over the safe-haven JPY, further supporting the bullish bias.
Risks
Two primary risks are identified:
1. BoJ FX intervention: BoJ FX intervention could temporarily strengthen the JPY, potentially disrupting the bullish trend.
2. Dovish BOE shift: A dovish shift in the BOE's policy stance could slow GBP momentum, undermining the bullish outlook.

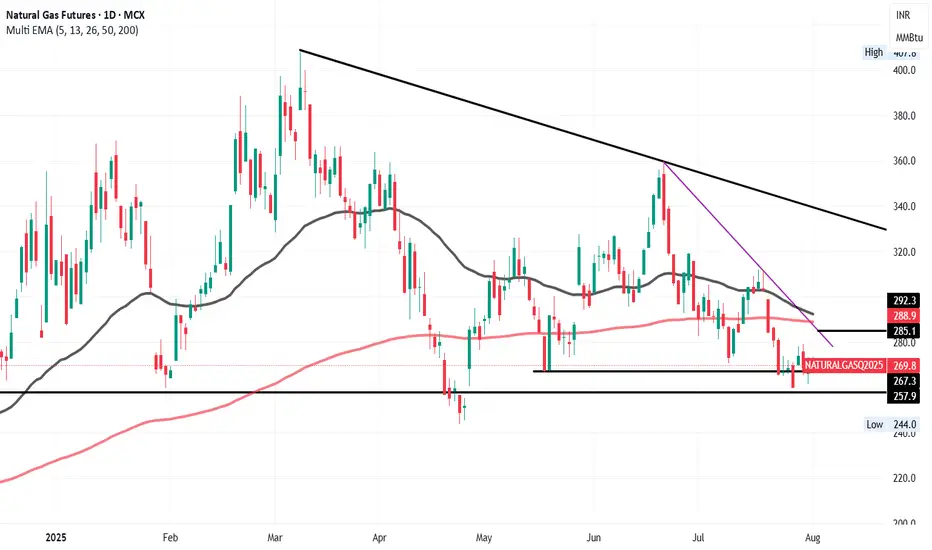
Natural Gas – Bullish Rebound Expected Towards 285–288Natural Gas is currently showing signs of a short-term bounce after testing key support around the 267–258 zone. My view remains bullish in the short term with potential upside toward 285–288, which aligns with the downward purple trendline and both the 50 EMA (around 292.3) and 200 EMA (around 288.9). This confluence zone is expected to act as strong resistance.
Once the price reaches that level, I’ll look for bearish confirmation to re-enter short positions, in line with the broader downtrend marked by the falling black trendline.
📌 Levels to watch:
Support: 267 / 258
Resistance: 285–288 (EMA + trendline)
BTC/USD Ready to Explode?Watch 116,990 & 120,160 Breakout Zones!Massive move loading on BTC!
Price is trapped in a tight consolidation zone — breakout above 120,160 = 🚀 to 130,400, while a break below 116,990 = 💀 down to 108,270.
Waiting for 2 daily candle confirmations before entering . Stay sharp — this breakout could set the next major trend.

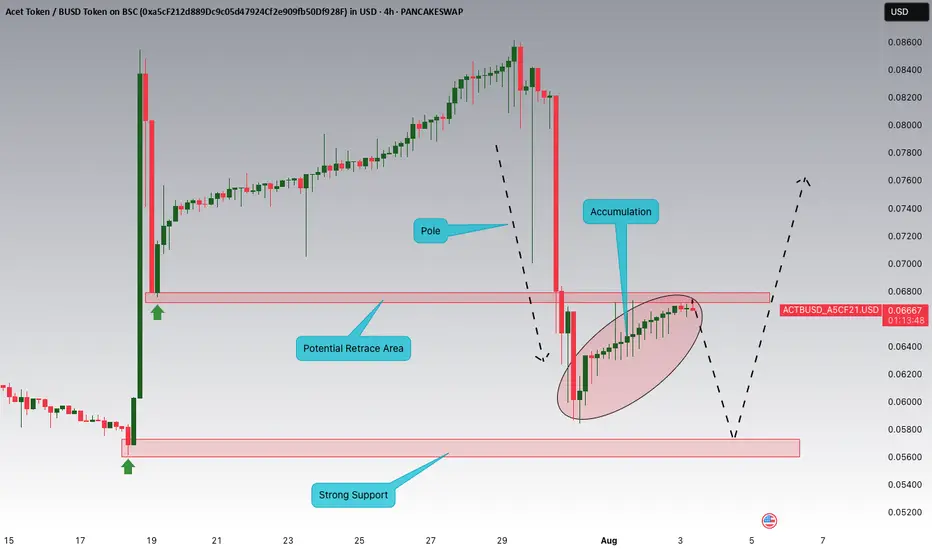
ACTBUSD Breakout and Potential RetraceHey Traders, above is a technical overview on ACTBUSD and the most important zones to watch.
USDJPY Potential UpsidesHey Traders, in tomorrow's trading session we are monitoring USDJPY for a buying opportunity around 147.000 zone, USDJPY is trading in an uptrend and currently is in a correction phase in which it is approaching the trend at 147.000 support and resistance area.
Trade safe, Joe.

GBPCHF is in the Selling from ResistanceHello Traders
In This Chart GBPCHF HOURLY Forex Forecast By FOREX PLANET
today GBPCHF analysis 👆
🟢This Chart includes_ (GBPCHF market update)
🟢What is The Next Opportunity on GBPCHF Market
🟢how to Enter to the Valid Entry With Assurance Profit
This CHART is For Trader's that Want to Improve Their Technical Analysis Skills and Their Trading By Understanding How To Analyze The Market Using Multiple Timeframes and Understanding The Bigger Picture on the Charts

NZDUSD is in the Selling DirectionHello Traders
In This Chart NZDUSD HOURLY Forex Forecast By FOREX PLANET
today GBPUSD analysis 👆
🟢This Chart includes_ (NZDUSD market update)
🟢What is The Next Opportunity on NZDUSD Market
🟢how to Enter to the Valid Entry With Assurance Profit
This CHART is For Trader's that Want to Improve Their Technical Analysis Skills and Their Trading By Understanding How To Analyze The Market Using Multiple Timeframes and Understanding The Bigger Picture on the Charts

GBPCAD is in the bearish directionHello Traders
In This Chart gbpcad HOURLY Forex Forecast By FOREX PLANET
today GBPCAD analysis 👆
🟢This Chart includes_ (GBPCAD market update)
🟢What is The Next Opportunity on GBPCAD Market
🟢how to Enter to the Valid Entry With Assurance Profit
This CHART is For Trader's that Want to Improve Their Technical Analysis Skills and Their Trading By Understanding How To Analyze The Market Using Multiple Timeframes and Understanding The Bigger Picture on the Chart

Silver is in the Bearish trend after testing ResistanceHello Traders
In This Chart XAGUSD HOURLY Forex Forecast By FOREX PLANET
today XAGUSD analysis 👆
🟢This Chart includes_ (XAGUSD market update)
🟢What is The Next Opportunity on XAGUSD Market
🟢how to Enter to the Valid Entry With Assurance Profit
This CHART is For Trader's that Want to Improve Their Technical Analysis Skills and Their Trading By Understanding How To Analyze The Market Using Multiple Timeframes and Understanding The Bigger Picture on the Charts

GBPUSD is in the Selling Direction after Testing ResistanceHello Traders
In This Chart GBPUSD HOURLY Forex Forecast By FOREX PLANET
today GBPUSD analysis 👆
🟢This Chart includes_ (GBPUSD market update)
🟢What is The Next Opportunity on GBPUSD Market
🟢how to Enter to the Valid Entry With Assurance Profit
This CHART is For Trader's that Want to Improve Their Technical Analysis Skills and Their Trading By Understanding How To Analyze The Market Using Multiple Timeframes and Understanding The Bigger Picture on the Charts

GBPJPY is Holding above the SupportHello Traders
In This Chart GBPJPY HOURLY Forex Forecast By FOREX PLANET
today GBPJPY analysis 👆
🟢This Chart includes_ (GBPJPY market update)
🟢What is The Next Opportunity on GBPJPY Market
🟢how to Enter to the Valid Entry With Assurance Profit
This CHART is For Trader's that Want to Improve Their Technical Analysis Skills and Their Trading By Understanding How To Analyze The Market Using Multiple Timeframes and Understanding The Bigger Picture on the Charts

Natural Gas is in the Buying DirectionHello Traders
In This Chart NATGAS HOURLY Forex Forecast By FOREX PLANET
today NATGAS analysis 👆
🟢This Chart includes_ (NATGAS market update)
🟢What is The Next Opportunity on NATGAS Market
🟢how to Enter to the Valid Entry With Assurance Profit
This CHART is For Trader's that Want to Improve Their Technical Analysis Skills and Their Trading By Understanding How To Analyze The Market Using Multiple Timeframes and Understanding The Bigger Picture on the Charts

Gold is in the Bearish Direction after Formation ManipulationHello Traders
In This Chart GOLD HOURLY Forex Forecast By FOREX PLANET
today Gold analysis 👆
🟢This Chart includes_ (GOLD market update)
🟢What is The Next Opportunity on GOLD Market
🟢how to Enter to the Valid Entry With Assurance Profit
This CHART is For Trader's that Want to Improve Their Technical Analysis Skills and Their Trading By Understanding How To Analyze The Market Using Multiple Timeframes and Understanding The Bigger Picture on the Charts