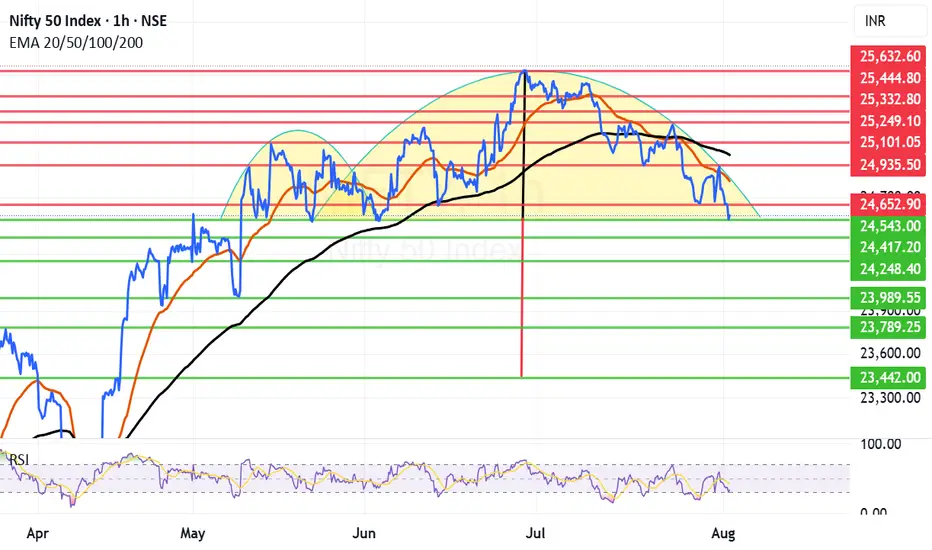
Reverse cup and Handle kind of structure formed in NiftyIn the short term time frame Nifty is seen to be forming reverse cup and handle kind of structure this is considered very bearish structure. However for this bear fest to manifest Nifty needs to close below 24543 or 24417. These 2 levels can save Nifty if not we will see it going into the bear grip.
Thus the most important supports for Nifty remain at 24543 and 24417. Below this level the supports for Nifty will be at 24248, 23989, 23789 and finally major support are is near 23442.
Important resistance areas for Nifty remain at 24652, 24821 (Mother Line Resistance), 24935, 25011 (Father Line Resistance), 25101 and finally 25249. Above 25249 Bulls can become very active.
Till the trade deal chess board and Tariffs do not relent or there is some other very important positive news Nifty will remain under pressure. Let us hope that 24253 or 24417 save us. Long term outlook on Nifty still remains positive. Long term investors should look at the tariff related event as a news that will slowly subside and give way to the Bullish outlook which has been prevailing in the market for decades all together.
Disclaimer: The above information is provided for educational purpose, analysis and paper trading only. Please don't treat this as a buy or sell recommendation for the stock or index. The Techno-Funda analysis is based on data that is more than 3 months old. Supports and Resistances are determined by historic past peaks and Valley in the chart. Many other indicators and patterns like EMA, RSI, MACD, Volumes, Fibonacci, parallel channel etc. use historic data which is 3 months or older cyclical points. There is no guarantee they will work in future as markets are highly volatile and swings in prices are also due to macro and micro factors based on actions taken by the company as well as region and global events. Equity investment is subject to risks. I or my clients or family members might have positions in the stocks that we mention in our educational posts. We will not be responsible for any Profit or loss that may occur due to any financial decision taken based on any data provided in this message. Do consult your investment advisor before taking any financial decisions. Stop losses should be an important part of any investment in equity.
Support and Resistance
#SOL Update #7 – Aug 02, 2025#SOL Update #7 – Aug 02, 2025
Solana has broken below the low of its last impulsive move, forming a new, deeper bottom. The first area where it may find support is the $158 level. If this fails, the next support level lies at $147. At the moment, Solana is clearly in a downtrend on the 4-hour chart. For Solana to resume its upward movement and confirm a trend reversal, it needs to break above the $206 level with a strong, high-volume candle. Currently, Solana might be considered a cheap opportunity only for those looking to hold spot positions long-term. Otherwise, I don't see it as a suitable option for trading.

#ETH Update #6 – Aug 02, 2025#ETH Update #6 – Aug 02, 2025
Although Ethereum may seem like it has dropped significantly, it still hasn’t completed the correction of its last impulsive move. If we are to say a proper correction is happening, Ethereum must pull back to the $3,300 zone. If it continues upward without reaching this level, the risk of a deeper retracement increases. That’s why it would be much healthier for Ethereum to extend this pullback and complete the correction around $3,300.
If this correction is completed, the next target will be around $4,450. There is also an imbalance zone around $3,300, and since the price is already close, it might aim to fill that as well — possibly even reaching down to the $3,200 level. Contrary to much of the current market sentiment, Ethereum is heading toward a correction in a very healthy manner, and I believe completing this move would be the best scenario.

#BTC Update #14 – Aug 02, 2025#BTC Update #14 – Aug 02, 2025
Unfortunately, Bitcoin has closed below its current channel and now appears to be retesting that level. If this retest confirms, I expect a pullback down to the $110,000 zone. However, if Bitcoin manages to re-enter the channel, its first target will be $118,800. Although it’s a descending channel, moving within it suggests a relatively stable market. Closing below it may not end well and could deepen the retracement. That's why I recommend caution with all coins right now.
Even though it seems like a distant possibility at the moment, don’t forget there’s also an imbalance zone around the $103,500 level. A sharp wick or a significant drop could bring Bitcoin back to revisit that area. The probability is currently low, but it can’t be ruled out completely. I don’t recommend rushing into any long or short positions at this stage.

Nifty levels - Jul 04, 2025Nifty support and resistance levels are valuable tools for making informed trading decisions, specifically when combined with the analysis of 5-minute timeframe candlesticks and VWAP. By closely monitoring these levels and observing the price movements within this timeframe, traders can enhance the accuracy of their entry and exit points. It is important to bear in mind that support and resistance levels are not fixed, and they can change over time as market conditions evolve.
The dashed lines on the chart indicate the reaction levels, serving as additional points of significance to consider. Furthermore, take note of the response at the levels of the High, Low, and Close values from the day prior.
We hope you find this information beneficial in your trading endeavors.
* If you found the idea appealing, kindly tap the Boost icon located below the chart. We encourage you to share your thoughts and comments regarding it.
Wishing you success in your trading activities!

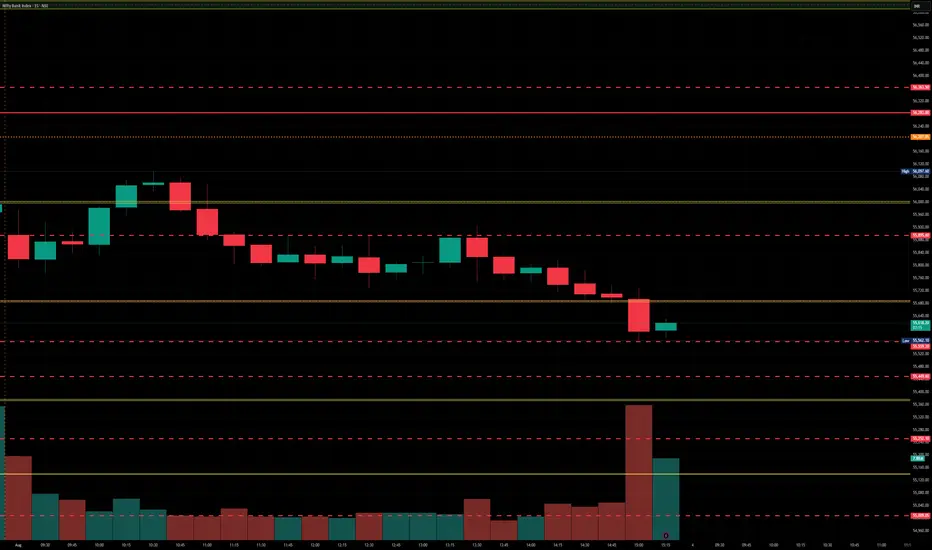
BankNifty levels - Jul 04, 2025Utilizing the support and resistance levels of BankNifty, along with the 5-minute timeframe candlesticks and VWAP, can enhance the precision of trade entries and exits on or near these levels. It is crucial to recognize that these levels are not static, and they undergo alterations as market dynamics evolve.
The dashed lines on the chart indicate the reaction levels, serving as additional points of significance. Furthermore, take note of the response at the levels of the High, Low, and Close values from the day prior.
We trust that this information proves valuable to you.
* If you found the idea appealing, kindly tap the Boost icon located below the chart. We encourage you to share your thoughts and comments regarding it.
Wishing you successful trading endeavors!
BTCUSDT: Elliot Wave AnalysisAs you can see in the chart, the fourth wave has ended and there is a possibility of an increase in the next stage to the level between 128,000 and 131,000, followed by a correction for a larger fourth wave and finally the last leg of the increase to the fifth wave, which has the possibility of reaching 139,000 to 140,000.

Learning#04 : PDH & PDL🎯 Learning#04 : PDH & PDL
- The 2 Levels Every Intraday Trader Must Watch
Turn Yesterday’s Levels into Today’s Profits – PDH/PDL Playbook
In intraday trading, simplicity often beats complexity.
You don’t always need fancy indicators, dozens of lines, or complicated systems. Sometimes, two levels are all it takes to stay in sync with the market:
👉 Previous Day’s High (PDH)
👉 Previous Day’s Low (PDL)
These levels may look basic, but they carry psychological weight and often mark where real action — and opportunity — unfolds.
Let’s break it down into a practical strategy you can start using as early as tomorrow morning 👇
🧠 What Are PDH and PDL?
PDH = The highest price the market reached yesterday
PDL = The lowest price the market reached yesterday
That’s it. No calculations. No indicators. Just two simple levels from the previous session.
But here’s why they matter:
They’re visible to everyone — retail traders, institutional desks, even algo systems. These are “memory zones” where the market often reacts — bouncing, breaking, or trapping traders in fakeouts.
Think of them as psychological boundaries.
When price approaches these levels, traders ask:
“Will it break or bounce?”
That hesitation — that moment of decision — is your opportunity.
⚡ Why These Levels Work So Well
✅ They’re objective — no subjectivity involved. Anyone can mark them.
✅ They’re reaction zones — price often stalls, breaks, or rejects here.
✅ They reflect sentiment — how price behaves around them reveals market strength or weakness.
PDH and PDL often act like turning points — or springboards for continuation. The key is in reading how price behaves when it gets there.
📊 3 Smart Ways to Trade Around PDH/PDL
Let’s look at three powerful setups based on how price behaves near these levels:
1️⃣ Rejection at PDH or PDL (Classic Reversal)
This is the simplest setup — and one of the most effective.
When price tests PDH or PDL but fails to break, it often leaves signs:
Long upper/lower wicks
Rejection candles (like pin bars or inside bars)
Sudden volume drop
💡 Example:
Nifty rallies to PDH at 22,180, prints a long upper wick, then forms a red candle closing below. That’s a reversal clue.
You could enter short below the rejection candle, with a stop just above the high and a target near VWAP or mid-range.
🎯 Why this setup works: Tight risk. Logical context. High clarity.
2️⃣ Breakout and Retest (Trend Continuation)
If price breaks through PDH/PDL with strength, don’t chase it.
Wait for price to pull back and retest the level.
If PDH was broken, wait for a bullish retest — former resistance becomes support.
If PDL was broken, wait for a bearish retest — former support becomes resistance.
💡 Example:
BankNifty breaks PDH, pulls back, then prints a bullish engulfing candle right at the level — confirmation to go long.
📌 This setup works best on trending days and offers cleaner entries than chasing breakouts.
3️⃣ The Failed Breakout (Trap Setup)
One of the most high-probability setups — and one that traps many.
Here’s how it plays out:
Price breaks PDH/PDL
But immediately snaps back inside the range
Traders who chased the breakout are now trapped
💡 Signal to watch:
A candle closes above PDH, followed by a candle that closes back below — that’s your short signal. Reverse for long setups around PDL.
🚨 Even more effective when the breakout happens on low volume — no real conviction behind the move.
🔧 Tools That Amplify These Setups
These setups work great with a clean chart — but a few tools can boost your edge:
VWAP: Check if price is extended or supported near PDH/PDL. When VWAP aligns with these levels — confluence zone!
Candlestick patterns: Look for pin bars, inside bars, or engulfing patterns at the level.
Opening range: If price breaks PDH/PDL early in the day,
especially within the first 30 minutes, it signals directional intent.
Volume: Strong breakouts need volume. Weak volume = likely fakeout.
🔑 Remember: You don’t trade the level — you trade the reaction at the level.
✅ Why This Simple Strategy Works
Don’t underestimate the power of PDH and PDL. These levels:
Show where emotions exist — greed and fear often play out here.
Create natural reaction zones — ideal spots for clean entries and exits.
Let you trade with structure, not guesswork.
Instead of chasing price all day, do this:
Mark PDH and PDL
Wait for price to approach the zone
Watch how it behaves
React with a plan — not emotion
✨ Simple, repeatable, and highly effective — if you stay patient and disciplined.
✍️ Final Thoughts
In a world full of overcomplicated strategies, PDH/PDL trading is a refreshing reminder that clarity often comes from simplicity.
These levels won’t give you 10 trades a day — but they will give you high-quality, context-driven opportunities that align with how real price and volume work.
See you in the next one — and until then:
Keep it simple. Trade with structure. Trust the levels.
— Kiran Zatakia

SILVER (XAGUSD): More Growth Ahead
It looks like Silver is going to continue growing next week,
following a strong bullish reaction to a key daily horizontal support.
The next strong resistance is 3748.
It will be the next goal for the buyers.
❤️Please, support my work with like, thank you!❤️
I am part of Trade Nation's Influencer program and receive a monthly fee for using their TradingView charts in my analysis.

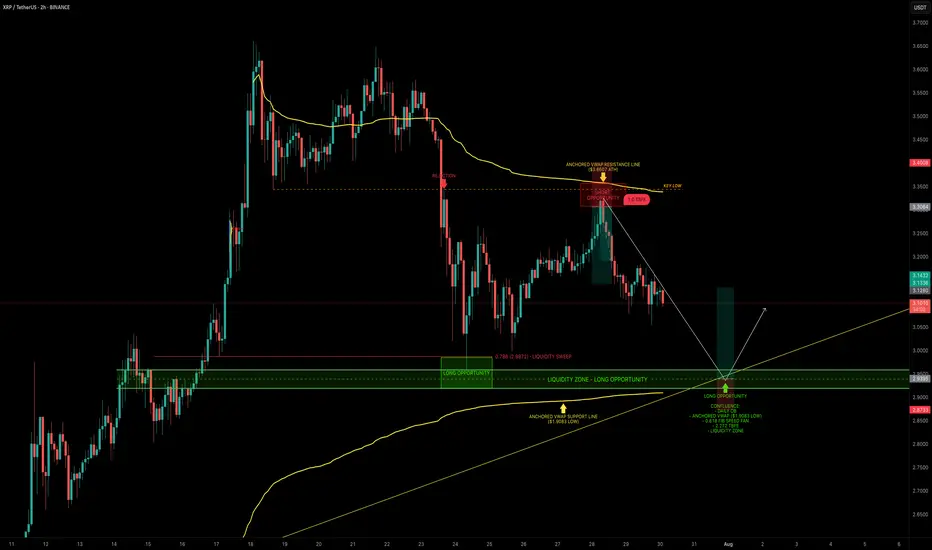
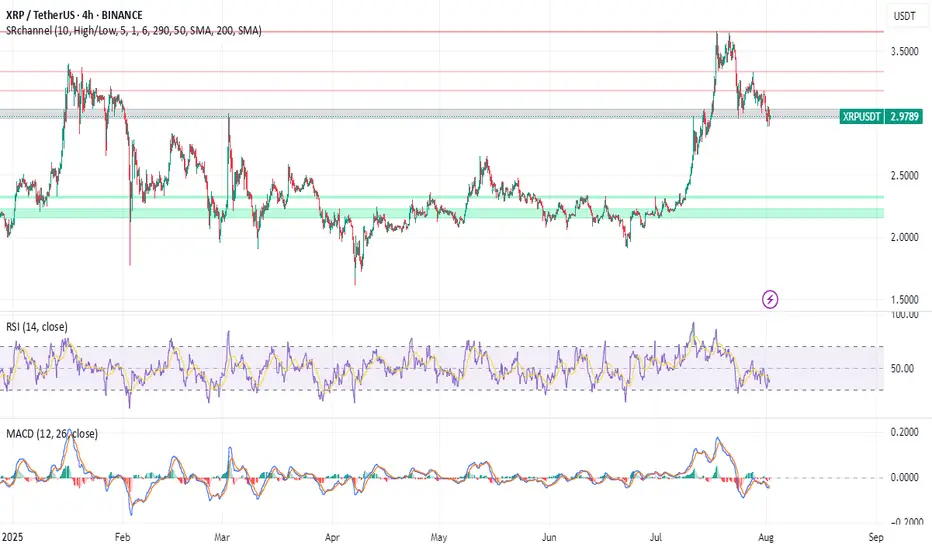
XRP — Mapping Out the Next High-Probability Long SetupXRP continues to respect key levels, delivering clean setups and strong technical reactions.
📉 Recent Price Action Recap
After the flush from $3.65 into the $3.00 support zone, XRP printed a solid bounce back toward the $3.30 resistance area, forming a clean short setup between $3.30–$3.35.
Price is now trading mid-range within the 6-day consolidation.
🟢 Next High-Probability Long Setup
A prime long opportunity lies between $2.96 and $2.9175 sitting within a key daily order block.
Confluence at this zone includes:
Liquidity pool just below the $2.9555 swing low
Anchored VWAP from the $1.9083 swing low resting just under the block
0.618 Fib Speed Fan lining up as dynamic support (July 30 – Aug 2)
2.272 Trend-Based Fib Extension at $2.9297
📈 Long Trade Setup
Entry Zone: $2.96 – $2.9175
Stop Loss: Below anchored VWAP (clear invalidation)
Target: $3.1/$3.13+
R:R: ~1:3+
💡 Educational Insight
This setup is a great example of how multiple tools layered together (like Fibonacci levels, VWAPs, order blocks and liquidity zones) can significantly increase the probability of a trade playing out.
When structure, volume-based tools and time alignment all point to the same area, it creates a high-confluence trade zone. These are the areas where risk is most defined and reward is most favourable, a principle every technical trader should anchor their strategy around.
_________________________________
💬 If you found this helpful, drop a like and comment!
Want breakdowns of other charts? Leave your requests below.
EUR_USD POTENTIAL SHORT|
✅EUR_USD has been growing recently
And the pair seems locally overbought
So as the pair is approaching
A horizontal resistance of 1.1632
Price decline is to be expected
SHORT🔥
✅Like and subscribe to never miss a new idea!✅
Disclosure: I am part of Trade Nation's Influencer program and receive a monthly fee for using their TradingView charts in my analysis.

SILVER WILL FALL|SHORT|
✅SILVER is going up now
But a strong resistance level is ahead at 37,60$
Thus I am expecting a pullback
And a move down towards the target of 36,69$
SHORT🔥
✅Like and subscribe to never miss a new idea!✅
Disclosure: I am part of Trade Nation's Influencer program and receive a monthly fee for using their TradingView charts in my analysis.

BTC 108K - 112K ZONE Why 108k to 112k zone is important?
Bitcoin recently made a new all-time high and is now undergoing a healthy correction — nothing to worry about.
The $108,000 to $112,000 zone is a key support area due to three major factors:
1. Strong previous support level
2. A daily trendline aligning with this zone
3. 50% Fibonacci retracement of the recent impulse move
If this support holds, there's a strong possibility Bitcoin will form a new ATH around $130,000 to $140,000.
DON'T PANIC wait for confirmation and see the magic 🚀 🚀

GOLD Short From Resistance! Sell!
Hello, Traders!
GOLD surged up sharply
On Friday and is already
Retesting the horizontal
Resistance of 3377$
From where we will be
Expecting a local pullback
On Monday as Gold
Is locally overbought
Sell!
Comment and subscribe to help us grow!
Check out other forecasts below too!
Disclosure: I am part of Trade Nation's Influencer program and receive a monthly fee for using their TradingView charts in my analysis.

CAD_JPY BEARISH BREKAOUT|SHORT|
✅CAD_JPY broke the key structure level of 107.400
While trading in an local downtrend
Which makes me bearish
And I think that after the retest of the broken level is complete
A rebound and bearish continuation will follow
SHORT🔥
✅Like and subscribe to never miss a new idea!✅
Disclosure: I am part of Trade Nation's Influencer program and receive a monthly fee for using their TradingView charts in my analysis.

Learning#03 : VWAP in Intraday TradingLearning#03 : VWAP in Intraday Trading
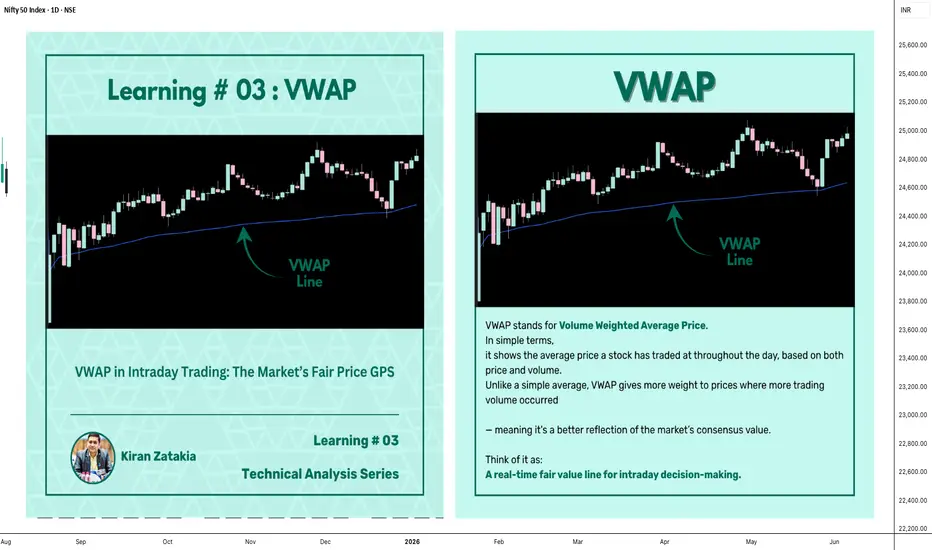
📊 VWAP in Intraday Trading: The Market’s Fair Price GPS
Ever wondered if there’s a level that shows where the real trading action is happening? That’s exactly what VWAP does — it’s like a volume-weighted compass that intraday traders use to orient themselves in the market.
It’s not just another line on your chart. VWAP reflects where institutions and volume-heavy participants are active. That’s why understanding how price interacts with it can give you a serious edge.
Let’s break it down 👇
🧠 What is VWAP?
VWAP stands for Volume Weighted Average Price.
In simple terms, it shows the average price a stock has traded at throughout the day, based on both price and volume.
Unlike a simple average, VWAP gives more weight to prices where more trading volume occurred — meaning it's a better reflection of the market’s consensus value.
Think of it as:
A real-time fair value line for intraday decision-making.
📈 Why VWAP Matters for Intraday Traders
VWAP acts as an intraday anchor. It tells you whether the price is currently trading above or below the day’s volume-weighted average — giving you quick insight into who's in control.
Here’s how to interpret it:
When price is above VWAP, buyers are in control and the bias is bullish.
When price is below VWAP, sellers are dominating and the bias is bearish.
When price is hovering near VWAP, the market is undecided, consolidating, or lacking direction.
In short, VWAP tells you who’s winning the intraday tug of war — and whether it’s even worth stepping in.
⚙️ How to Use VWAP in Your Intraday Strategy
1️⃣ VWAP as a Trend Filter
Before entering a trade, check where price is relative to VWAP:
Price above VWAP with higher lows → Focus on long setups
Price below VWAP with lower highs → Focus on short setups
🔁 Skip counter-trend trades. Stay with the flow.
This helps in trending markets by keeping you aligned with momentum.
2️⃣ VWAP as Dynamic Support or Resistance
VWAP behaves like a magnet. Price often pulls back to it and either:
Rejects (respects the level as support/resistance), or
Breaks and reclaims (signaling a potential reversal)
Use it alongside:
Flag patterns
Inside bars
Break-and-retest structures
3️⃣ VWAP Reversion Play (Snapback Trade)
This is a mean-reversion setup:
Price moves quickly away from VWAP at open
No strong follow-through, signs of exhaustion
Take a counter-trend trade back to VWAP
⚠️ Avoid this in strong trending markets — best used in choppy or fading environments.
4️⃣ VWAP with Price Action for Structure
Pair VWAP with clean price action:
Mark support and resistance zones
Observe price behavior near VWAP
Look for confirmation: inside bars, rejection wicks, engulfing candles
🎯 This adds logic and clarity to your entries — no random trades.
🔍 Bonus VWAP Tips
Combine VWAP with:
CPR (Central Pivot Range) for confluence zones
Opening range for breakout bias
Volume profile to spot high interest areas
These combos create strong, repeatable trade setups.
✅ VWAP Recap: Why It Matters
Here’s a quick breakdown of how VWAP can sharpen your intraday trading game:
Bias Building: VWAP helps confirm whether the market structure is bullish or bearish, giving you a reliable directional bias.
Trend Filtering: It keeps you aligned with the current momentum by filtering out counter-trend trades.
Pullback Entries: VWAP acts as a dynamic support or resistance level, offering clean zones to enter trades during pullbacks.
Mean Reversion: In sideways or fading markets, VWAP becomes a natural magnet — allowing you to target price reversions.
Risk Management: It provides logical reference points for placing stop-losses and defining entry zones, adding clarity to your risk-reward planning.
✍️ Final Thoughts
VWAP may sound simple, but it brings real structure to intraday trading.
It tells you where volume met price, and that’s powerful. When used with price action, it creates a solid framework for:
Building directional bias
Finding clean entries
Managing risk like a pro
VWAP doesn’t predict — it reflects. And in trading, reflection is more useful than prediction.
🛎️ Respect VWAP. Trade with structure.
— Kiran Zatakia
XRP Price Prediction: Is a Breakout to $15 Imminent? XRP Breakout Targets $15 — Analyst Says 'This Is Just The Start': Is XRP Set to Explode?
The cryptocurrency world is once again turning its attention to XRP, the token developed by Ripple Labs, as bullish analysts predict an imminent and explosive rally. After a strong run-up earlier in 2025, XRP has pulled back slightly and is now approaching a critical support zone. Some analysts are now calling for a $15 breakout target, even as the token hovers near $2.80, a level many see as a pivotal point for the next leg of the bull market.
Let's dive into the latest developments, technical analysis, and market sentiment surrounding XRP — and why some believe "this is just the start."
XRP Price Overview: Current Positioning
As of early August 2025, XRP is trading around the $2.85 mark, down from its recent high near $3.70. While this pullback may concern short-term traders, technical analysts argue that this retracement is healthy and necessary for the formation of a higher low, a common pattern in bullish market structures.
The key price levels to watch include a support zone between $2.80 and $2.95, resistance at $3.70, downside risk to $2.20 if $2.80 fails, and upside targets of $5 in the short term and $15 in the mid-term.
Why $2.80 Is So Important
The $2.80 support level is emerging as a make-or-break price zone. It aligns with multiple technical indicators including the 0.618 Fibonacci retracement from the previous rally, the Value Area High (VAH) from recent price accumulation zones, and Higher Time Frame (HTF) structure showing consistent support around this level in recent months.
If XRP manages to hold this level and establish a higher low, it could kick off a new bullish wave, potentially targeting $5 in the short term and beyond in the medium term.
Analysts Call for $15 XRP — Is It Possible?
Several key factors support the bull case. Institutional interest continues to grow as Ripple's partnerships with banks and financial institutions support long-term utility. Legal clarity has improved significantly after years of regulatory uncertainty, with the SEC lawsuit largely resolved, removing a major overhang. Technical indicators including bullish divergence on the RSI, MACD bullish crossover, and increasing volume all support upward momentum. Additionally, as Bitcoin stabilizes, funds are flowing into major altcoins, including XRP, as part of the typical altcoin rotation cycle.
August Rally Incoming? Bullish Divergence Signals 20% Upside
Technical analysts have identified a bullish divergence forming on the daily and 4-hour charts — a classic signal that often precedes a strong move upward. This divergence appears as the price makes lower lows while the RSI makes higher lows, suggesting momentum is shifting in favor of the bulls.
If confirmed, this divergence could catalyze a 20% rally in August, potentially pushing XRP back above $3.40 and testing the critical $3.70 resistance. A clean break above this level would likely open the floodgates for further gains.
$3.70: The Gatekeeper to Higher Highs
While there's excitement around the potential for XRP to hit $5 or even $15, the path forward must first go through $3.70. This resistance level has stalled price action multiple times in 2025 and will likely serve as a psychological and technical barrier.
Two scenarios are possible: a break above $3.70 would open the door to $5 and $7 targets quickly, while a rejection at $3.70 could lead to a pullback toward $2.20, especially if $2.80 fails.
Traders Hedge With New XRP Rival: Remittix
As XRP consolidates, some traders are diversifying their holdings into Remittix (RTX), a new cross-border payments token that promises enhanced scalability and compliance tools. RTX has gained traction recently, especially among DeFi-native traders seeking alternatives to XRP's centralized development model.
Remittix highlights include strong tokenomics with a deflationary model and staking rewards, a real-world use case targeting remittance markets in Asia and Africa, and a PayFi Wallet with beta slated for launch in Q3 2025, offering seamless integration with fiat on/off ramps.
While Remittix is gaining momentum, XRP's brand recognition, liquidity, and institutional partnerships still give it a significant edge in the payments space.
XRP Price Forecast: Short-Term and Long-Term Outlook
In the short term over the next 30 days, the bullish scenario involves holding $2.80 support, breaking $3.70, and rallying to $5. The bearish scenario would see XRP lose $2.80, drop to $2.20, and consolidate.
For the mid-term outlook in Q4 2025, if the bullish trend continues and macro conditions remain favorable, XRP could target $7 to $10 by the end of the year. In a full altseason scenario, $15 is not out of reach, according to some analysts.
Key Catalysts That Could Drive XRP Higher
Several catalysts could propel XRP higher. Institutional adoption continues to expand as Ripple's partnerships, especially in the Middle East and Asia-Pacific, lay the groundwork for long-term utility. CBDC integration presents another opportunity as Ripple works with multiple central banks on developing Central Bank Digital Currencies. Any progress here could significantly boost XRP's real-world use.
ETP listings could bring new inflows as XRP may benefit from exchange-traded products in Europe and Asia, especially if more crypto-based ETFs gain traction globally. The macro environment also favors growth, with a dovish Fed, weakening USD, and rising crypto adoption all creating a fertile environment for altcoins like XRP to thrive.
Community Sentiment: Is the XRP Army Ready?
The XRP community, also known as the XRP Army, remains one of the most passionate and active in the crypto space. Social media sentiment has turned increasingly bullish, with hashtags like #XRPToTheMoon and #XRP15 trending on X (formerly Twitter).
However, analysts caution against overexuberance, noting that market cycles can be volatile and unpredictable.
Risks to Watch
While the bullish case is compelling, it's important to consider the risks. Macro-economic shocks from a sudden shift in interest rates or recession fears could impact crypto markets broadly. Regulatory setbacks remain possible — although Ripple has gained legal clarity in the U.S., future regulations in Europe or Asia could cause volatility.
Network risks from any technical issues or security breaches could erode trust and trigger selloffs. Competition from new projects like Remittix, Stellar (XLM), and other payment-focused tokens could eat into XRP's market share.
Final Thoughts: Is XRP Set to Explode?
With XRP hovering near a critical support zone at $2.80, all eyes are on whether bulls can defend this level and push the token back into an uptrend. If successful, the next moves could be explosive, with analysts forecasting $5 in the short term and potentially $15 or higher before the end of 2025.
While risks remain, the technical setup, improving fundamentals, and renewed community optimism all point toward a bullish continuation — if key levels hold.
As always, investors should stay informed, manage risk, and avoid emotional decisions in this fast-moving market.
Summary
XRP currently trades around $2.85 with key support at $2.80 and major resistance at $3.70. Short-term targets point to $5 while mid-term projections suggest $10 to $15 is possible. Downside risk exists to $2.20 if support fails. Bullish catalysts include legal clarity, growing utility, and increasing adoption, while bearish risks encompass macro shocks, competition, and potential regulation.
Disclaimer
This article is for informational purposes only and is not financial advice. Cryptocurrency investments are highly volatile and involve significant risk. Always do your own research (DYOR) and consult with a financial advisor before making investment decisions.
Mechanical vs. Anticipation Trades: The Fine LineWhen traders talk about discipline, they often refer to following rules — sticking to a plan, being methodical, and avoiding emotional decisions. But there's a subtle and powerful difference between being rule-based and being blindly mechanical. And even more, there's a moment in every trader’s process where discipline demands adaptation.
Let’s look at a recent trade on Gold to understand this better.
On Thursday, I published an analysis on Gold stating that the recent breakdown of support had turned that zone into resistance. A short entry from that level made sense.
It was mechanical, clean, and aligned with what the chart was showing at the time.
And, at first, it worked. Price rose into the resistance area and dropped. Perfect reaction. Textbook setup. Confirmation. The kind of trade you want to see when following a rule-based system.
But then something changed.
Price came back. Quickly.(I'm talking about initial 3315-3293 drop and the quick recover)
So, the very next rally pushed straight back into the same resistance area, hmmm...too simple, is the market giving us a second chance to sell?
That was the first sign that the market might not respect the previous structure anymore.
It dipped again after, but the second drop was different: slower, weaker, choppier.
That told me one thing: the selling pressure was fading.
So I shifted. From mechanical execution to anticipatory mindset.
This is where many traders struggle — not because they don’t have a system, but because they don’t know when to let go of it. Or worse: they abandon it too quickly without cause.
In this case, the evidence was building. The failed follow-through. The loss of momentum. The compression in structure. All signs that a reversal was brewing.
Rather than continuing to blindly short, referring to a zone that no longer held the same weight, I started looking for the opposite: an upside breakout and momentum acceleration.
That transition wasn’t based on emotion. It was based on market behavior.
________________________________________
Mechanical vs. Anticipation: What’s the Real Difference?
A mechanical trade is rule-based:
• If X happens, and Y confirms, then enter.
• No need for interpretation, no second guessing.
• It can (in theory) be automated.
An anticipatory trade is different:
• It’s about reading intent in price action before confirmation.
• Higher risk usually, but higher reward if you’re right.
• Can’t be automated. It requires presence, experience, and context.
And the tricky part? Often, we lie to ourselves. We say we’re "mechanical" while actually guessing. Or we think we’re being smart and intuitive, when in fact, we’re being impulsive.
The key is awareness.
In my Gold ideas, the initial short was mechanical. But the invalidation came quickly — and I was alert enough to switch gears. That shift is not a betrayal of discipline. It’s an upgrade of it.
________________________________________
Final Thoughts:
Discipline is not doing the same thing no matter what. Discipline is doing what the market requires you to do, without emotional distortion.
And that, often, means walking the fine line between the setup you planned for, and the reality that just showed up.
Disclosure: I am part of TradeNation's Influencer program and receive a monthly fee for using their TradingView charts in my analyses and educational articles.

Bullish potential detected for TLCEntry conditions:
(i) higher share price for ASX:TLC along with swing up of the DMI indicators and swing up of the RSI indicator, and
(ii) observation of market reaction at the support/resistance level at $5.31 (from the open of 12th May).
Stop loss for the trade would be, dependent of risk tolerance (once the trade is activated):
(i) below the support level from the open of 21st November (i.e.: below $5.05), or
(ii) below the recent swing low of 3rd June (i.e.: below $4.96).

Potential outside week and bullish potential for CXOEntry conditions:
(i) higher share price for ASX:CXO above the level of the potential outside week noted on 27th June (i.e.: above the level of $0.1025).
Stop loss for the trade would be:
(i) below the low of the outside week on 20th June (i.e.: below $0.083), should the trade activate.

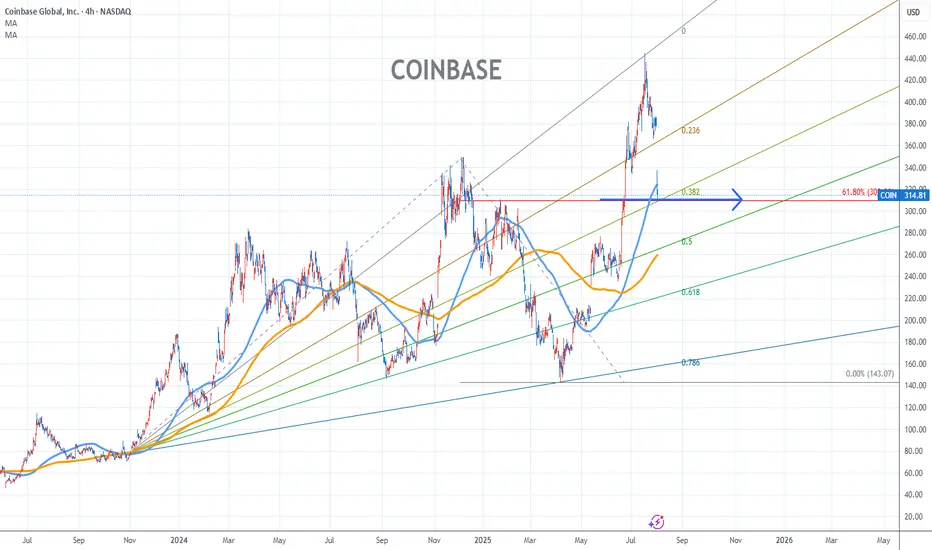
Coinbase Stock Chart Fibonacci Analysis 080125Trading Idea
1) Find a FIBO slingshot
2) Check FIBO 61.80% level
3) Entry Point > 310/61.80%
Chart time frame:C
A) 15 min(1W-3M)
B) 1 hr(3M-6M)
C) 4 hr(6M-1year)
D) 1 day(1-3years)
Stock progress:C
A) Keep rising over 61.80% resistance
B) 61.80% resistance
C) 61.80% support
D) Hit the bottom
E) Hit the top
Stocks rise as they rise from support and fall from resistance. Our goal is to find a low support point and enter. It can be referred to as buying at the pullback point. The pullback point can be found with a Fibonacci extension of 61.80%. This is a step to find entry level. 1) Find a triangle (Fibonacci Speed Fan Line) that connects the high (resistance) and low (support) points of the stock in progress, where it is continuously expressed as a Slingshot, 2) and create a Fibonacci extension level for the first rising wave from the start point of slingshot pattern.
When the current price goes over 61.80% level , that can be a good entry point, especially if the SMA 100 and 200 curves are gathered together at 61.80%, it is a very good entry point.
As a great help, tradingview provides these Fibonacci speed fan lines and extension levels with ease. So if you use the Fibonacci fan line, the extension level, and the SMA 100/200 curve well, you can find an entry point for the stock market. At least you have to enter at this low point to avoid trading failure, and if you are skilled at entering this low point, with fibonacci6180 technique, your reading skill to chart will be greatly improved.
If you want to do day trading, please set the time frame to 5 minutes or 15 minutes, and you will see many of the low point of rising stocks.
If want to prefer long term range trading, you can set the time frame to 1 hr or 1 day.
Jazz Pharma Stock Chart Fibonacci Analysis 080125Trading Idea
1) Find a FIBO slingshot
2) Check FIBO 61.80% level
3) Entry Point > 112/61.80%
Chart time frame:B
A) 15 min(1W-3M)
B) 1 hr(3M-6M)
C) 4 hr(6M-1year)
D) 1 day(1-3years)
Stock progress:C
A) Keep rising over 61.80% resistance
B) 61.80% resistance
C) 61.80% support
D) Hit the bottom
E) Hit the top
Stocks rise as they rise from support and fall from resistance. Our goal is to find a low support point and enter. It can be referred to as buying at the pullback point. The pullback point can be found with a Fibonacci extension of 61.80%. This is a step to find entry level. 1) Find a triangle (Fibonacci Speed Fan Line) that connects the high (resistance) and low (support) points of the stock in progress, where it is continuously expressed as a Slingshot, 2) and create a Fibonacci extension level for the first rising wave from the start point of slingshot pattern.
When the current price goes over 61.80% level , that can be a good entry point, especially if the SMA 100 and 200 curves are gathered together at 61.80%, it is a very good entry point.
As a great help, tradingview provides these Fibonacci speed fan lines and extension levels with ease. So if you use the Fibonacci fan line, the extension level, and the SMA 100/200 curve well, you can find an entry point for the stock market. At least you have to enter at this low point to avoid trading failure, and if you are skilled at entering this low point, with fibonacci6180 technique, your reading skill to chart will be greatly improved.
If you want to do day trading, please set the time frame to 5 minutes or 15 minutes, and you will see many of the low point of rising stocks.
If want to prefer long term range trading, you can set the time frame to 1 hr or 1 day.

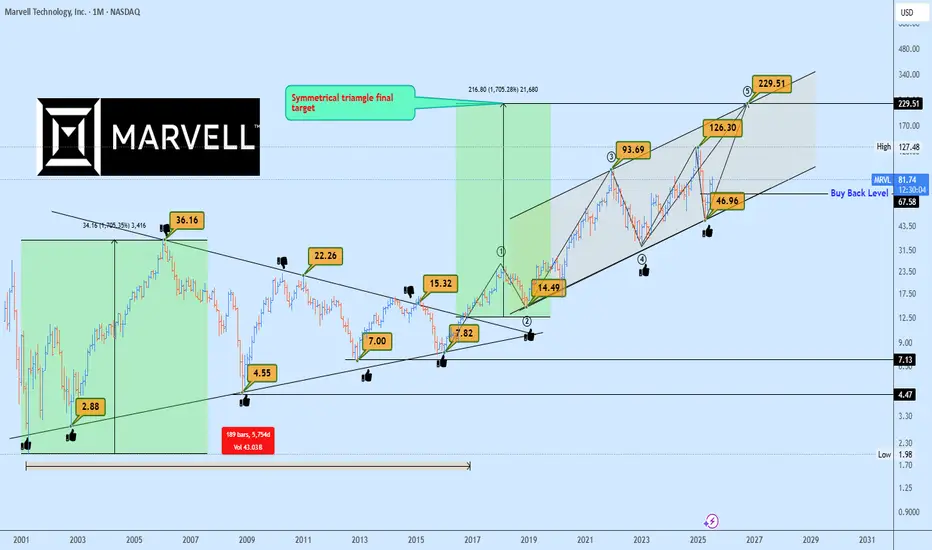
MRVL Massive 15-Years Symmetrical Breakout Targets AheadMarvell Technology (MRVL) has just completed a monumental breakout from a 15-years symmetrical triangle, a rare and powerful long-term accumulation structure. This type of macro consolidation typically precedes a major directional expansion, and in this case, the breakout confirmed bullish continuation.
Currently, MRVL is forming a rising channel structure, with price bouncing cleanly from the lower boundary confirming demand and the continuation phase of the macro move.
The 1:1 projection from the symmetrical triangle gives us a clear target trajectory, with the final leg potentially extending to $229, aligning perfectly with the upper boundary of the rising channel.
In the short to mid-term, the ideal buyback opportunity rests near $67.50, should the market retest previous breakout support or the lower boundary of the channel once more. This zone offers asymmetric risk-to-reward potential for long-term investors and swing traders alike.
Key Targets
📈 $67.50 – Buyback Opportunity Zone
📈 $229 – Rising Channel Top / 1:1 Expansion Target
A breakout this large is no coincidence, it’s backed by years of price compression and institutional positioning. Now is the time to watch closely.
📩 Drop your view in the comments and share your stock requests for quick analysis.
Only stock assets will be accepted under this post.