NAS100 LTF Bearish CorrectionAlthough overall trend is still bullish on Higher TFs, here is a high probability setup for a bearish correction on M15 TF
Support and Resistance

US CRUDE OIL(WTI): Important Breakout📉USOIL has fallen and closed below a significant daily support level,
which has now become a strong resistance.
I anticipate a downward trend towards the support level at 60.76.

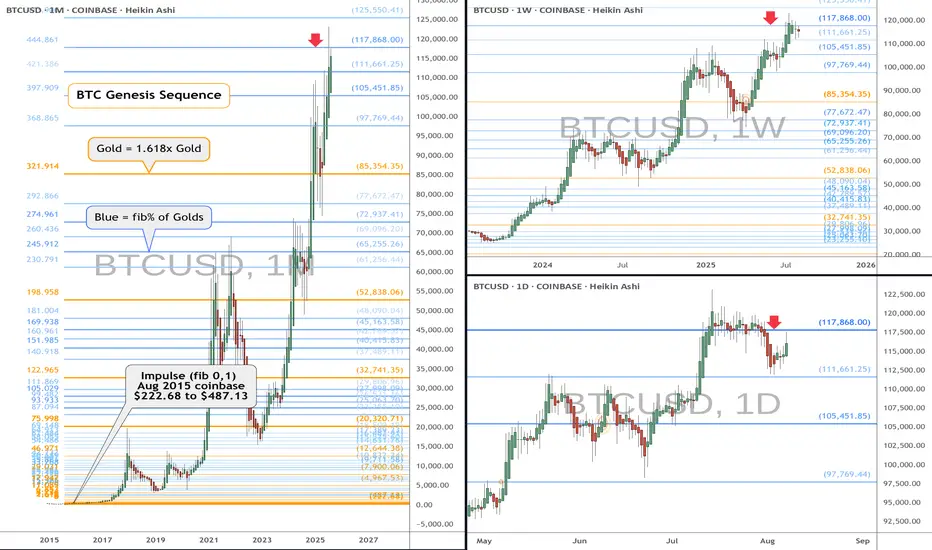
BTC heads up at $117,868 coinbase: Genesis fib trying to TOP it Shown here is a single fib series in 3 different time-frames.
The "Genesis Sequence" has called all major turns since 2015.
Exact reactions at the last few fibs confirm a warning here.
.
See "Related Publications" for previous analysis ------------->>>>>>>>>>
Such as the last post with a "Road Map" that played out PERFECTLY
.
Hit BOOST and FOLLOW for more such PRECISE and TIMELY charts.
=========================================================
.
GBPJPY - at ResistanceSterling Yen long term was consolidating since Aug 24.
Now the price reached the FR 127.2 and respected it as Resistance.
On Aug 1st the support at FR 100 was broken. Yet, price crossed down SMA200 (4H)
Now price is testing the SMA200 from below, which is aligned with FR 61.8 of the latest impulse down.
If the Resistance at 198 holds, price may commence a longer correction, potentially down to 194 or even to 190.
Just my humble opinion.

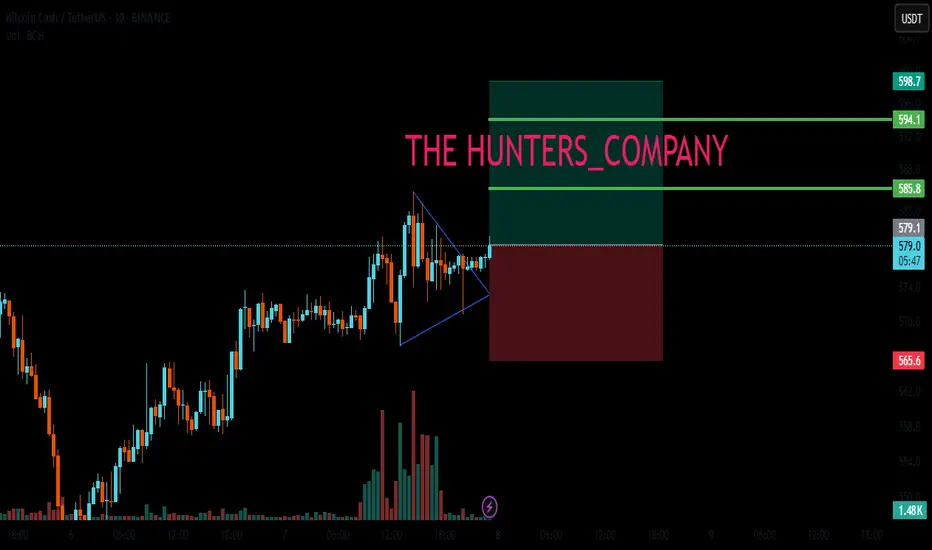
BCH : LIVE TRADEHello friends 🙌
✅Due to the good rise we had, the price has compressed and now formed a triangle.
Now with the valid triangle pattern, we can enter the trade with risk and capital management and move with it to the specified targets.
🔥Follow us for more signals🔥
*Trade safely with us*
BTCUSDT targeting 137K$ soonAs we can see market is holding strong here and soon we are looking for more rise and pump here like the green arrows on chart also if BTC now here hold strong and play some range that would be perfect and why is that?
because we should say hi to ALT season then after a years of patience and it would be time to see some of the charts of ALTs flying.
DISCLAIMER: ((trade based on your own decision))
<<press like👍 if you enjoy💚

Get ready to sell GBPUSDWaiting for the third touch around our (FVG) and Fibonacci levels and then we go short 👇

ETH: LIVE TRADEHello friends🙌
✅Given the good rise we had, we had a small correction that was a buying opportunity and there is another support area where we can buy the second step in case of further correction.
We have also specified targets for you, be careful and do not act emotionally and observe capital and risk management.
🔥Follow us for more signals🔥
*Trade safely with us*

ETH | NEW ATH or DUMP ?Ethereum recently peaked at $3900. And allthough this is not a new ATH (close by a few hundred dollars), it is a local high for the year.
My last update was on an inverse Head and Shoulders pattern on ETH, which has since increased over 50%:
(The original idea here:)
The question now, is what's next for ETH - further increase, or are the increases over for the near term and is a correction more likely?
I'm going to say that the increases for ETH are over for now. This is because we correction is most definitely due after such a large increase in a fairly short timeframe. I'm not saying we're heading into a full out bearish cycle, but a 20-25% correction would be most normal at this point.
Additionally, XRP has also made it's peak and lost the high, now trading just under $3. This is a strong sign that the alts have likely already rallied, since XRP used to be the last to increase (if it increased at all, historically. (Thanks Jedd).
I was very lucky to call that top here:
Either way, buyers may use this correction to scoop up on smaller alts over the next few weeks. This ultimately depends on whether the market has ONE MORE pump, and if the correction will bounce back from a 20-25% pullback.
_________________
BINANCE:ETHUSDT

MNT | Resistance Becomes SupportMantle (MNT/USDT) has successfully broken above its major resistance trendline and converted it into support - a classic bullish reversal pattern.
Key Technical Points:
• Clean breakout above descending trendline
• Former resistance now acting as support
• RSI showing renewed bullish momentum
• Price holding above the green support zone
Bullish Targets:
• First resistance: $1.41 (blue horizontal line)
• Extended target: $2.31 (upper resistance zone)
The pink arrow projection suggests a strong upward trajectory toward these levels. The breakout structure indicates buyers have regained control after months of consolidation. This setup presents an attractive risk-to-reward opportunity, with the converted support level providing a clear invalidation point below $0.85.

The best ambush point for short positions below gold 3400.The daily structure of gold still maintains a bullish dominant pattern. The upper target is the upper Bollinger band of 3400. If it breaks through this position, the upside space will be further opened up. The 4-hour Bollinger band is gradually closing, and the price is fluctuating in the range of 3400-3360. In the short term, it is still treated with range thinking. Before an effective breakthrough, the operation can adopt a high-altitude and low-long strategy. Gold is currently at a critical node of change. If it rises and falls in the evening, it may release a temporary peak signal. The area below 3400 is expected to become an opportunity for the layout of medium-term short positions. The overall recommendation is to remain cautious, respond flexibly to changes in rhythm, and strictly control risks.
Gold operation suggestion: You can continue to try short selling in the 3390-3400 range, with the target at 3380-3370.

BIO : BUY MARKET!!!Hello friends🙌
✅Given the good upward wave we had, the price has now corrected, providing a good opportunity to buy in steps in the specified areas with risk and capital management and move towards the specified goals.
🔥Follow us for more signals🔥
*Trade safely with us*

S&P 500 Futures Hold Ground After Tariffs Take EffectS&P 500 Futures Rise After New Tariffs Kick In
President Trump's sweeping tariffs officially took effect just after midnight, escalating trade tensions with dozens of countries. While negotiations are ongoing behind the scenes to secure exemptions and reduce tariff rates, market reactions are already underway.
Technical Outlook
S&P 500 Futures continue to show bullish momentum as long as price trades above 6289, with the potential to retest the All-Time High (ATH).
To confirm a move toward 6453, price must close above 6437 on the 1H chart.
🔻 However, if the price stabilizes below 6389, a correction toward 6365 becomes more likely.
Key Levels:
🔹 Resistance: 6424 – 6453
🔹 Support: 6365 – 6341

USDT DOMINANCE New Update (4H)First of all you should know that "USDT Dominance" is always moving inverse of BTCUSDT .
Important zones have been lost; it is expected that when the price returns to the identified supply area, it will be rejected downward again.
For risk management, please don't forget stop loss and capital management
Comment if you have any questions
Thank You

GBPUSD - Looking To Sell Pullbacks In The Short TermH4 - Strong bearish move.
No opposite signs.
Currently it looks like a pullback is happening.
Expecting bearish continuation until the two Fibonacci resistance zones hold.
If you enjoy this idea, don’t forget to LIKE 👍, FOLLOW ✅, SHARE 🙌, and COMMENT ✍! Drop your thoughts and charts below to keep the discussion going. Your support helps keep this content free and reach more people! 🚀

VELVET : RISKY BUSINESSHello friends🙌
✅According to the movement logs that this currency has formed, it shows the high purchasing power of buyers and we can also buy in stages during price corrections with risk and capital management and move with it to the specified goals.
🔥Follow us for more signals🔥
*Trade safely with us*

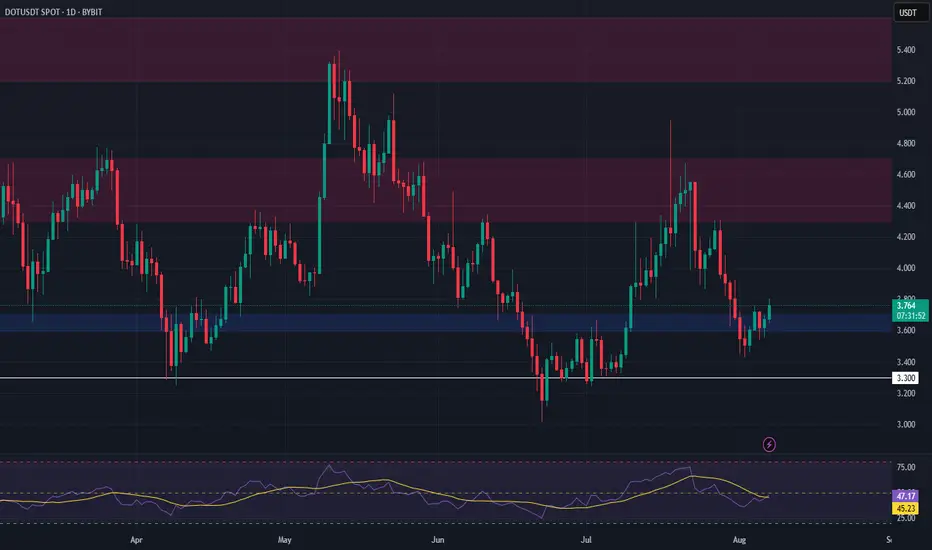
DOT | Bounce Setup from Major Support ZonePolkadot (DOT) has dropped sharply in recent weeks and is now testing a significant support zone between $3.60 – $3.70. This level has historically provided strong demand, making it a potential launch point for a bounce toward higher resistance levels.
Trade Setup:
🔹 Entry Zone: $3.60 – $3.70
🔹 Take Profit Zones:
• TP1: $4.30 – $4.70
• TP2: $5.20 – $5.60
🔹 Stop Loss: Below $3.30
GOLD Potential Bullish Fallowing the PullbackGold is currently forming a trading range, with recent price action indicating a test of support, which may mark the end of the recent pullback. Yesterday, gold retraced toward the 3391 level, showing signs of short-term recovery.
Key Market Focus
The market is closely watching developments around the Federal Reserve appointment, including the potential replacement of Chair Powell. Trade-related comments from Donald Trump are also creating uncertainty. These geopolitical and macroeconomic factors may trigger a new correction or volatility phase in gold.
Resistance: 3400 / 3425
Support: 3355 / 3350
Price action confirmed a false breakout to the downside, with strong buying interest near the 3350–3355 support zone. If the price holds above this support, it strengthens the case for a bullish continuation. A break and close above 3400 could pave the way toward 3425 and potentially higher Growth.
You may find more details in the chart.
Trade wisely Best of Luck Buddies.
Ps: Support with like and comments for better analysis Thanks

HFT Buy/Long Setup (1D)After the downward trendline break and the formation of the main CH (Change of Character), we can look for buy/long positions around the key support zones.
A healthy time correction has also formed on the chart, and with price approaching the demand zone, we expect a strong reaction.
The support zone and target levels (TPs) are marked on the chart.
A daily candle close below the invalidation level will invalidate this analysis.
For risk management, please don't forget stop loss and capital management
When we reach the first target, save some profit and then change the stop to entry
Comment if you have any questions
Thank You

USD Set To bounce? EUR/USD, USD/JPY, USD/CHFIt has been a week since the US dollar plunged following a weak NFP report. Given it has consolidated within a tight range near last week's low, alongside price action clues on EUR/USD, USD/JPY and USD/CHF, I suspect the dollar could bounce before its losses resume.
Matt Simpson, Market Analyst at City Index and Forex.com

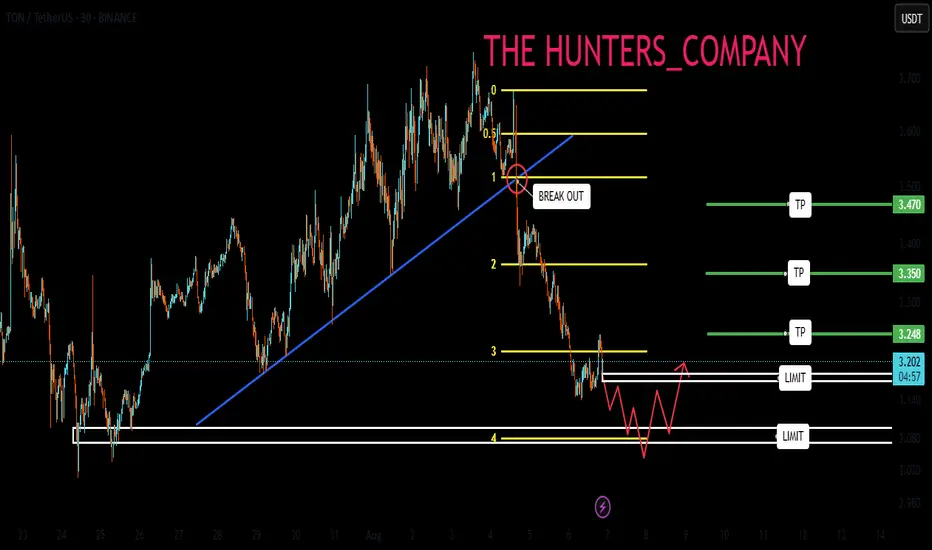
TON : Does the TON ecosystem have growth potential?Hello friends🙌
✅Given the decline we had in the entire market, TON was no exception and had a decline that has plunged the market into fear as to whether the decline will continue or whether the price will finally grow.
✅Well, as you can see, there is still no sign of serious buyers on the chart, and we are planning based on observations, not assumptions...
✅In this chart, the price is likely to move to the support area specified by Fibonacci and buyers will show their support, but what is the best way?
✅The best way to buy safely and with capital and risk management is in steps, where we have specified the purchase steps for you and the goals are also specified.
🔥Follow us for more signals🔥
*Trade safely with us*
TST : Waiting for the defeat of suffering...Hello friends🙌
✅ considering the large and frequent declines of this currency, we do not take unreasonable risks and have identified the trading range that has formed and are waiting for the range to break.
✅If there is a valid resistance break, you can buy and move with it to the targets specified by Fibonacci.
✅In the event of a continuation of the decline and a valid break of the range from below, you can enter a sell trade and move with it to the targets specified by Fibonacci.
✅Be sure to observe capital management.✅
🔥Follow us for more signals🔥
*Trade safely with us*

(Gold) Technical Analysis – Buy-Side Correction in PlayGold is currently undergoing a correction on the buy side, with price action suggesting the potential for further upside. The market is showing bullish momentum amid rising global uncertainty.
Dovish Fed Expectations: Increasing speculation around potential Fed rate cuts, along with discussions about leadership changes (including the possible replacement of Kugler and Powell), is contributing to a more accommodative outlook. Geopolitical & Trade Tensions: Continued escalation of global trade conflicts is boosting demand for safe-haven assets like gold, adding to bullish pressure.
If the price holds above the 3370–3380 support zone, bullish continuation toward 3420/3440 is likely in the short term.
You May find more details in the chart.
Ps; Support with like and comments for better analysis
