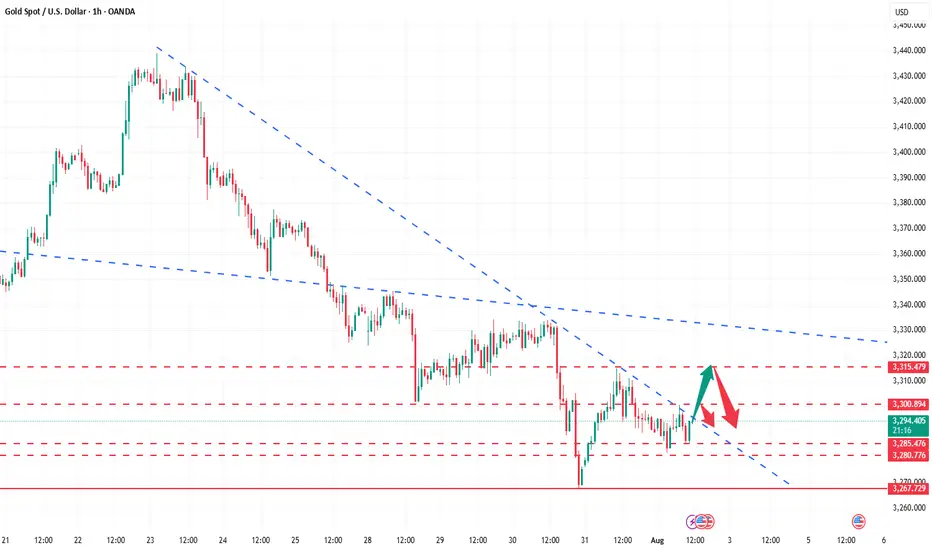
Possible Gold Reaction Scenarios to Today's Jobs ReportMarket expectations for today's nonfarm payrolls change to be 104k, with the unemployment rate projected to rise to 4.2% from 4.1%. The divergence between payroll growth and the unemployment rate is mainly due to the birth-death model used in payroll calculations and expectations for either a halt or rebound in the labor force participation rate.
Fed Chair Powell recently stated that the "main number to watch" is the unemployment rate, which raises its importance in today’s data release. If the participation rate rises sharply, the unemployment rate could even increase to 4.3%, which may put a cap on the recent rally in the dollar index.
There is also a risk that a very strong payrolls number could be released alongside a rise in the unemployment rate. This combination may trigger a volatile and uncertain market reaction with multiple direction changes.
In similar past scenarios, markets typically reacted first to the payrolls data, then shifted focus to the unemployment rate shortly after.
For gold, look for 3310 and 3288 as pivot levels that could open the door to 3342 on the bullish case and 3270 on the bearish case.
Support and Resistance

EURUSD - New Bearish Move!Hello Traders !
The EURUSD broke the support level (1.14810 - 1.14463).
This key level becomes new resistance!
So, I expect a bearish move📉
_______________
TARGET: 1.12955🎯

Gold Slips After Powell Speech Below 3320 Bearish Pressure BuildGOLD Overview
Market Context:
Gold declined from the 3333 level, as anticipated in yesterday’s analysis, ahead of Fed Chair Powell’s speech. Powell reiterated that it is still too early for rate cuts, citing persistently high inflation, which supported the U.S. dollar and pressured gold.
Technical Outlook:
As long as gold trades below the 3320–3310 zone, the bearish momentum is expected to continue, with the next target at 3285. A confirmed break and stability below 3285 could open the way toward 3255.
To regain bullish traction, the price must stabilize above 3320.
Support Levels: 3285 • 3255
Resistance Levels: 3333 • 3349

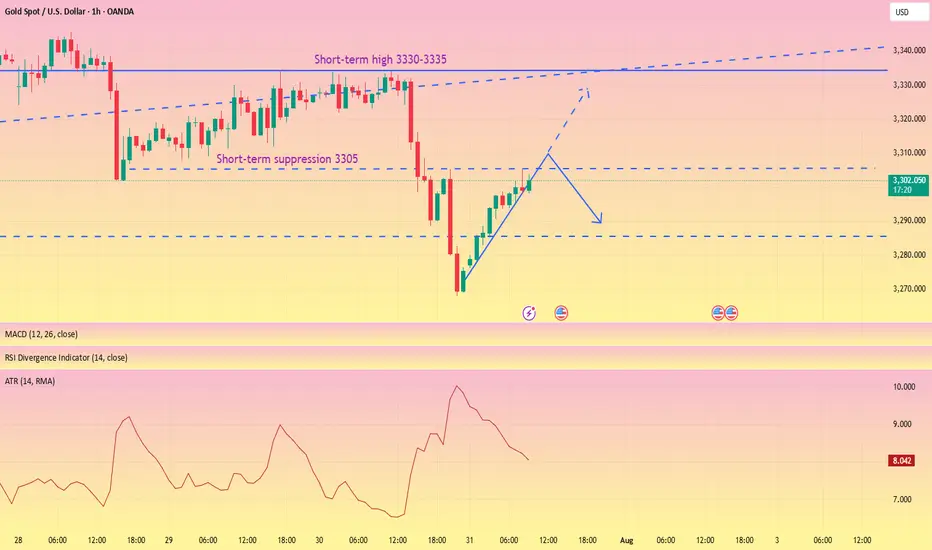
The rebound is weak, short orders intervene#XAUUSD
After two consecutive trading days of volatility, gold finally began to fall under pressure near 3335. After breaking through the 3300 mark, the price of gold accelerated its decline, reaching a low of around 3268, and yesterday's daily line closed with a large negative line. 📊
Today's rebound is more likely to be based on the buffering performance of the impact of news. The ATR data also shows that the bullish momentum is slowly weakening in the short term. 🐻After digesting the impact of yesterday's news through rebound during the day, it may fall again in the future.📉
📎The primary focus today is 3305 above, which was also the high point of yesterday's pullback correction. If the gold price rebounds to 3305-3320 and encounters resistance and pressure,📉 you can consider shorting and look towards 3290-3270.🎯
If the short-term gold rebound momentum is strong and breaks through the 3305-3320 resistance area, it will be necessary to stop loss in time. Gold may be expected to touch yesterday's high resistance of 3330-3335, which is the second point to consider shorting during the day.💡
🚀 SELL 3305-3320
🚀 TP 3290-3270
CADJPY 60/15 Pullback LongJust turn in to bullish trend, so i am doubt about the gap will propel the bounce earlier. Possible 1st trade on the middle gap or the 2nd trade is bounce on the buy zone.

GBPUSD - 31/7/25 - Bullish reversalThe setup is not great, but im expecting a pull back on the dollar which should result in a bullish move on the GBP and EUR.
There is an extreme zone that i would like price to reach to with the possibility of not taking out the previous HL. But lets see.
+ve:
1. Extreme zone that resulted in the bullish move.
2. slight imbalance above the extreme zone
3. Dollar setting up for a pull back that will result in a bullish move on GBP
4. TP is just above the equal high liquidity zone
-ve:
1. close to the higher low and that may be swept

EURUSD – Smart Money Short Setup During NFP Friday | ICT Concept
EURUSD is trading inside a well-defined bearish structure after multiple internal liquidity sweeps during the London and Asia sessions.
As we enter the New York Killzone, price has returned to a bearish OB near the NY Midnight Open, with clear signs of exhaustion.
The pair failed to break above the Thursday OB zone, and the 15M chart shows consecutive MSS and BOS patterns, indicating supply is in control.
🧠 Trade Idea (Execution Plan):
Sell Limit: 1.14183
SL: 1.14422
TP1: 1.13877
TP2: 1.13608
TP3: 1.13351
📌 Confluence:
Bearish OB
NY Midnight Open rejection
MSS on LTF
RSI/Williams %R Overbought
📉 Structure: Bearish
🕒 Session: New York (NFP Volatility Expected)
💡 Context: USD is likely to strengthen after deep retracement into DXY OB, targeting 100.5–100.7
If price invalidates 1.14422 with bullish displacement, setup becomes void.
Patience is key during high-impact news – let Smart Money show their hand.

US30 Faces Pressure Below 44610US30 Overview
Technical Outlook:
US30 is showing bearish momentum while trading below the pivot zone at 44610. As long as the price remains under this level, downside pressure may continue toward 44360, with further support at 44180.
However, a confirmed breakout above 44720 would shift the bias to bullish, opening the path toward 44910 and potentially 45100.
Support Levels: 44480 • 44360 • 44180
Resistance Levels: 44720 • 44910 • 45100
Bias: Bearish below 44610, Bullish above 44720

GBPJPY is in the Down Trend From Resistance LevelHello Traders
In This Chart GBPJPY HOURLY Forex Forecast By FOREX PLANET
today GBPJPY analysis 👆
🟢This Chart includes_ (GBPJPY market update)
🟢What is The Next Opportunity on GBPJPY Market
🟢how to Enter to the Valid Entry With Assurance Profit
This CHART is For Trader's that Want to Improve Their Technical Analysis Skills and Their Trading By Understanding How To Analyze The Market Using Multiple Timeframes and Understanding The Bigger Picture on the Charts

Silver under pressure!Silver prices dropped sharply following a sudden plunge of over 20% in U.S. copper futures, triggered by a surprise decision from the Trump administration to cancel import tariffs on refined copper. This move caused turmoil in the markets and impacted related assets such as silver.
From a technical perspective, silver is trading in a general downtrend on the 4-hour chart, forming lower lows and lower highs, maintaining a bearish structure.
If the price rises to the 37.034 level, it is likely to reverse downward to continue the bearish trend, targeting the 36.45 and 35.60 levels in the medium to long term.
However, if the price climbs above 37.26 and closes a 4-hour candle above that level, the bearish scenario would be invalidated, and this breakout could signal a trend reversal from bearish to bullish.

POSSIBLE BEARISH CONTINUATION ON GOLDBased on price action, Gold presents a very bearish sentiment from the daily point of view.
The indicated supply region may be the area of interest for the build up of the sells if indeed Gold is bound for the monthly lows.
Confirmation is needed for an entry.

The idea of shorting on rallies below 3315 remains unchanged.Gold remains generally weak, with multiple rebounds showing signs of fatigue. The upward moving average continues to suppress prices, indicating that the bearish trend remains intact, and the short-term market outlook remains bearish. Trading strategies remain bearish today, with a key focus on the 3300-3315 area, a key short-term resistance zone. If the market rebounds before the US market opens and approaches this area, or if a clear topping signal appears near this range, consider entering a short position. Today will see the release of the non-farm payroll data, which may influence the market's trajectory. We recommend prioritizing short-term trading before the release, and reconsidering the market's direction based on market feedback after the release. Structurally, gold continues to exhibit a volatile downward trend, with lower highs and lower lows. Today's low is expected to be lower than yesterday's. Short-term short positions are focused on 3285-3280, with a break below this level potentially allowing for further declines. Please carefully time your entry, strictly implement risk management, and avoid emotional trading.
BTC is likely to resist falling below $112000BTC is likely to resist falling below $112000
If the confluence between the yellow trendline and the top green horizontal support level dont hold strong, we are likely to see BTC retrace to $100K
Please trade with care.
My thoughts are shown on the chart technically
I hope to connect with you.
Please like, share, comment and follow me.

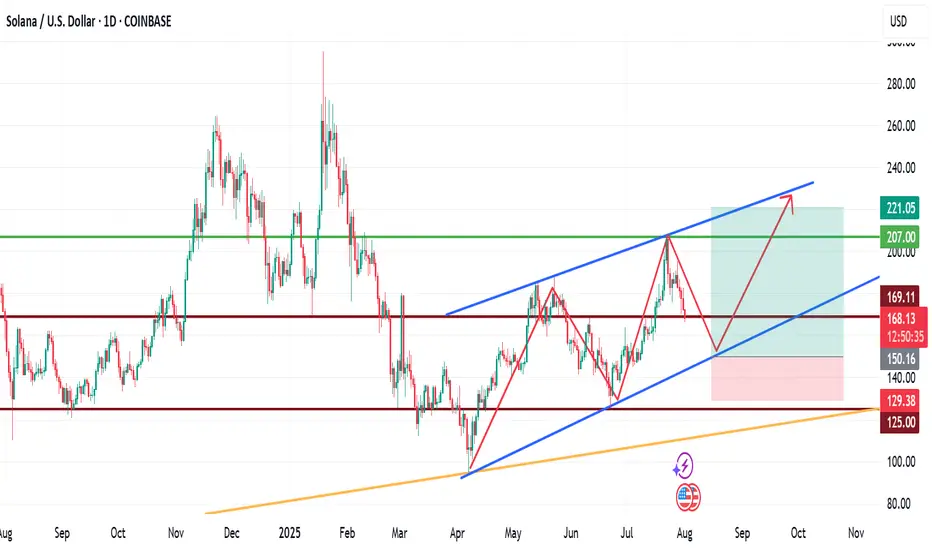
My View for SOLANA next moveMy View for SOLANA next move.
Technically, SOL has been trading within a channel for a while now, with the formation of HHs and HLs.
If fundamentals play out positively long to mid-term, we are likely to see SOLNA fall to $150 zone before another upward leg forms. This leg may rally to as high as $220.
Trade with care.
If you found this helpful, please connect with me.
Like, comment and share
AUDUSD Potential UpsidesHey Traders, in today's trading session we are monitoring AUDUSD for a buying opportunity around 0.64000 zone, AUDUSD is trading in an uptrend and currently is in a correction phase in which it is approaching the trend at 0.64000 support and resistance area.
Trade safe, Joe.

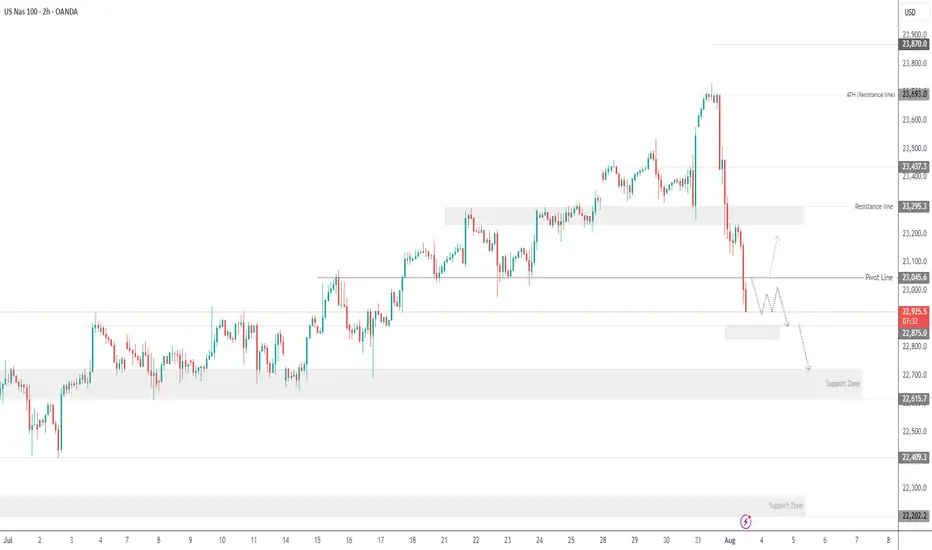
USNAS100 - Tech Weakness & Tariffs Drag NASDAQ LowerTariff Day Pressure Builds as Amazon Miss Weighs on Markets
Markets were hit by a wave of risk-off sentiment on Friday as renewed tariff headlines, weakness in pharma stocks, and a disappointing earnings report from Amazon clouded investor confidence. All this comes just ahead of the U.S. jobs report, which is expected to challenge the market's already diminished expectations for Fed rate cuts.
While macro markets appeared resilient earlier in the week, Wall Street futures and global equities turned cautious as sentiment deteriorated.
NASDAQ – Technical Outlook
The NASDAQ has dropped nearly 850 points from its recent all-time high of 23690, as anticipated in previous updates. The index remains under bearish pressure.
For today, the market is expected to remain sensitive due to recent macro and earnings-driven volatility.
If the price breaks below 22875, the decline is likely to extend toward 22710, with a deeper support zone at 22615.
To shift back to a bullish bias, the index must break and close above 23045 on the 1H chart.
Support Levels: 22875 • 22710 • 22615
Resistance Levels: 23140 • 23240 • 23320
Bias: Bearish while below 23045
Bullish confirmation: 1H close above 23045
AUD/JPY LONG AUD/JPY LONG " break of a resistance area and retest it + 38.2% fib retracement + 50 and 200 ema dynamic support + risk on environment "

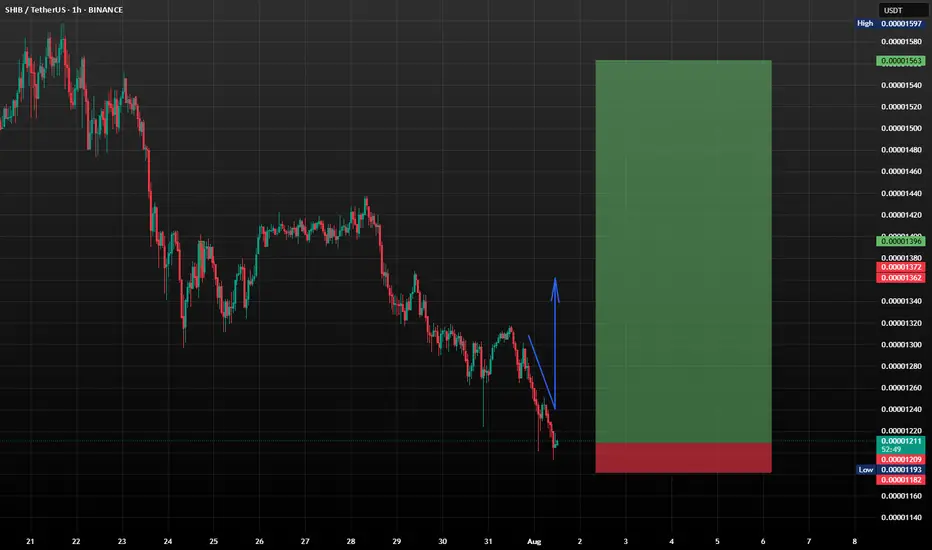
SHIB/USDT: Shiba Inu Setting Up for a Bullish Reversal?Shiba Inu (SHIB) is currently trading around $0.00001208, showing signs of stabilizing near a key support zone after a recent pullback. The market appears to be forming a rounded double bottom pattern, which could evolve into a strong W-shaped bullish reversal if confirmed with volume and breakout above short-term resistance (~$0.0000135).
This level could be pivotal for long-term accumulation.
What to Watch
*Key Support Zone: $0.00001200 - price is holding this level firmly.
*Short-Term Resistance: $0.0000135 - a breakout could confirm bullish continuation.
*Indicators: RSI is cooling off after a high, which could provide momentum for a new leg up.
SHIB may be quietly setting the stage for a powerful recovery. This support level looks like a gift for those with patience and vision. DCA smartly, monitor dips, and don’t panic, because when this pattern breaks out, you’ll wish you had loaded up earlier.
This isn't about hype...it’s about positioning. Stay disciplined. Stick to your plan. SHIB might just surprise everyone again.
ZRX to $1 ZRX is consolidation at the very bottom price, and with alt-season hopefully get a rally to $1

Wedge Pattern: A Key to Trend Reversals and Continuations📈 Wedge Pattern: A Key to Trend Reversals and Continuations
A wedge pattern is a technical chart formation that signals a potential reversal or continuation in the market. It’s formed when price moves between two converging trendlines — either sloping upward or downward — creating a narrowing range over time.
There are two main types of wedge patterns:
🔻 Falling Wedge (Bullish)
Formed during a downtrend or as a correction in an uptrend.
Characterized by lower highs and lower lows, with the slope of the support line steeper than the resistance line.
Typically signals a bullish reversal as momentum builds for a breakout to the upside.
✅ Confirmation: Break above the resistance line with volume surge.
🔺 Rising Wedge (Bearish)
Appears during an uptrend or as a correction in a downtrend.
Shows higher highs and higher lows, but the support line is steeper than the resistance line.
Often leads to a bearish reversal, especially when volume declines into the pattern.
⚠️ Confirmation: Break below the support line with increasing volume.
🧠 Key Characteristics
Volume tends to decrease as the pattern forms, indicating a pause in momentum.
The breakout direction (up or down) determines whether it’s a continuation or reversal signal.
Wedges can appear on any time frame and are useful for both day traders and long-term investors.
📊 Trading Tip
Always wait for confirmation of the breakout before entering a trade. False breakouts can be common, especially in low-volume environments

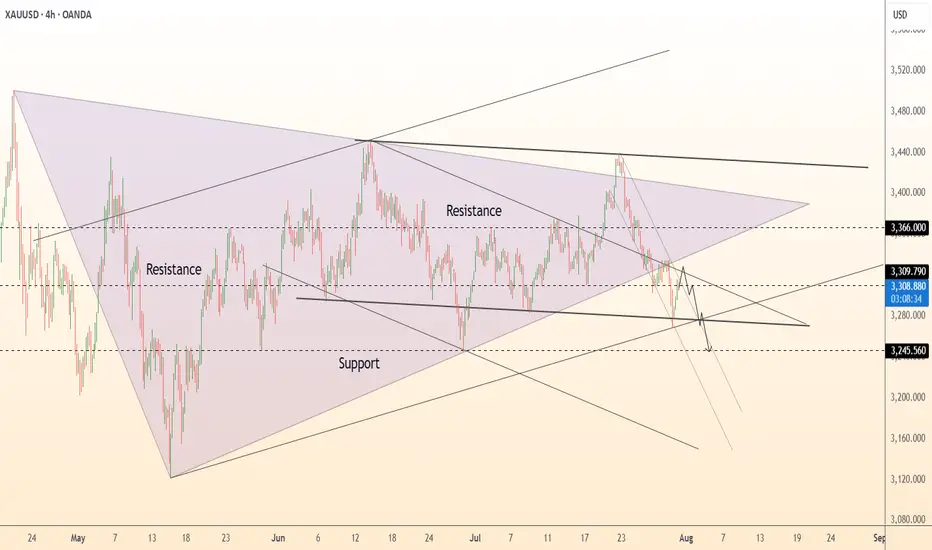
DeGRAM | GOLD fixed below the triangle📊 Technical Analysis
● XAUUSD is forming a bearish descending wedge within a broader symmetrical triangle, facing rejection at 3,310 near prior support-turned-resistance.
● Repeated failure to hold above trendlines and continued lower highs favor a drop toward the 3,246.56 level, with possible overshoot if support breaks.
💡 Fundamental Analysis
● Rising real yields and hawkish Fed tone continue to pressure gold; ISM Manufacturing Prices and NFP loom as next volatility catalysts.
● Reduced ETF inflows and strong dollar on resilient US macro data weigh on demand for non-yielding assets.
✨ Summary
Short bias below 3,310. Breakdown eyes 3,246 → 3,200 zone. Resistance holds while trendline caps recovery.
-------------------
Share your opinion in the comments and support the idea with a like. Thanks for your support!
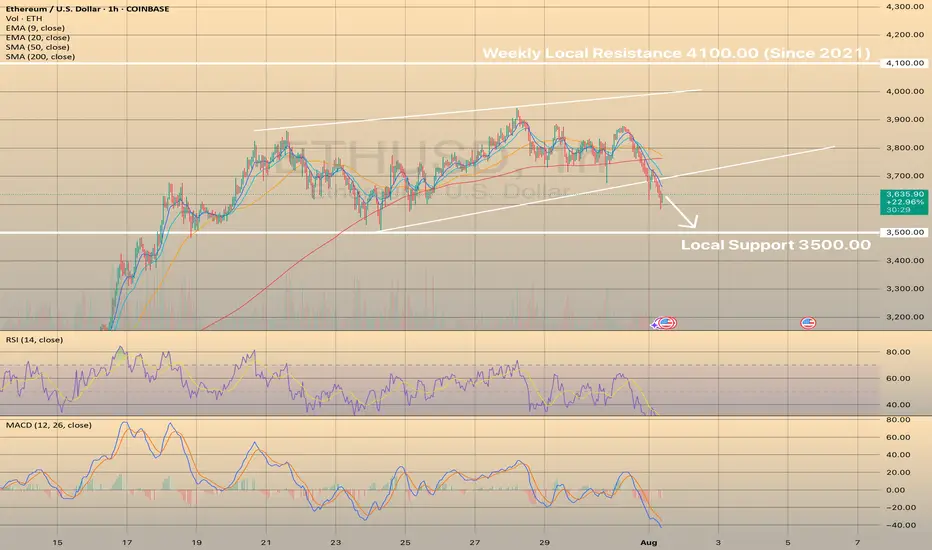
ETHUSD BROKE THE LOWER BORDER OF THE WEDGE. PRICE IS MOVING TOWAETHUSD BROKE THE LOWER BORDER OF THE WEDGE. PRICE IS MOVING TOWARDS THE LOCAL SUPPORT.
Yesterday, Ethereum saw its largest monthly increase since July 2022, thanks to strong inflows into exchange-traded funds and increased activity in the Ethereum treasury. US exchanges are working to obtain regulatory approval for a standardized framework for listing crypto funds. Coinbase and JPMorgan have joined forces to provide Chase customers with access to crypto products.
Despite these positive developments, the short-term outlook does not indicate a bullish setup. It appears that all the information has already been factored into the price. The pair moves towards the local support of 3,500.00. However, in the long term, these developments are favorable for investment.
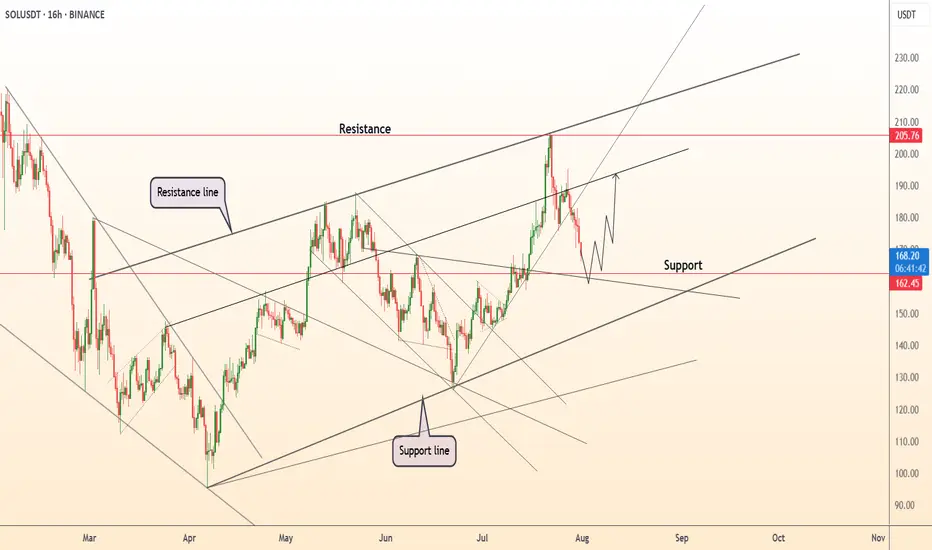
DeGRAM | SOLUSD will test the support level📊 Technical Analysis
● SOLUSD is pulling back after testing the upper resistance channel near 205 and is now approaching key support at 162.5, aligning with the breakout zone.
● Structure remains bullish as price respects the midline of the ascending channel, and upside continuation toward 205 remains likely if 162 holds.
💡 Fundamental Analysis
● Solana remains a top performer in weekly ETP inflows, per CoinShares, and continues to dominate in NFT volume and developer activity.
● Funding remains positive across major derivatives platforms, signaling sustained bullish sentiment despite short-term volatility.
✨ Summary
Long bias above 162. Breakout target remains 205 ▶ 220. Setup remains valid while above key structure support.
-------------------
Share your opinion in the comments and support the idea with a like. Thanks for your support!