DeGRAM | USDJPY fixed above the descending channel📊 Technical Analysis
● Dollar-yen has punched through the 16-month descending channel top and twice retested it as support (false-break tags), carving a rising trend line that now guides price away from 144.90.
● Inside the break zone a smaller pennant is forming; a 4 h close above 147.18 completes the pattern and activates the channel-height target at 150.80 near the November swing cap.
💡 Fundamental Analysis
● US 2-yr yields pushed to a three-month high after hotter CPI core-services and Barkin’s “inflation progress has stalled”, while the BoJ July minutes flagged only “gradual” QT—widening the policy gap and reviving carry demand for yen shorts.
✨ Summary
Long 145.2-146.2; pennant break >147.18 targets 150.80. Bias void on a 4 h close below 142.80.
-------------------
Share your opinion in the comments and support the idea with like. Thanks for your support!
Support and Resistance

Bitcoin ATHBINANCE:BTCUSDT This is amazing for crypto community because this level-up all of lover crypto currencies.
Next target: 120.000K
Best for pollback levels: 111.000K & 105.500K
👓We are this time keep calms emotional in buy or sell.

XAUUSD 1HR ANALYSIS🔔 XAUUSD 1H Analysis | August 1, 2025
Gold is currently consolidating inside a symmetrical triangle on the 1-hour timeframe. Price action has tightened, indicating a potential breakout scenario is near. Two key paths are highlighted:
🔹 Bullish Scenario:
A breakout above the triangle resistance may lead to a clean push towards $3,310, and if momentum sustains, $3,334 becomes the extended upside target (liquidity zone and prior supply area).
🔹 Bearish Scenario:
A breakdown below triangle support could send price toward $3,270 first. If this level fails to hold, further downside toward $3,245 is expected — a major support and demand zone.
📍 Current Price: $3,291.98
⏳ Wait for breakout confirmation with volume and momentum before committing to direction.

Gold Outlook – Friday August 1st | Navigating NFP VolatilityGold has been in a clear downtrend all week, confirmed on the 4H chart and pushed further by the Fed rate decision earlier this week.
With NFP ahead today, I’m staying sharp and focused only on confirmed setups:
🔻 Sell Setup: Below 3274.33
First TP: 3268 (+50 pips)
Final TP: 3264 (+97 pips)
🟢 Buy Setup: Above 3343
Target: 3359 (+160 pips)
🎯 This is not the day to guess — it’s about being fast, clean, and rule-based.

U.S. NATURAL GAS SUCCESSFULLY REBOUNDED FROM FIRM SUPPORT.U.S. NATURAL GAS SUCCESSFULLY REBOUNDED FROM FIRM SUPPORT.
Yesterday the natural gas storage report came out higher than expected. U.S. natural gas inventories increased by 48 billion cubic feet last week to 3,123 Bcf, increasing the surplus over the five-year average to 195 Bcf from 171 Bcf the week before, the EIA reports. The storage increase was bigger than the 24 Bcf average for the week, and above the 36 Bcf estimate. However, the price rised on 2.35% afterwards, supported by increased volume, which indicates the strength of the level. The upward movement towards the 3.3000 level is highly expected.
Additionally, seasonals suggest us that current prices may become the lowest till the end of the year. Historically, since August the natural gas prices increase in anticipation of a new heating season and higher energy demand (pic2).

CADCHF: Bullish Move After the Trap 🇨🇦🇨🇭
There is a high chance that CADCHF will go up today.
After a test of a key horizontal support, the price formed
a liquidity grab with a consequent bullish imbalance.
We can expect growth to 0.5887
❤️Please, support my work with like, thank you!❤️
I am part of Trade Nation's Influencer program and receive a monthly fee for using their TradingView charts in my analysis.

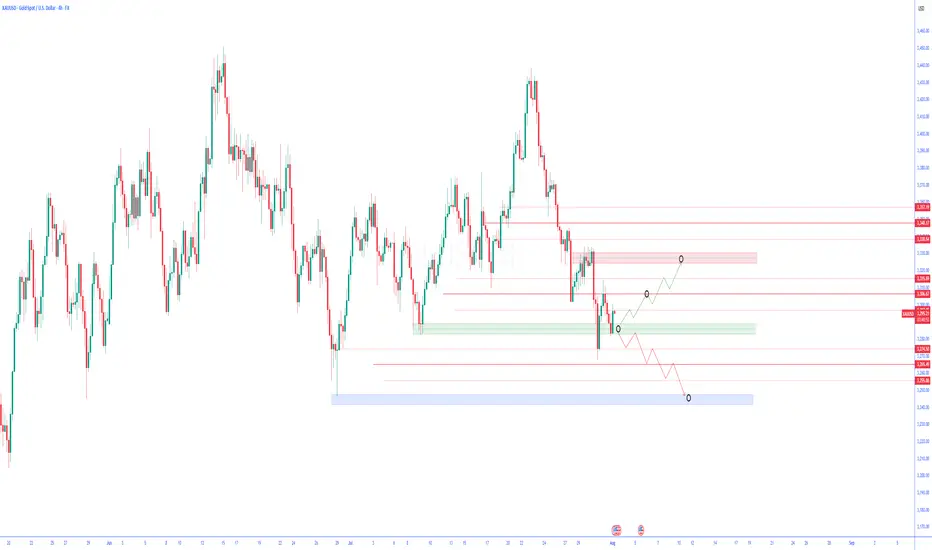
GBPJPY: Pullback From Resistance 🇬🇧🇯🇵
I think that GBPJPY will pull back from a wide
intraday supply area.
As a confirmation, I see a bearish imbalance candle that
is formed after its test.
Goal - 198.51
❤️Please, support my work with like, thank you!❤️
I am part of Trade Nation's Influencer program and receive a monthly fee for using their TradingView charts in my analysis.

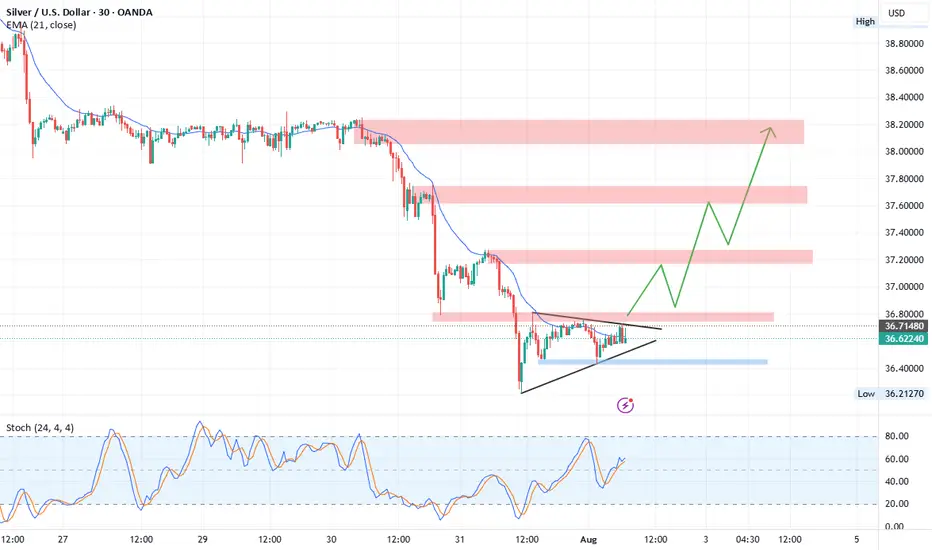
XAGUSD Technical Outlook (Silver/USD)Currently, Silver is trading inside a symmetrical triangle formation , signaling a potential breakout.
Upside Scenario:
A breakout above 36.80 resistance may trigger strong bullish momentum. The next target zone lies at 37.18 – 37.30, which is a relatively weak resistance and could potentially form a Head and Shoulders pattern . If momentum continues, Silver could extend gains toward 37.75 and 38.00 resistance levels.
Downside Scenario:
If the triangle breaks to the downside, we may see a short corrective move toward 3 6.25 – 36.20 support zone before any possible rebound.
Overall, the chart structure currently favors an upside breakout with continuation toward higher resistance zones.
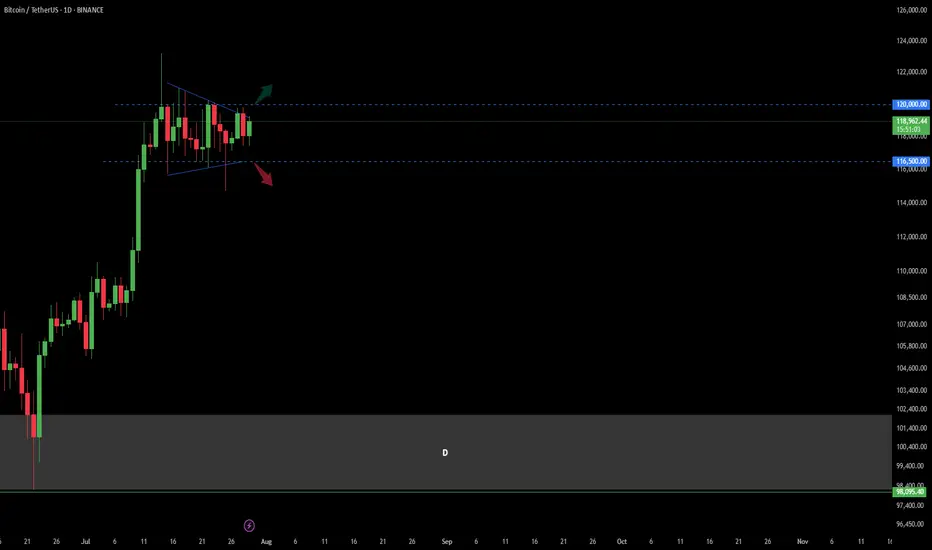
Bitcoin Trend Analaysis UP or DOWN?!Price capped in a wedge in Daily time frame.
There was a fake break from the bottom of this wedge last week and sharply got back to the top of it!
Now : break and confirm above 120 K in Daily would make the market BULLISH
break and confirm under 116.5 K in Daily would make the market BEARISH.
other wise market is still in a range mode...
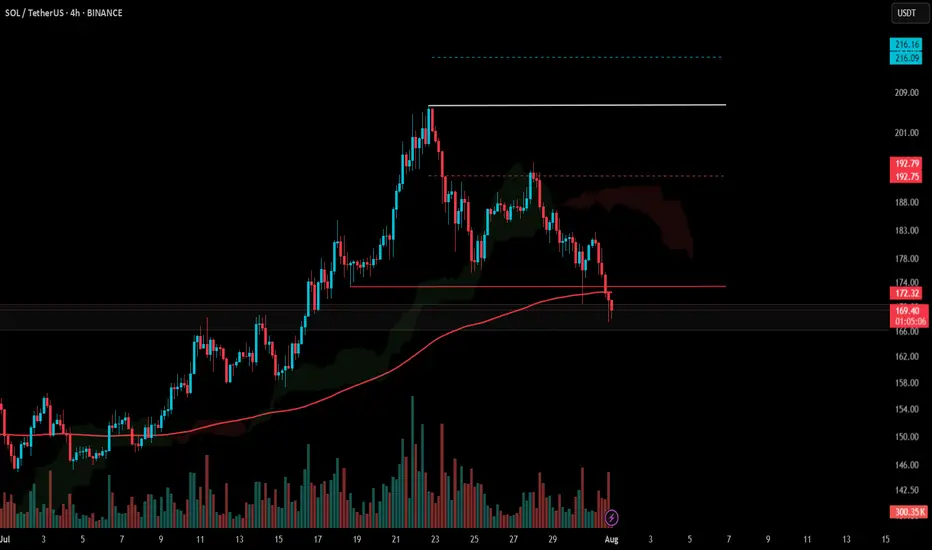
#SOL Update #6 – Aug 01, 2025#SOL Update #6 – Aug 01, 2025
Unfortunately, Solana failed to hold the last low where its most recent impulsive move had started, and it closed below that level. This close also occurred below the MA200 band. In other words, Solana broke a very strong support on the 4-hour chart and moved downward, reaching the previous K-Level zone. It’s hard to say anything positive for Solana at this stage. If the current K-Level fails to hold, Solana may look for support around the $158 level. A long position on Solana is definitely not recommended. I also do not suggest a short position. However, unless there’s a strong reversal, it’s safe to say that Solana has entered a bearish phase on the 4-hour chart.
GOLD (XAUUSD): Bearish Continuation Ahead?!
Gold retested a recently broken significant liquidity cluster.
I see a clear sign of strength of the sellers after its test
with multiple intraday confirmation.
I think that the price will retrace to day to 3276 level.
❤️Please, support my work with like, thank you!❤️
I am part of Trade Nation's Influencer program and receive a monthly fee for using their TradingView charts in my analysis.

BTCUSDT: Trend in daily time frameThe color levels are very accurate levels of support and resistance in different time frames.
A strong move requires a correction to major support and we have to wait for their reaction in these areas.
So, Please pay special attention to the very accurate trend, colored levels, and you must know that SETUP is very sensitive.
BEST,
MT

#BTC Update #13 – Aug 01, 2025#BTC Update #13 – Aug 01, 2025
Bitcoin has approached the lower edge of its current channel and received a reaction from there. However, in the current timeframe, the ongoing candle seems willing to pull back again. The MA200 band held the previous candle well, which also represented the bottom of the current channel. There is high liquidity between the $113,200 and $121,000 zones. I believe Bitcoin will continue to move by sweeping through this region. Therefore, I think Bitcoin’s current target is to reach around the $118,000 level with a 3% push move.
If Bitcoin does not make this move and chooses to pull back instead, it may go as far as filling the imbalance at the $110,000 level. The last impulsive move was made around 20 days ago, and since then, the chart has been progressing with a correction of a correction. As long as there’s no close below $107,500, the uptrend will remain intact in the long term. However, if the $107,500 level is broken with a strong candle, we can say that Bitcoin has turned bearish on the 4-hour timeframe. For now, this doesn’t seem very likely. I believe Bitcoin’s next move will target the $118,000 region, continuing to clear out the liquidity accumulating in the upper ranges. However, this channel will need to break at some point.

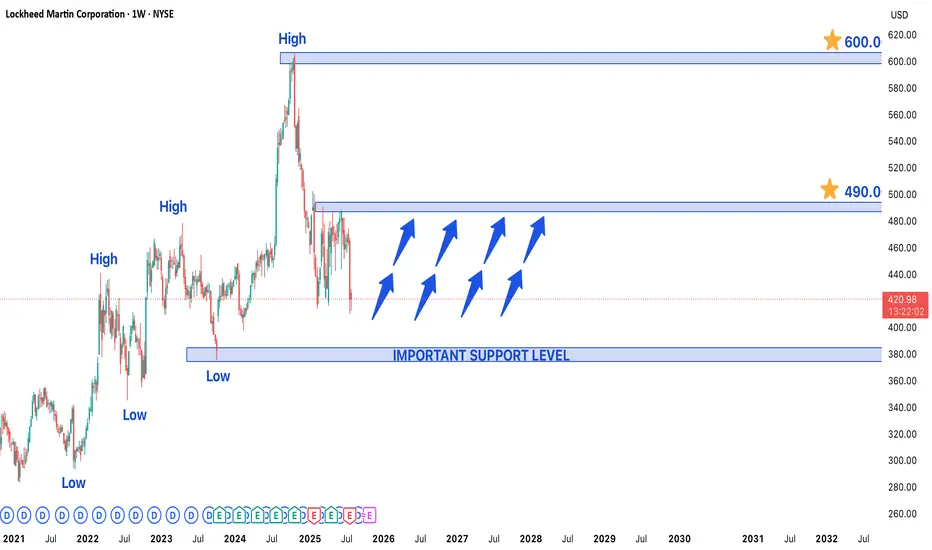
Lockheed Martin Stock in Bullish Trend - Key Levels to watchLockheed Martin (LMT) Stock in Strong Bullish Trend - Key Levels to Watch
Lockheed Martin's (LMT) stock is currently exhibiting a well-defined bullish trend, trading near a recent higher low that may serve as a crucial support level for the next upward move. The defense giant continues to benefit from robust global military spending and a strong contract pipeline, positioning the stock for potential further gains.
Technical Structure & Key Levels
- Higher Low Support: The current price zone represents a critical support area where buyers have previously stepped in, maintaining the upward trajectory
- Upside Targets:
- Near-term: $490 (previous resistance zone)
- Long-term: $600 (potential breakout extension)
- Major Support: $375 would act as strong demand zone if any deeper pullback occurs
Bullish Catalysts Supporting the Trend
1. Defense Sector Strength:
- Record US defense budget allocations for 2024-2025
- Increased NATO military spending amid global tensions
2. Contract Backlog:
- F-35 program continues to drive revenue
- Hypersonic weapons and space systems development
3. Technical Momentum:
- Price trading above key moving averages (50/200 DMA)
- Higher highs and higher lows confirm uptrend structure
Trading Strategy Considerations
- Optimal Entry:
- On bounces from current support level
- On breakout above $460 confirmation
- Risk Management:
- Stop-loss below $375 for longer-term positions
- Partial profit-taking near $490 resistance
- Confirmation Signals:
- Volume increase on upside moves
- Sustained closes above $460
Potential Risks to Monitor
- Geopolitical shifts affecting defense budgets
- Program delays (particularly in F-35 production)
- Broader market corrections impacting defense sector
Long-Term Outlook:
The combination of fundamental strength and technical positioning suggests LMT could progress toward $490 near-term, with $600 as a viable long-term target if the bullish structure holds. Traders should watch price action around current levels for continuation signals while remaining mindful of the $375 support as a critical level for the bullish thesis.
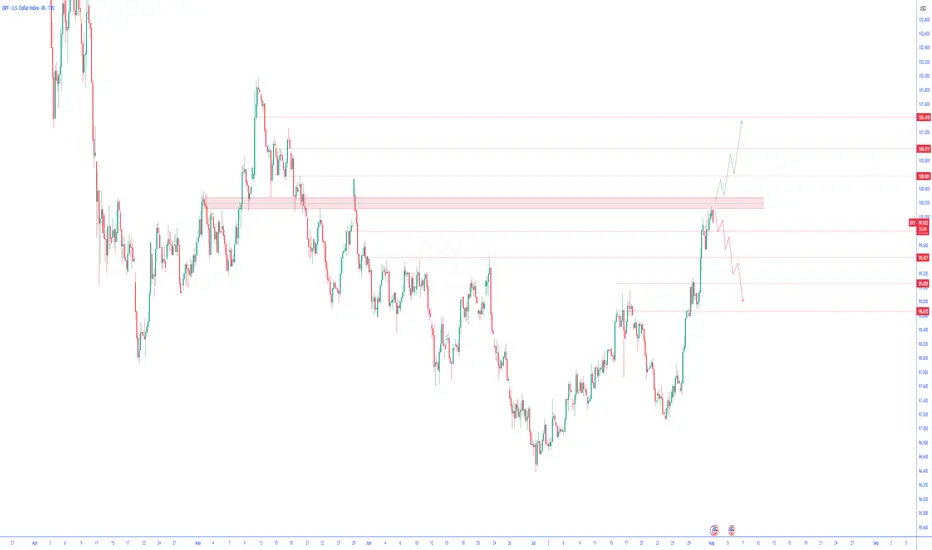
U.S. Dollar Index (DXY) Technical Analysis – 4-Hour TimeframeU.S. Dollar Index (DXY) Technical Analysis – 4-Hour Timeframe
Following yesterday’s economic data from the United States, which included stronger-than-expected GDP growth and consumer confidence figures, the U.S. Dollar Index (DXY) has continued its upward trend with strength. These developments have reinforced expectations for continued monetary tightening—or at least keeping interest rates elevated—which in turn has boosted demand for the dollar.
On the 4-hour chart, after a strong bullish rally, the dollar index has now reached a key resistance zone that previously acted as a major barrier.
Bullish Scenario:
If the current resistance zone is decisively broken and price stabilizes above it, the bullish momentum could extend further toward higher technical levels. This scenario would gain additional strength if upcoming economic data continues to support the dollar.
Bearish Scenario:
However, if the price fails to break through the resistance and signs of buyer weakness begin to emerge, a corrective pullback toward previous support levels may occur. This scenario could be further intensified if weaker economic data is released or if the Federal Reserve signals a more dovish stance.
At the moment, traders are advised to closely monitor the price reaction to the current zone and wait for confirmation before committing to the next move.
Technical Analysis of Gold Chart (XAU/USD) – 4-Hour TimeframeTechnical Analysis of Gold Chart (XAU/USD) – 4-Hour Timeframe
Following the heavy selling pressure seen in recent days, the price of gold has now reached a zone that has repeatedly shown reactions in the past. This green-colored support area can currently play a decisive role in the market’s next move.
Price Movement Outlook:
Scenario 1 – Bullish Correction Move:
If buyers manage to take control of the market in this zone, it is expected that gold will gradually pass through intermediate resistance levels and first enter the medium-term resistance area. If momentum is maintained, the price could then move toward higher highs. This move can be interpreted as a technical correction against the recent bearish wave and may attract short-term traders until reaching strong supply zones.
Scenario 2 – Continuation of the Downtrend:
Conversely, a confirmed break of this support with high volume and strong bearish candles could lead to a further decline in price toward previous lows. In this case, the blue-colored area at the lowest part of the chart would serve as the next demand zone.
Key Point:
The market is currently in a decision-making phase. Confirmation of reactions at this support area is extremely important in determining the market’s future direction. Therefore, entering the market prematurely without waiting for confirmation of price behavior could involve high risk.
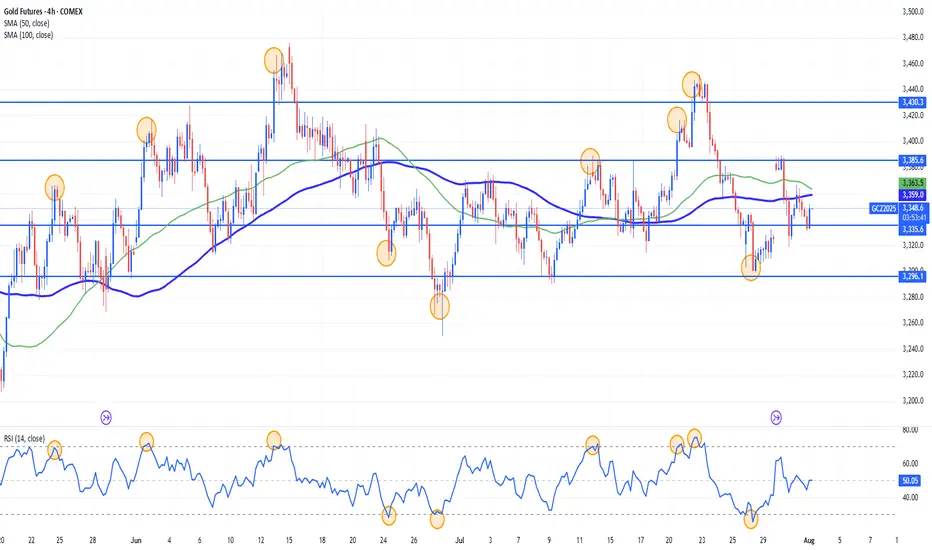
Gold Range-Bound and Ripe for Mean Reversion Plays?Gold has been locked in a sideways, range-bound regime for months, largely oscillating between the 3400 and 3160 levels. This lack of clear directional trend stems from conflicting fundamental forces: on one hand, sticky inflation and resilient U.S. data have bolstered the U.S. dollar and yields, weighing on gold. On the other, global growth concerns and geopolitical tensions continue to underpin demand for the metal as a safe haven. The push and pull of these opposing themes has created an environment of indecision and choppy price action.
While long-term investors may find this frustrating, range traders and mean reversion strategies are thriving. With technical boundaries so well-defined, short-term oscillations within the range are offering repeated opportunities for disciplined entry and exit.
Currently, XAUUSD is trading just under the 3296 level after a recent rejection from the 3350s. The bearish structure suggests a potential leg down toward the 3160–3180 support zone. However, absent any major economic surprises or geopolitical shocks, this could merely be another deviation from the mean rather than a true breakdown. Indicators like RSI and Stochastic Oscillator are already hinting at early signs of bullish divergence.
If price holds above or near 3160, the setup for another mean-reversion trade back toward the mid-range (around 3296 or higher) could unfold. In the current environment, fading extremes rather than chasing trends remains a strategy of edge, as depicted by the 14 period RSI.
XRPUSD downside target 2.656On the daily chart, XRPUSD has retreated from its highs, with short-term bears dominating. Currently, the price is in a downward trend, so shorting near the downtrend line resistance is recommended, with a target around 2.656.

renderwithme ||| XAU/USD Monthly Analysis (August 2025 Outlook) #Fundamental Analysis
Gold prices are influenced by macroeconomic factors, monetary policy, and geopolitical events. Based on recent data:Federal Reserve Policy: The Fed’s decision to maintain interest rates at 4.25–4.50% in July 2025, with a hawkish tilt, has strengthened the US dollar, putting downward pressure on gold. A stronger USD typically reduces gold’s appeal as it’s priced in dollars. However, expectations of a potential rate cut in September could support gold if signaled by Fed Chair Jerome Powell. Watch for updates in the FOMC statement or Powell’s comments for clues on future policy.
#Economic Indicators:
Strong US economic data, such as a robust labor market (jobless claims at a 3-month low) and rising consumer confidence (Conference Board’s Index at 97.2 in July), suggest increased economic activity, which could bolster the USD and limit gold’s upside. Upcoming data like the US PCE Price Index and Nonfarm Payrolls (NFP) in early August will be critical for gauging inflation and labor market trends, impacting gold’s trajectory.
Geopolitical and Safe-Haven Demand: Reduced safe-haven demand due to de-escalating global trade tensions and geopolitical stability has capped gold’s gains. However, any escalation in conflicts (e.g., Russia-Ukraine or Middle East) or renewed trade disputes could drive demand for gold as a safe-haven asset.
Central Bank Demand: Continued central bank gold purchases could provide long-term support, but a slowdown in buying might weigh on prices.
# Inflation and Currency Dynamics:
Persistent US inflation supports the USD, limiting gold’s attractiveness. Conversely, a recovering Chinese economy or global policy easing could boost gold demand.
#Technical Analysis
Recent technical data suggests a mixed outlook for XAU/USD on the monthly timeframe:Price Levels and Trends: As of late July 2025, XAU/USD is trading around $3,291–$3,337, consolidating after retreating from a high of $3,440. The monthly chart shows a medium-term uptrend channel that began in early 2025, with support around $3,285–$3,300 and resistance at $3,355–$3,430. A decisive break above $3,355 could signal bullish momentum toward $3,500 or higher, while a break below $3,285 might target $3,130 or lower.
Indicators: The 14-day RSI at 46.10 suggests neutral momentum, neither overbought nor oversold. Technical indicators show mixed signals, with 15 bearish and 11 bullish signals as of July 28, 2025, reinforcing a cautious outlook.
Key Levels: Support: $3,275–$3,225 (major demand zone), $3,130 (potential deeper pullback).
Resistance: $3,355, $3,430, $3,500 (psychological level).
A bearish descending channel on shorter timeframes (e.g., 1H, 3H) suggests potential downside unless $3,320 is breached.
Monthly ForecastBearish Scenario: If the USD remains strong due to hawkish Fed signals, persistent inflation, or robust US economic data, XAU/USD could test support at $3,275–$3,225. A break below this zone might lead to $3,130 or even $2,900 in a deeper correction, especially if safe-haven demand weakens further.
Bullish Scenario: A Fed signal of rate cuts, renewed geopolitical tensions, or increased central bank buying could push gold above $3,355, targeting $3,430 or $3,500. A breakout above $3,430 could aim for $3,830, as suggested by some analysts.
Expected Range: For August 2025, XAU/USD is likely to trade between $3,225 and $3,430, with volatility driven by US economic data and Fed policy updates. A monthly close above $3,430 would strengthen the bullish case, while a close below $3,225 would favor bears.
Trading ConsiderationsRisk Management: Given the mixed signals, use tight stop-losses. For bullish trades, consider entries near $3,275–$3,300 with stops below $3,225. For bearish trades, enter near $3,320 with stops above $3,355.
Key Events to Watch: Monitor the US PCE Price Index, NFP report, and Fed statements in early August for directional cues. Geopolitical developments could also trigger sudden moves.
Volatility: The 30-day volatility is low at 0.91%, suggesting consolidation, but upcoming data releases could spark sharper moves.
# Chart for the reference will give u better idea to take decisions
in my views top has been made
~~ Disclaimer ~~
This analysis is based on recent technical data and market sentiment from web sources. It is for informational \ educational purposes only and not financial advice. Trading involves high risks, and past performance does not guarantee future results. Always conduct your own research or consult a SEBI-registered advisor before trading.
# Boost and comment will be highly appreciated.


CADCHF: Bullish Continuation After Consolidation📈 CADCHF was consolidating for almost a month in a horizontal range on the daily chart.
Following a significant bullish surge, it broke above resistance yesterday.
The price is likely to continue rising, with targets set at 0.5913 and 0.5940.

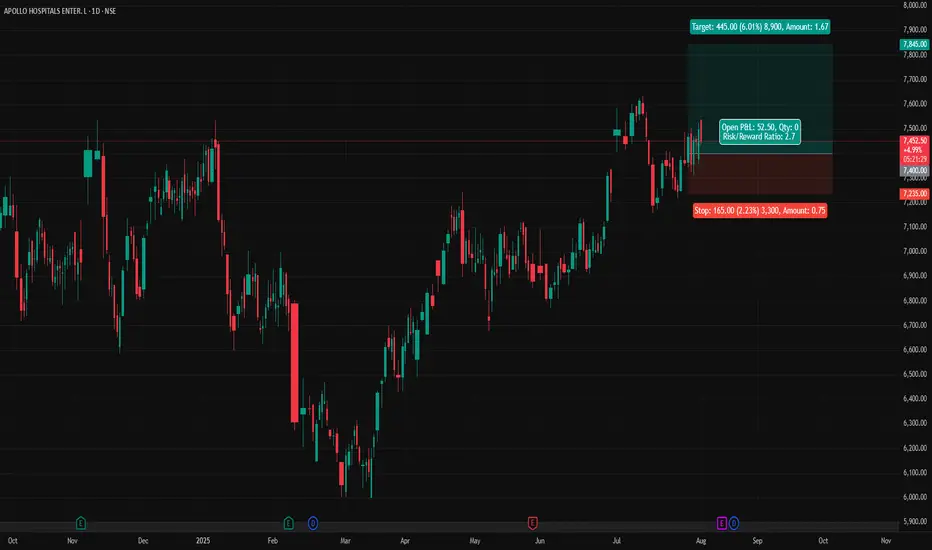
APOLLOHOSP - Apollo Hospitals (Daily chart, NSE) - Long PositionAPOLLOHOSP - Apollo Hospitals Enterprise Ltd. (Daily chart, NSE) - Long Position
Risk assessment: Medium {support structure integrity risk}
Risk/Reward ratio ~ 2.7
Current Market Price (CMP) ~ 7450
Entry limit ~ 7400 on Aug. 01, 2025
Target limit ~ 7845 (+6.01%; +445 points)
Stop order limit ~ 7235 (-2.23%; -165 points)
Disclaimer: Investments in securities markets are subject to market risks. All information presented in this group is strictly for reference and personal study purposes only and is not a recommendation and/or a solicitation to act upon under any interpretation of the letter.
LEGEND:
{curly brackets} = observation notes
= important updates
(parentheses) = information details
~ tilde/approximation = variable value
-hyphen = fixed value
ETHUSDT.PIf you look at the chart, you will notice an uptrend that has somewhat lost its strength and we may not be able to hit higher highs like the next strength in the next move.
Support: 3.660 - 3.590 - 3.160
Resistance: 3.900 - 4.260
Entry: 3.700
SL: 3.500
TP: 4.240
Please control risk management.⚠️
