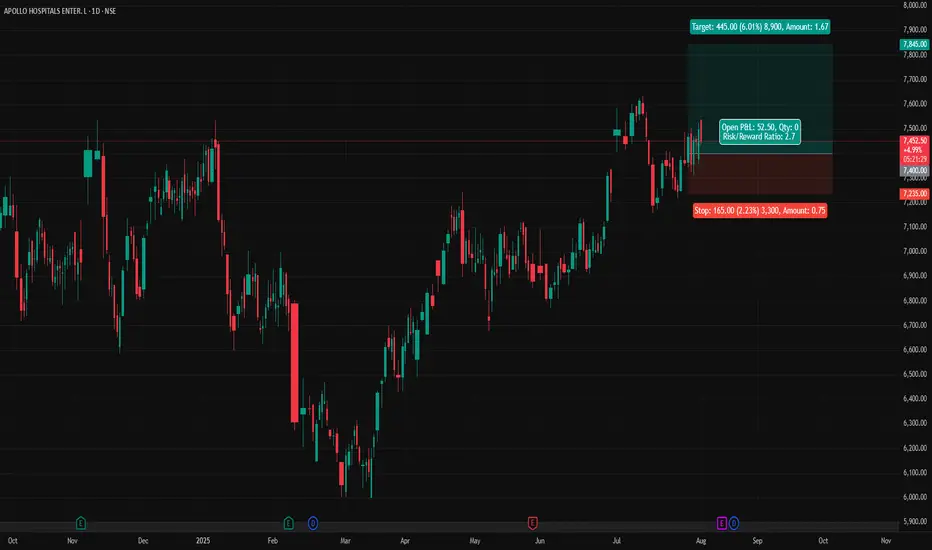
APOLLOHOSP - Apollo Hospitals (Daily chart, NSE) - Long PositionAPOLLOHOSP - Apollo Hospitals Enterprise Ltd. (Daily chart, NSE) - Long Position
Risk assessment: Medium {support structure integrity risk}
Risk/Reward ratio ~ 2.7
Current Market Price (CMP) ~ 7450
Entry limit ~ 7400 on Aug. 01, 2025
Target limit ~ 7845 (+6.01%; +445 points)
Stop order limit ~ 7235 (-2.23%; -165 points)
Disclaimer: Investments in securities markets are subject to market risks. All information presented in this group is strictly for reference and personal study purposes only and is not a recommendation and/or a solicitation to act upon under any interpretation of the letter.
LEGEND:
{curly brackets} = observation notes
= important updates
(parentheses) = information details
~ tilde/approximation = variable value
-hyphen = fixed value
Support and Resistance
ETHUSDT.PIf you look at the chart, you will notice an uptrend that has somewhat lost its strength and we may not be able to hit higher highs like the next strength in the next move.
Support: 3.660 - 3.590 - 3.160
Resistance: 3.900 - 4.260
Entry: 3.700
SL: 3.500
TP: 4.240
Please control risk management.⚠️

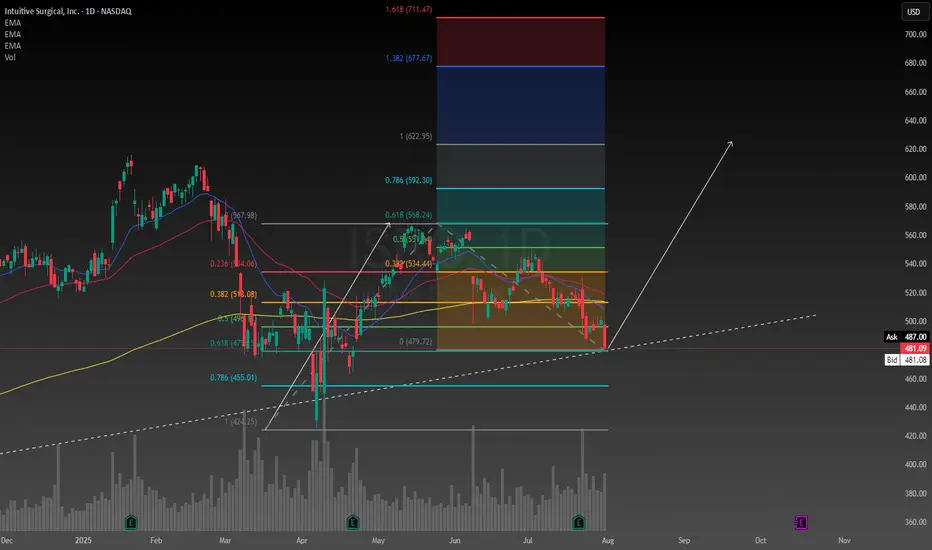
Technically Intuitive Surgical looks like it has found supportBecause I don't know much about the healthcare industry I have been avoiding it thus far. However I have done some research on Intuitive Surgical and was surprised to learn about what they do. The company is a mix between technology and healthcare, there's nobody to compete with them either which was something I found to be valuable at this time.
I have conducted a technical analysis using a trendline and a Fibonacci measurement. The risk is high, fundamentally the stock is very overvalued, but I believe this may be because of the potential the company has to grow. Every hospital is saying the same thing, they are understaffed. I feel like this company might have a positive influence to healthcare and hospitals in the future.
I have calculated the intrinsic value using the discounted cash flow model. Assuming a discount rate of 6.4%, with a 5 year exit the intrinsic value is $365. After running the numbers with a discount rate between 5.8% and 7.0% the range of the intrinsic value is between $235 and $1070 so there is clearly a potential for a significant upside. But I am taking a cautious approach because like I mentioned it is still looking over valued. I want to take the risk of owning this stock but I will monitor the company closely to make sure the fundamentals do not change as to why I decided to buy it in the first place.
I think the technical analysis I have drawn on the chart speaks for itself no need to explain much I think most people know technical analysis. I want to buy it tomorrow but I might wait a week or so to see how the tariff drama plays out and whether I can get a better deal or not I will probably enter with a stop order because I want to enter when the price is going up maybe above the next green bar on the daily we shall see I am being very cautious this time. I will start by allocating 5% of my portfolio to ISRG but that's always subject to change in the future.
XAUUSD Price at Decision Point – Bounce or Breakdown?Gold (XAUUSD) is currently trading between two significant zones — a ⏫ 1H Order Block above and a 🛑 Major Support level at 3268.
At this stage, price action remains undecided, and we have a few key scenarios to monitor:
🔄 Potential Scenarios:
📌 Price taps into the 1H OB, then shows signs of rejection — this could trigger a move back down toward support.
⬇️ Price drops directly to 3268, where buyers may step in for a potential bounce.
🚀 If the price breaks through the OB, it may continue pushing up toward the liquidity area around 3248.
⚠️ If support fails, we could see a deeper bearish continuation.
These zones are crucial for both intraday and swing setups. Be patient and wait for a clean reaction to catch a high-probability move.

AUD/JPY bulls eye 99, 100The yen is broadly weaker, which is even allowing a weaker Australian dollar to rise. And with a decent bullish trend on the daily chart, I am now seeking dips within a recent consolidation range in anticipation of a move to 99 or even 100.
Matt Simpson, Market Analyst at City Index and Forex.com

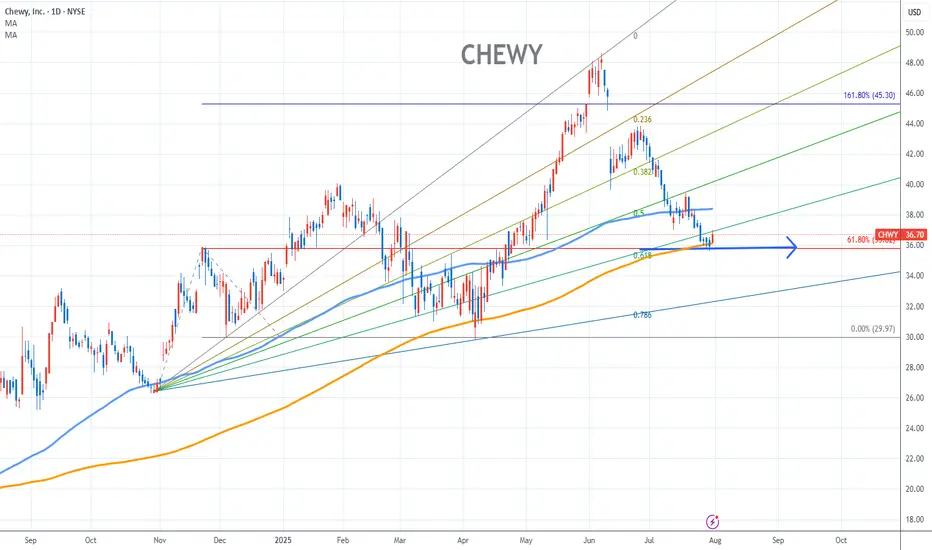
Chewy Stock Chart Fibonacci Analysis 073125Trading Idea
1) Find a FIBO slingshot
2) Check FIBO 61.80% level
3) Entry Point > 36/61.80%
Chart time frame:D
A) 15 min(1W-3M)
B) 1 hr(3M-6M)
C) 4 hr(6M-1year)
D) 1 day(1-3years)
Stock progress:C
A) Keep rising over 61.80% resistance
B) 61.80% resistance
C) 61.80% support
D) Hit the bottom
E) Hit the top
Stocks rise as they rise from support and fall from resistance. Our goal is to find a low support point and enter. It can be referred to as buying at the pullback point. The pullback point can be found with a Fibonacci extension of 61.80%. This is a step to find entry level. 1) Find a triangle (Fibonacci Speed Fan Line) that connects the high (resistance) and low (support) points of the stock in progress, where it is continuously expressed as a Slingshot, 2) and create a Fibonacci extension level for the first rising wave from the start point of slingshot pattern.
When the current price goes over 61.80% level , that can be a good entry point, especially if the SMA 100 and 200 curves are gathered together at 61.80%, it is a very good entry point.
As a great help, tradingview provides these Fibonacci speed fan lines and extension levels with ease. So if you use the Fibonacci fan line, the extension level, and the SMA 100/200 curve well, you can find an entry point for the stock market. At least you have to enter at this low point to avoid trading failure, and if you are skilled at entering this low point, with fibonacci6180 technique, your reading skill to chart will be greatly improved.
If you want to do day trading, please set the time frame to 5 minutes or 15 minutes, and you will see many of the low point of rising stocks.
If want to prefer long term range trading, you can set the time frame to 1 hr or 1 day.
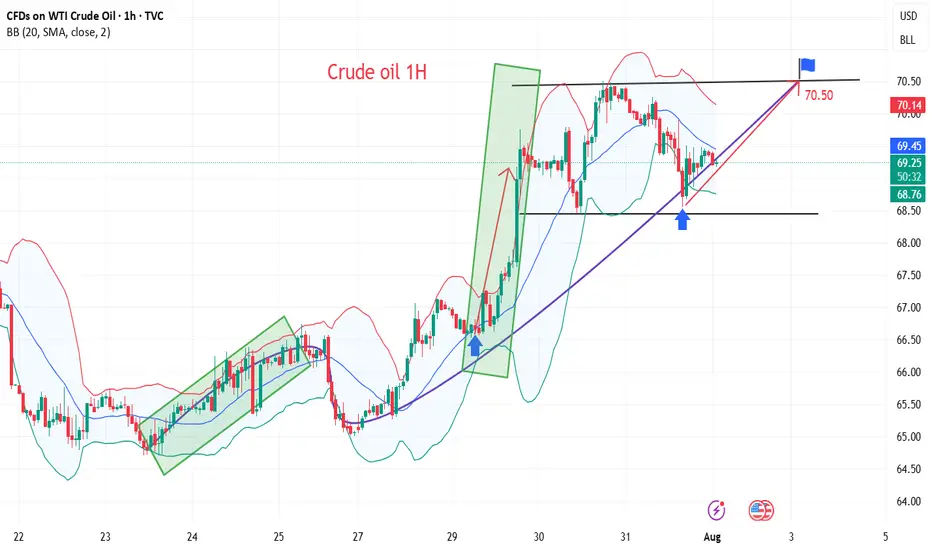
Oil prices rebound, maintain bullish attitude
💡Message Strategy
International oil prices continued their upward trend on Thursday, closing higher for the fourth consecutive day, as concerns about growing global supply tightness abounded. Brent crude for September delivery rose 0.4% to $73.51 a barrel, while West Texas Intermediate (WTI) crude for September delivery rose 0.5% to $70.37 a barrel, while the more active Brent October contract rose 0.4% to $72.76 a barrel.
Recently, the market has focused on the statement of US President Trump, who demanded that Russia make "substantial progress" on the situation in Ukraine within 10-12 days, otherwise he would impose 100% secondary tariffs on its trading partners, significantly bringing forward the previous 50-day deadline.
Inventory data suggests a continued struggle between supply and demand. Data from the U.S. Energy Information Administration (EIA) showed that U.S. crude oil inventories unexpectedly rose by 7.7 million barrels to 426.7 million barrels in the week ending July 25, far exceeding expectations for a 1.3 million barrel drop. However, gasoline inventories fell by 2.7 million barrels to 228.4 million barrels, exceeding market expectations for a 600,000 barrel drop.
📊Technical aspects
From a daily perspective, WTI crude oil prices have closed higher for four consecutive days since rebounding from the $66 level. It is currently running stably above the integer mark of $70 per barrel. The short-term moving average system is in a bullish arrangement, and the MACD indicator remains above the zero axis, indicating that the bullish momentum is still strong.
From an hourly perspective, if the price breaks through the previous high of $70.50, it is expected to further rise to the $73.50-$75 range. Conversely, if it continues to fall below the $70 mark, it may trigger short-term profit-taking, and further support will focus on the $68.50 level. Overall, the short-term trend remains bullish.
💰Strategy Package
Long Position:68.00-68.50,SL:67.50,Target:70.50-73.00
HEAD & SHOULDER DAILY TIME FRAME! (DOUBLE WHAMMY!!!!)The market has previously created a left shoulder. Now, it has broken out of the top of the Resistance and broken back into the support and resistance, about to form the right shoulder.
Wait for retest of the resistance then sell to the support, AND THEN BUY IT BACK TTHE RESISTANCE!! DOUBLE WHAMMMY!!

Review a Few of our Trades & Update Overall Market PerspectiveIn this video, I review some of the trades taken over the past 1-2 weeks, and discuss in more detail the current technical and geopolitical/macro thesis on AMEX:SPY NASDAQ:QQQ NASDAQ:SQQQ AMEX:SOXS , and the overall market. Exciting times, and ripe with opportunity to *potentially* BTD (again).

USDJPY: The Fed & BOJ Likely To Keep Rates In Place. Buy It!Welcome back to the Weekly Forex Forecast for the week of July 28 - Aug 1st.
In this video, we will analyze the following FX market:
USDJPY
The FED and BOJ are expected to keep their perspective interest rates, come Wednesday. The USD is stabilizing, a US-Japanese tariff deal inked, and investors are slowing moving money from the Yen safe haven to riskier assets.
Look for USDJPY to slowly move higher.
Enjoy!
May profits be upon you.
Leave any questions or comments in the comment section.
I appreciate any feedback from my viewers!
Like and/or subscribe if you want more accurate analysis.
Thank you so much!
Disclaimer:
I do not provide personal investment advice and I am not a qualified licensed investment advisor.
All information found here, including any ideas, opinions, views, predictions, forecasts, commentaries, suggestions, expressed or implied herein, are for informational, entertainment or educational purposes only and should not be construed as personal investment advice. While the information provided is believed to be accurate, it may include errors or inaccuracies.
I will not and cannot be held liable for any actions you take as a result of anything you read here.
Conduct your own due diligence, or consult a licensed financial advisor or broker before making any and all investment decisions. Any investments, trades, speculations, or decisions made on the basis of any information found on this channel, expressed or implied herein, are committed at your own risk, financial or otherwise.

S&P 500 (ES1): Post FOMC, Buyers Pushing Back To The Highs!In this video, we will analyze the following FX market for July 31 - Aug 1st.
S&P 500 (ES1!)
In the Weekly Forecast for the S&P 500, we highlighted:
- price is bullish, and expected to go higher. It did move to ATH before pulling back.
- the sell side liquidity under the ascending lows would draw price.... which it did.
- the Area of Fair Value below the lows, with the Demand Zone as the potential level where a
a high probability long could setup.... which was spot on!
Did you benefit from the forecast? Let me hear from you if you did, in the comment section.
Enjoy!
May profits be upon you.
Leave any questions or comments in the comment section.
I appreciate any feedback from my viewers!
Like and/or subscribe if you want more accurate analysis.
Thank you so much!
Disclaimer:
I do not provide personal investment advice and I am not a qualified licensed investment advisor.
All information found here, including any ideas, opinions, views, predictions, forecasts, commentaries, suggestions, expressed or implied herein, are for informational, entertainment or educational purposes only and should not be construed as personal investment advice. While the information provided is believed to be accurate, it may include errors or inaccuracies.
I will not and cannot be held liable for any actions you take as a result of anything you read here.
Conduct your own due diligence, or consult a licensed financial advisor or broker before making any and all investment decisions. Any investments, trades, speculations, or decisions made on the basis of any information found on this channel, expressed or implied herein, are committed at your own risk, financial or otherwise.

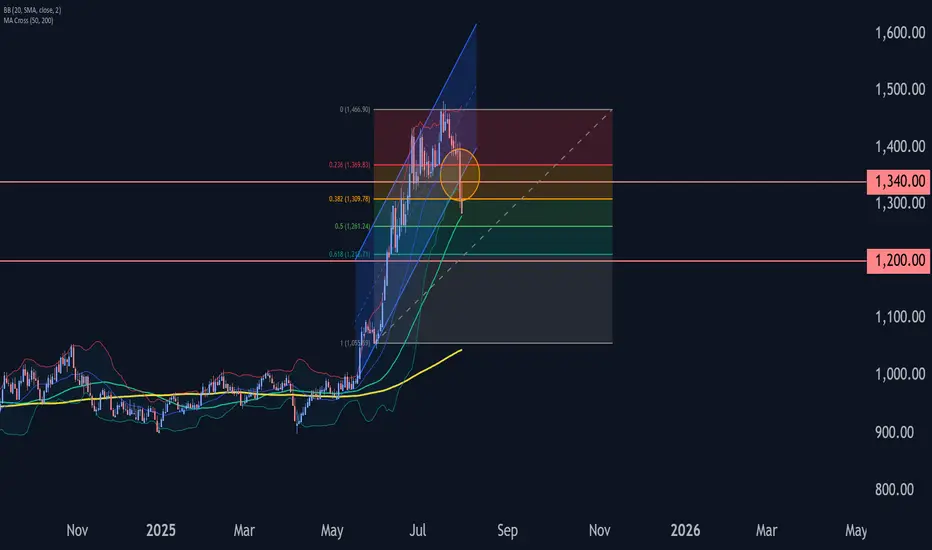
Platinum Wave Analysis – 31 July 2025- Platinum broke support zone
- Likely to fall to support level 1200.00
Platinum recently broke the support zone located between the key support level 1340.00 (low of the previous minor correction iv) and the support trendline of the daily up channel from May.
The breakout of this support zone accelerated the c-wave of the active ABC correction 4.
Given the bearish sentiment across the precious metals markets, Platinum can be expected to fall to the next support level 1200.00 (target for the completion of the active wave c).
Johnson & Johnson Wave Analysis – 31 July 2025 Johnson & Johnson reversed from the resistance zone
- Likely to fall to support level 160.00
Johnson & Johnson recently reversed down from the strong resistance zone located between the long-term resistance level 168.15 (upper border of the weekly sideways price range from 2023) and the upper weekly Bollinger Band.
The downward reversal from this resistance zone stopped the earlier intermediate impulse wave (3).
Given the strength of the resistance level 168.15 and the overbought weekly Stochastic, Johnson & Johnson can be expected to fall to the next support level 160.00.

USDCAD Wave Analysis – 31 July 2025
- USDCAD broke resistance zone
- Likely rise to resistance level 1.3900
USDCAD currency pair recently broke the resistance zone located between the resistance level 1.3785 (upper border of the sideways price range from the start of June) and the 50% Fibonacci correction of the downward impulse from May.
The breakout of this resistance zone accelerated the active impulse wave 3, which belongs to medium-term impulse wave (B) from the start of July.
USDCAD currency pair can be expected to rise further to the next resistance level 1.3900 (target price for the completion of the active impulse wave 3).

USDJPY Wave Analysis – 31 July 2025- USDJPY broke resistance zone
- Likely rise to resistance level 152.00
USDJPY currency pair recently broke the resistance zone located between the resistance level 148.85 (which stopped earlier waves A and i) and the 50% Fibonacci correction of the downward impulse from January.
The breakout of this resistance zone accelerated the active impulse wave c, which belongs to medium-term ABC correction (2) from April.
USDJPY currency pair can be expected to rise further to the next resistance level 152.00 (target price for the completion of the active impulse wave C).

NZDJPY to find sellers at market price?NZDJPY - 24h expiry
Trading has been mixed and volatile.
Price action looks to be forming a top.
We look for a temporary move higher.
Preferred trade is to sell into rallies.
Bespoke resistance is located at 88.90.
We look to Sell at 88.90 (stop at 89.10)
Our profit targets will be 88.10 and 87.90
Resistance: 89.00 / 89.20 / 89.50
Support: 88.40 / 88.10 / 87.90
Risk Disclaimer
The trade ideas beyond this page are for informational purposes only and do not constitute investment advice or a solicitation to trade. This information is provided by Signal Centre, a third-party unaffiliated with OANDA, and is intended for general circulation only. OANDA does not guarantee the accuracy of this information and assumes no responsibilities for the information provided by the third party. The information does not take into account the specific investment objectives, financial situation, or particular needs of any particular person. You should take into account your specific investment objectives, financial situation, and particular needs before making a commitment to trade, including seeking, under a separate engagement, as you deem fit.
You accept that you assume all risks in independently viewing the contents and selecting a chosen strategy.
Where the research is distributed in Singapore to a person who is not an Accredited Investor, Expert Investor or an Institutional Investor, Oanda Asia Pacific Pte Ltd (“OAP“) accepts legal responsibility for the contents of the report to such persons only to the extent required by law. Singapore customers should contact OAP at 6579 8289 for matters arising from, or in connection with, the information/research distributed.

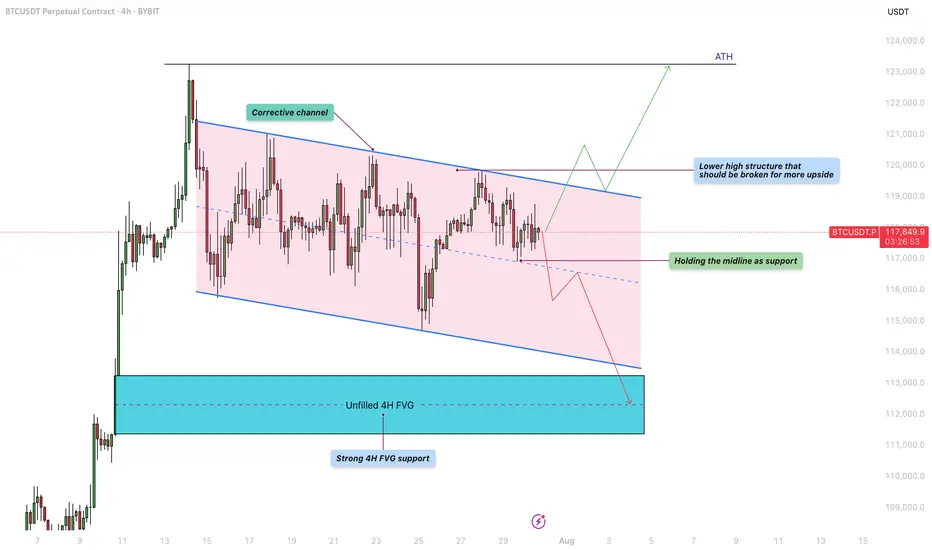
Bitcoin - Will the liquidity at $122K be the next target?Bitcoin is currently trading within a defined corrective channel, which has been developing over the past few weeks. Price action within this structure has been characterized by a sequence of lower highs and lower lows, suggesting a mild downtrend. However, these movements lack strong momentum, indicating that the market is consolidating rather than entering a deeper correction. This kind of structure often precedes a significant breakout, and given the nature of the current price action, a retest of previous highs remains a realistic possibility.
Bullish Scenario
Looking at the overall structure of the channel, a bullish breakout seems increasingly likely. For this scenario to unfold, BTC needs to hold the midline of the channel as support. If this level is respected, it could pave the way for a push towards the upper boundary of the channel and a potential break above the lower high structure near $120,000. A successful breach of that level could trigger a move toward the $122,000 liquidity zone, with the potential to challenge the all-time high (ATH) in the near future. Holding the midline and breaking above key resistance would provide confirmation of strength and continuation to the upside.
Bearish Scenario
On the flip side, if BTC fails to hold the midline as support and starts closing below it on the 4H timeframe, we could see a renewed move toward the lower boundary of the corrective channel. This could lead to a test of the unfilled 4H fair value gap (FVG) highlighted in the chart, located around the $112,000 – $113,000 area. This zone also coincides with a strong historical support level, making it a logical area where buyers might step in and provide the momentum needed for a more sustainable bullish reversal.
Final Thoughts
While both scenarios remain valid, the price structure within the corrective channel currently leans slightly more toward a bullish outcome. The lack of aggressive selling and the potential for liquidity above the previous highs support this view. However, trading is never about certainty but about preparing for various possibilities. Being aware of both bullish and bearish setups allows traders to react with flexibility and discipline depending on how the market unfolds in the coming sessions.
-------------------------
Thanks for your support. If you enjoyed this analysis, make sure to follow me so you don't miss the next one. And if you found it helpful, feel free to drop a like 👍 and leave a comment 💬, I’d love to hear your thoughts!
Stock Of The Day / 07.31.25 / ALGN07.31.2025 / NASDAQ:ALGN
Fundamentals. Suspected of possible violations of federal securities laws on the back of a negative earnings report.
Technical Analysis.
Daily Chart: Downtrend. Level 127.88 formed by the trend break in March 2020 is ahead.
Premarket: Gap down on increased volume. We mark the trend break level in the premarket at 140.0.
Trading Session: The price held the 140.0 level twice during the first hour after the opening of the trading session. Note the clear hold in the first case and the hold with false breakouts in the second. Also note that each subsequent pullback was smaller than the previous one. We are considering a short trade to continue the downward movement in case of the breakdown and hold of the 140.0 level.
Trading scenario: breakdown with retest (tightening with retest) of level 140.0
Entry: 139.67 after breakdown and hold the price below the level.
Stop: 140.11 we hide it above the tail of the retest candle.
Exit: We observe the strong downtrend. Cover the part of the position at 132.08 when the structure of the downtrend is broken (RR 1/17), after the downtrend resumes, hold the rest of the position until level 127.88 (1/25).
Risk Rewards: 1/21 (max. 1/25)
P.S. In order to understand the idea of the Stock Of The Day analysis, please read the following information .

Jsw energy fibonachi supports Jsw has taken support of 418 (golden ration 61.8) and then at 490(ratio .5) so 485 is the stop loss and it is ready for target of 595
Cmo 512

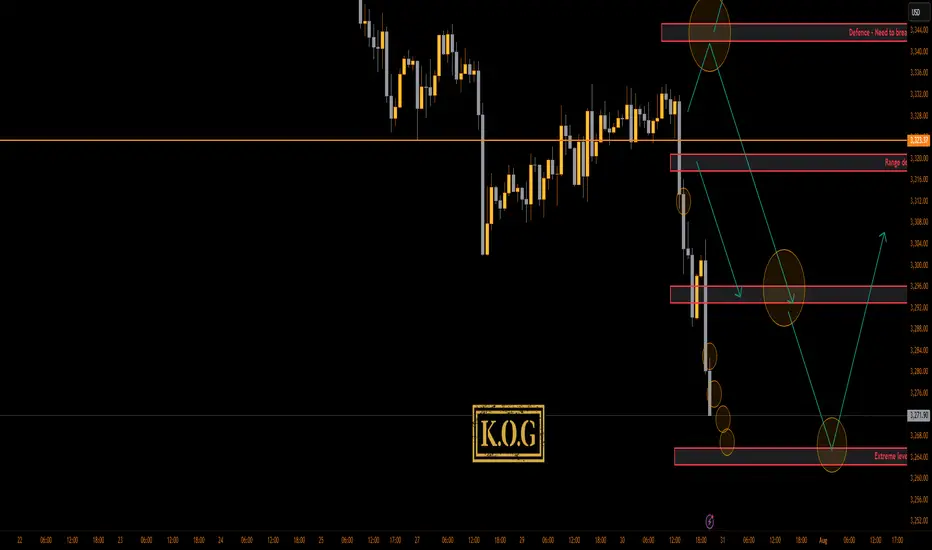
THE KOG REPORT - UpdateEnd of FOMC Update:
Thank you.
RED BOX TARGETS:
Break above 3335 for 3338, 3340, 3345, 3347 and 3357 in extension of the move
Break below 3320 for 3310✅, 3306✅, 3302✅, 3297✅ and 3393✅ in extension of the move
Please do support us by hitting the like button, leaving a comment, and giving us a follow. We’ve been doing this for a long time now providing traders with in-depth free analysis on Gold, so your likes and comments are very much appreciated.
As always, trade safe.
KOG
Journey of silver buy at support sell at resistance There is Up trending channel, follow the channel and make money since silver is long term bullish atleast.
Not mentioning the levels do the math follow the channel and find the support

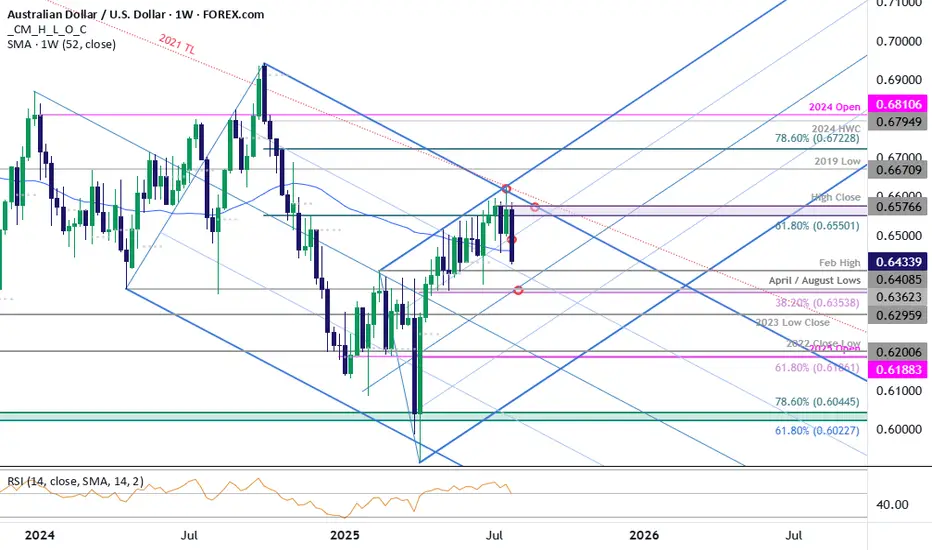
AUD/USD Rejected at Resistance-Fed on TapYesterday’s Fed-induced sell-off broke through the monthly opening-range lows / 52-week moving average with the bears now poised to mark a sixth-consecutive daily decline.
It's worth noting that weekly momentum peaked at 60 on the April advance with RSI now poised to close back below 50. The observation suggests the broader downtrend remains intact and a pivot / break below slope support could mark trend resumption.
Initial weekly support is eyed with the February high at 6408 and is backed by the 38.2% retracement of the yearly range / February high-week close (HWC) at 6354/57. A break / daily close below this region would be required to suggest that a more significant high is in place, potentially signaling a larger reversal underway. In such a scenario, the next downside objectives would be the yearly low-week close and 2023 low-close at 6291/96, followed by the 61.8% retracement and 2022 low-close at 6186–6201. Both of these zones are key areas of interest for potential downside exhaustion / price inflection IF reached.
Look for initial resistance back at the 52-week moving average (currently ~6460) with key resistance now seen back at the 61.8% retracement / yearly high-close at 6550/77. Note that the upper parallel converges on this threshold over the next few weeks and further highlights the technical significance of this zone. Ultimately a breach / weekly close above the 2021 trendline (red) would be needed to validate a breakout of the multi-year downtrend in Aussie.
Bottom line: A reversal off downtrend resistance is now approaching initial support- risk for trend resumption heading into August. From a trading standpoint, the immediate focus is on the weekly close with respect to 6400- rallies should be limited to the 52-week moving average IF Aussie is heading lower on this stretch with a close below needed to keep the immediate short-bias viable heading into the monthly cross.
Keep in mind we get the release of key US employment data tomorrow with Non-Farm Payrolls on tap. Stay nimble into the release and watch the weekly close / August opening-range for guidance for guidance.
-MB
TCS nearing fibonachi support of 2700Historical Analysis of TCS for those who belive in fibonachi levels
Precious retracement of TCS happened exactly till golden ratio 61.8
This time it had already retraced till 50% level.
So buy now or wait till 61.8 levels।
