Dow Jones Industrial Average (DJI) – 1H Chart Analysis 1. Structure: Broad Range Consolidation
Price remains within a wide horizontal range between 45,137 resistance and 43,792 support. This shows indecision and distribution at highs.
2. Key Rejection Zone
The yellow zone around 45,001–45,137 acted as a strong supply area. Multiple rejections indicate heavy selling interest here.
3. Mid-Zone Compression
Current price is hovering just below 44,765 resistance — acting as a decision point. Break above it may retest the supply zone; rejection could send price lower.
4. Demand Holding at 44,280
The strong bounce from 44,280.25 shows buyers defending this demand zone. It's the key support to watch for bulls.
5. Next Play
Bullish: Break and hold above 44,765 targets 45,001–45,137.
Bearish: Failure leads to 44,280, then 43,973 → 43,792.
Neutral bias unless a clean breakout confirms direction.
Support and Resistance

GBPJPY: Important Demand Zone 🇬🇧🇯🇵
GBPJPY is trading within an important demand zone that
is based on a rising trend line and a horizontal support.
We see a false violation of that and a bear trap, followed
by a bullish imbalance candle.
I think that the pair may go up and reach at least 198.08 level.
❤️Please, support my work with like, thank you!❤️
I am part of Trade Nation's Influencer program and receive a monthly fee for using their TradingView charts in my analysis.

UK 100 – Moving Back Into the Spotlight It’s been a while since we covered the UK 100, but it feels like recent moves and the fact there is a Bank of England (BoE) rate decision next Thursday (August 7th) means it warrants some extra attention.
For much of 2025 the UK 100 has been the under achiever when compared to other European indices, but things have changed slightly in July as a result of the breakout above the previous all-time high at 8909 (more on this below in technical update) which has led to multiple record peaks all the way up to the most recent one registered on July 28th at 9177.
This up move has been aided by bullish technical momentum, a weaker GBPUSD exchange rate, which can add support to the index given that UK 100 companies are multi-national, earning over 60% of their revenue outside of the UK, and increased expectations for a BoE rate cut of 25bps (0.25%) at their next rate meeting on Thursday August 7th.
Now, looking forward, before traders get ready for that BoE meeting, they must contend with the challenges presented by President Trump’s trade policy and two key US economic data releases that could impact sentiment towards the UK 100 into the weekend. The first piece of data is the US PCE Index inflation print, released later today at 1330 BST and the second is tomorrow’s Non-farm Payrolls update at 1330 BST.
Once traders have more clarity on the outlook for global trade after President Trump’s August 1st tariff deadline has passed, alongside the fresh insight into the current path of US inflation and the health of the labour market provided by these two pivotal pieces of economic data, their preparation can begin for a potential 25bps (0.25%) rate cut in the UK, as the market expects and the accompanying commentary from BoE Governor Bailey in the press conference on whether more cuts could be in the pipeline across the remaining months of 2025.
Technical Update: Assessing the Current Uptrend
Since posting a low of 7525 on April 7th it has been a positive period of trading for the UK 100 index, a move that has seen a near 22% advance. As the chart below shows, except for the decline down to 8692 on June 26th, this has been an almost uninterrupted phase of price strength, as a positive pattern of higher price highs and higher price lows has materialised.
Of course, there is no guarantee that this type of positive pattern will extend and continue to see new all-time highs posted, but traders may be anticipating further attempts at upside price extension, especially while support below current price levels remains intact.
So, with this in mind, let’s look at what could be the relevant support and resistance levels that might influence trader sentiment over upcoming sessions.
Potential Support Levels:
While Monday did see a new all-time high posted at 9177, a price sell-off then materialised to register a low for the day at 9060, but with support being found at this level, it might be suggested this now represents a higher low within the positive trend and as such, is potentially now the first support focus, as the chart below shows.
Traders may find it useful to monitor how 9060 performs as a support on a closing basis, as if it were to give way over coming sessions, a more extended phase of price weakness may result. Such downside support breaks could then see the focus shift to the 38.2% Fibonacci retracement of June 26th to July 28th strength which stands at 8990, possibly even the 50% level at 8933.
Potential Resistance Levels:
Having been capped by the July 28th high at 9177, the UK 100 index may now need to see successful closing breaks above this level to suggest a continuation of the recent positive price trend.
Successful closing breaks above the 9177 high, may be an indication of continued price strength, opening potential for moves to the next possible resistance at 9253, which is the 161.8% Fibonacci extension, even 9335, the higher 200% extension level.
The material provided here has not been prepared accordance with legal requirements designed to promote the independence of investment research and as such is considered to be a marketing communication. Whilst it is not subject to any prohibition on dealing ahead of the dissemination of investment research, we will not seek to take any advantage before providing it to our clients.
Pepperstone doesn’t represent that the material provided here is accurate, current or complete, and therefore shouldn’t be relied upon as such. The information, whether from a third party or not, isn’t to be considered as a recommendation; or an offer to buy or sell; or the solicitation of an offer to buy or sell any security, financial product or instrument; or to participate in any particular trading strategy. It does not take into account readers’ financial situation or investment objectives. We advise any readers of this content to seek their own advice. Without the approval of Pepperstone, reproduction or redistribution of this information isn’t permitted.

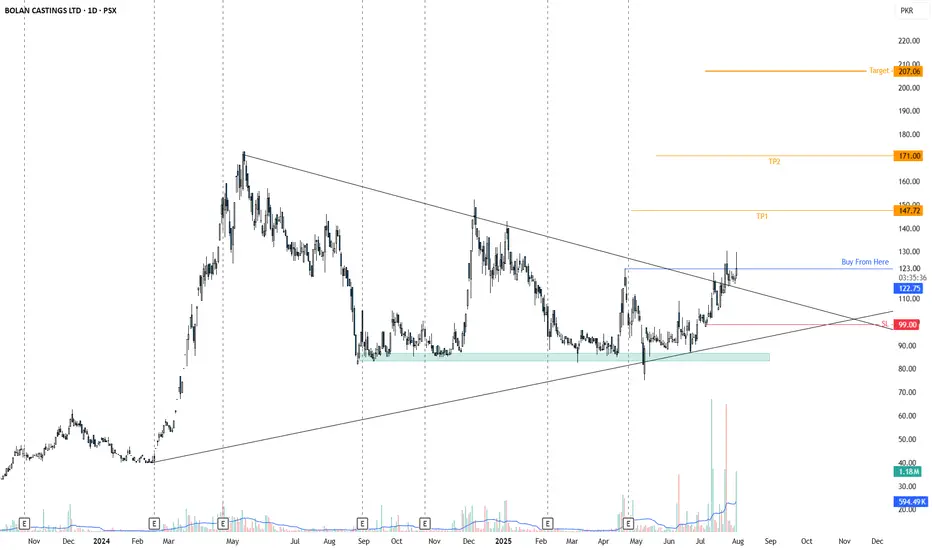
BCL is at exactly buying priceBCL is at exactly the buying price; it has just broken its long-term Trendline resistance.
A sharp move may be expected.
Gold Market Update: Major Support at and Supply atGold is recovering after a strong drop from the previous range high. Price is approaching a 4H Order Block near the 3300–3310 zone, which may act as a supply area. A minor liquidity zone has just been tapped, suggesting a potential short-term rejection.
The major support lies at 3269, which sparked the recent bullish move. If price rejects from the OB zone, a pullback toward this support is likely. However, a clean break and hold above the OB may signal further upside.
📌 Key Levels:
Supply Zone: 3300–3310
Support: 3269
🧠 Wait for clear confirmation before executing trades.

GBPUSD FORMS HEAD & SHOULDER PATTERN IN 1D TIME FRAME CHARTGBP/USD Forms Head and Shoulders Pattern - Bearish Breakdown Expected
The GBP/USD currency pair has developed a clear Head and Shoulders (H&S) reversal pattern on the 1-DAY chart, signaling potential weakness ahead. This technical formation - characterized by a central peak (head) flanked by two lower highs (shoulders) - suggests the recent uptrend may be exhausting as sellers gain control.
Current Market Structure
Price action remains confined within a bearish framework, making consistent lower highs and lower lows since failing at the pattern's right shoulder. The pair now tests critical support near the neckline of the H&S formation. A confirmed break below this level would validate the pattern and likely accelerate downward momentum.
Key Levels to Watch
- *Downside Target*: 1.27300 emerges as the next major support if bearish momentum sustains
- Resistance Zone: The 1.37900 level now acts as formidable overhead resistance
- Neckline Break: A daily close below current support would confirm the H&S pattern
Trading Implications
The technical setup favors:
1) Maintaining short positions while price holds below the right shoulder high
2) Watching for increased volume on breakdown moves to confirm bearish conviction
3) Considering long positions only if buyers reclaim 1.37900 resistance
Risk Factors
Traders should monitor:
- UK inflation data and BoE policy signals
- Fed interest rate expectations
- General USD strength across currency markets
This pattern projects approximately 900 pips of potential downside if fully realized. However, traders should wait for confirmed breakout momentum rather than anticipating the move, as false breakdowns remain possible in current market conditions. Proper position sizing and stop-loss placement above recent swing highs remains essential for risk management.
Note: Forex trading involves substantial risk. Always conduct your own analysis before entering positions.

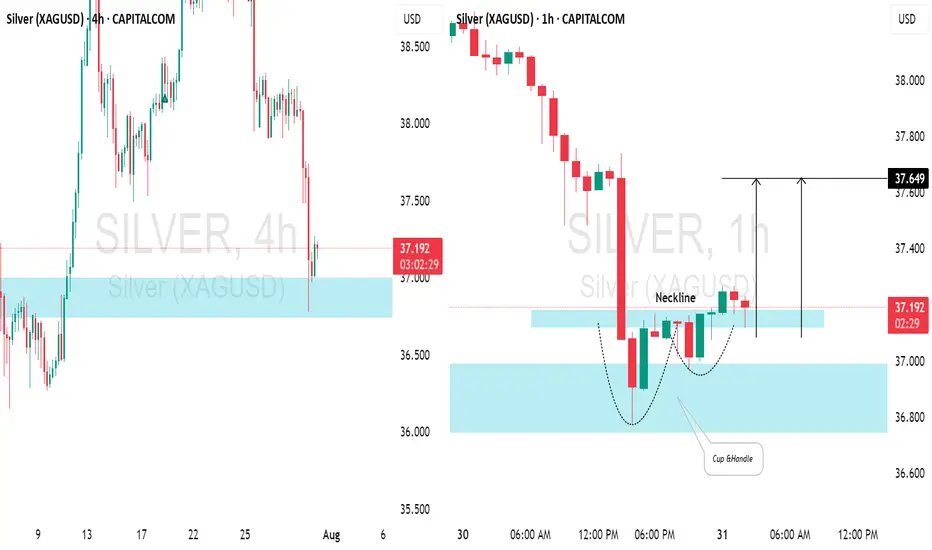
SILVER (XAGUSD): Time for Pullback📈SILVER appears to be oversold following yesterday's decline.
After testing a significant daily / intraday support level, there's a noticeable bullish reversal.
The price formed a cup & handle pattern on the hourly chart and has broken above its neckline. We can expect a pullback to at least 37.64.
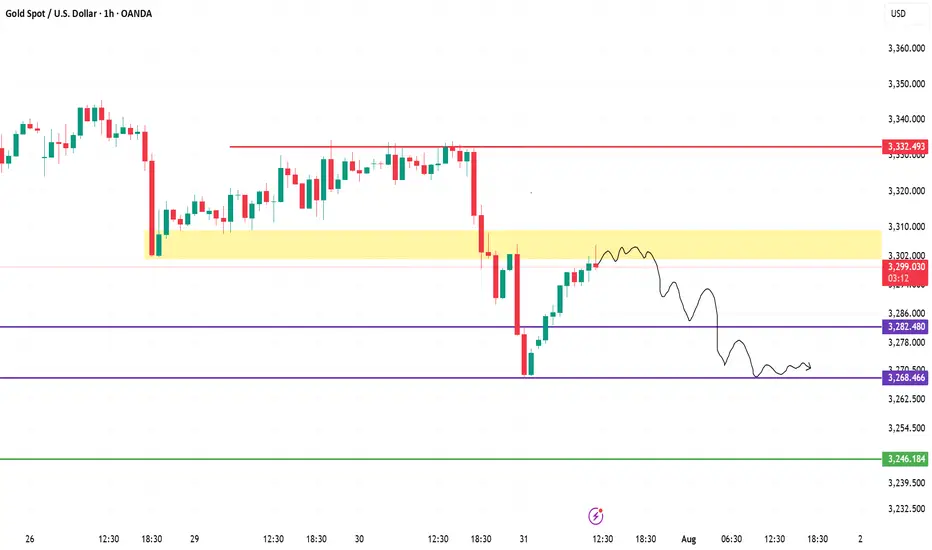
XAUUSD (Gold) Analysis – 1H Chart | July 31, 20251. Fakeout & Rejection from Supply
Price faced sharp rejection near the 3,332 resistance. The strong red candle indicates aggressive selling and liquidity grab.
2. Retest of Broken Demand Zone
Gold is now retesting the **3,298–3,305** yellow zone, which previously acted as demand but may now flip to resistance (supply).
3. Bearish Market Structure
The price formed a **lower high and lower low** pattern — a clear sign of downtrend resumption. Current bounce looks corrective.
4. Projection: Potential Drop Ahead
As per the drawn path, if price fails to reclaim above 3,305, a likely drop toward 3,282, then 3,268 is expected.
5. Key Levels to Watch
Resistance: 3,305 → 3,332
Support: 3,282 → 3,268 → 3,246
Bearish bias remains valid below 3,305.
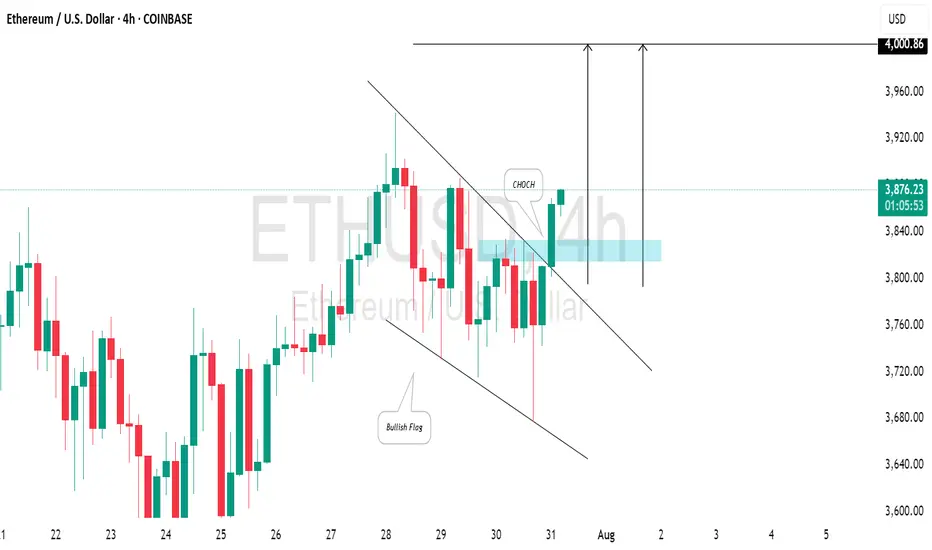
ETHEREUM (ETHUSD): Strong Bullish SignalsI spotted 2 important price action confirmations on 📈ETHEREUM:
The price has surpassed a resistance line of a bullish flag and established a confirmed change of character (CHoCH) on the 4-hour chart.
I believe the market will maintain a bullish trend, with the next resistance at the 4000 level.
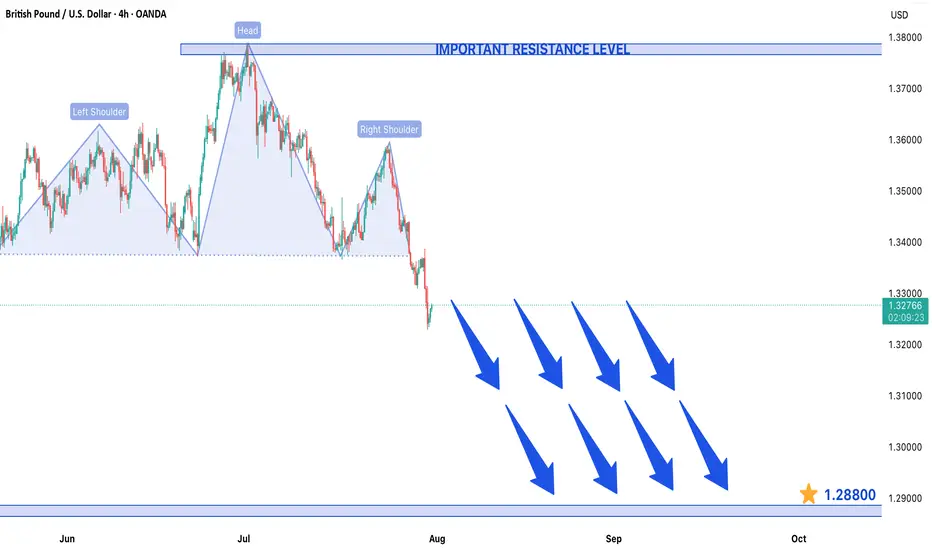
GBP/USD Forms Head and Shoulders Pattern in 4H Timeframe ChartGBP/USD Forms Head and Shoulders Pattern - Bearish Breakdown Expected
The GBP/USD currency pair has developed a clear Head and Shoulders (H&S) reversal pattern on the 4-hour chart, signaling potential weakness ahead. This technical formation - characterized by a central peak (head) flanked by two lower highs (shoulders) - suggests the recent uptrend may be exhausting as sellers gain control.
Current Market Structure
Price action remains confined within a bearish framework, making consistent lower highs and lower lows since failing at the pattern's right shoulder. The pair now tests critical support near the neckline of the H&S formation. A confirmed break below this level would validate the pattern and likely accelerate downward momentum.
Key Levels to Watch
- Downside Target: 1.28800 emerges as the next major support if bearish momentum sustains
- Resistance Zone: The 1.37900 level now acts as formidable overhead resistance
- Neckline Break: A daily close below current support would confirm the H&S pattern
Trading Implications
The technical setup favors:
1) Maintaining short positions while price holds below the right shoulder high
2) Watching for increased volume on breakdown moves to confirm bearish conviction
3) Considering long positions only if buyers reclaim 1.37900 resistance
Risk Factors
Traders should monitor:
- UK inflation data and BoE policy signals
- Fed interest rate expectations
- General USD strength across currency markets
This pattern projects approximately 900 pips of potential downside if fully realized. However, traders should wait for confirmed breakout momentum rather than anticipating the move, as false breakdowns remain possible in current market conditions. Proper position sizing and stop-loss placement above recent swing highs remains essential for risk management.
GOLD (XAUUSD): Massive BreakoutGOLD has fallen significantly and closed below an important support level.
The broken structure has now become a strong resistance.
I anticipate further downward movement, with the next support level at 3262.

XAUUSD - 29/7/25 - continued bearish There was quite strong bearish momentum yesterday during the US session. Going into Asian session and London session today there is a consolidation bullish. There is a 4 hour zone marked out where i am looking for a retest and continuation bearish to a key zone below where a reversal pivot is expected and then continuing bullish with the larger trend.

Gold (XAUUSD) – H1 Wave 5 in Progress | Bearish Setup Building📉 Gold (XAUUSD) – H1 Wave 5 in Progress | Bearish Setup Building
🕐 Timeframe: H1
🔍 Strategy: Elliott Wave + Support/Resistance + AO Divergence
The market has likely initiated Wave 5 on the H1 timeframe following a clean 5-wave structure. We’re now watching for the internal corrective Wave 4 of Wave 5 to complete.
📌 Key Zone to Watch:
Fibonacci Level 2.618 lines up with a previous support-turned-resistance zone — a high-probability reversal area.
Awesome Oscillator (AO) shows convergence, signaling weakening bullish momentum.
🔧 Execution Plan:
Waiting for M15 break of structure to confirm the end of the corrective sub-wave.
Will look to enter sell on confirmation of bearish continuation.
🎯 Target Zone:
The shaded green area below marks a strong support zone — potential TP area for Wave 5 completion.

TLT LongThe broader market structure on the TLT 1D chart shows a clear downtrend, followed by a Change of Character (CHoCH) when price broke above the lower high near $86.50, signaling a potential trend reversal. This CHoCH is further validated by a strong push off the demand zone around $83–$84, where buyers stepped in with conviction, leading to a series of higher lows and an emerging bullish structure.
The demand zones below, especially the wide green area near $82.68–$84, are strong; price previously reversed sharply from this level, indicating institutional interest. In contrast, the supply zones between $88–$93 appear layered and moderately strong, especially around $88.20 and $92.70, where price previously sold off. However, the lack of deep wicks and clean rejections in the lower supply zones suggests that sellers may be weakening.
Currently, price is pushing upward toward the $88–$89 zone with bullish momentum. Within the marked region, price is climbing steadily after forming a minor higher low. If it can break above $88.20 convincingly, the next logical target would be the supply near $92.70–$93. A minor pullback to the $85.50–$86 zone could offer a buying opportunity if demand holds.
The trade bias is bullish with an expected continuation toward $92.70, assuming momentum holds. Invalidation of this outlook would occur if price breaks back below $84.00, which would indicate a failed breakout and potential return to the broader bearish trend. Momentum currently favors buyers, with higher closes and strong-bodied candles confirming upward intent.

EURJPY 300+ PIP DROPFrom the beginning of the week i have called out shorts on EJ into 170.000 in the video we can see price hit that support and hitting target for a few positions and entry i called out during the week and also some key points for your personal trading

Closed Longs, Now Selling Rallies on EURUSD ReversalAs mentioned in my previous posts, I’m been bullish on EURUSD in the medium term, targeting 1.20 and even beyond.
But no pair—especially not EURUSD, which tends to move more steadily and rationally—goes up in a straight line.
________________________________________
🔹 Last week, the pair stalled just below 1.18, and I decided to close my long trade with a +150 pip gain. That proved to be a wise call, as price dropped hard shortly after.
________________________________________
📉 What’s happening now?
• EURUSD has broken below the rising trendline
• More importantly, it’s broken below the neckline of a double top pattern
• Now trading around 1.1535
This opens the door for a deeper correction, and I expect we could see a test of the 1.1150–1.1100 zone by the end of summer.
________________________________________
📌 Trading Plan:
• I’m now in sell-the-rally mode
• Ideal short entry: around 1.1650, where we also get a favorable 1:3+ risk-reward
• Watch also for interim support around 1.1400
________________________________________
Conclusion:
The bigger picture remains bullish— but this correction looks healthy and isn’t done yet.
Selling rallies makes more sense now, until the structure tells us otherwise.
Disclosure: I am part of TradeNation's Influencer program and receive a monthly fee for using their TradingView charts in my analyses and educational articles.

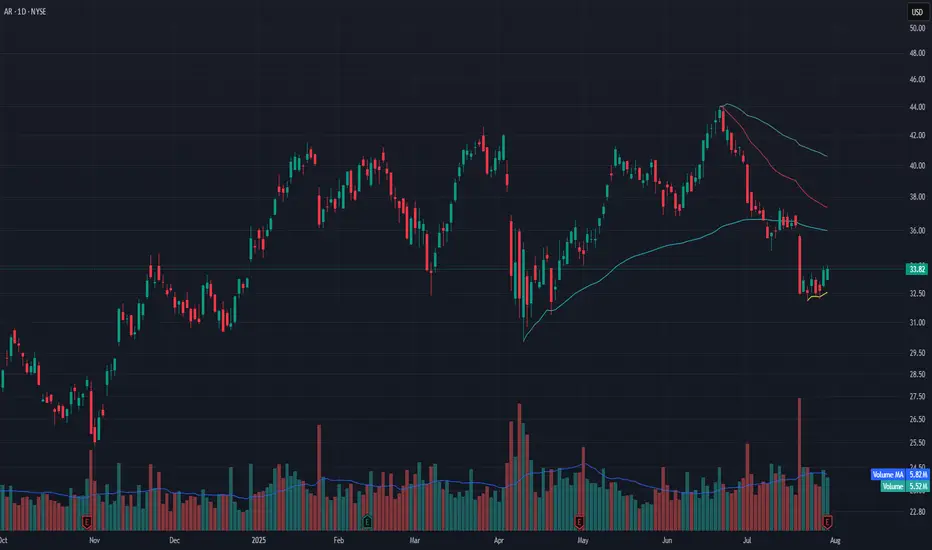
AR Rebounding from VWAP Zone – Watch for Break Above $34AR is attempting to base after a steep selloff from the $44 level. Over the past few sessions, price has found stability above the anchored VWAP (yellow line) and printed multiple higher lows. Today’s close at $33.82 brings it right up against the recent short-term resistance near $34.
Volume is steady (5.52M vs. 5.82M average), suggesting balance between buyers and sellers. A confirmed breakout above $34 with volume could trigger a move toward the $36.50–37 range, where the next anchored VWAP (red) and declining 20 EMA reside.
This setup favors early reversal traders with tight risk below VWAP and confirmation needed through $34.25.
Indicators used:
Anchored VWAP (short-term support reclaim)
Volume trend (flat but no selling surge)
Price structure (potential bottom formation with higher lows)
Entry idea: Long above $34
Target: $36.50–37
Stop: Below $32.75 or VWAP zone
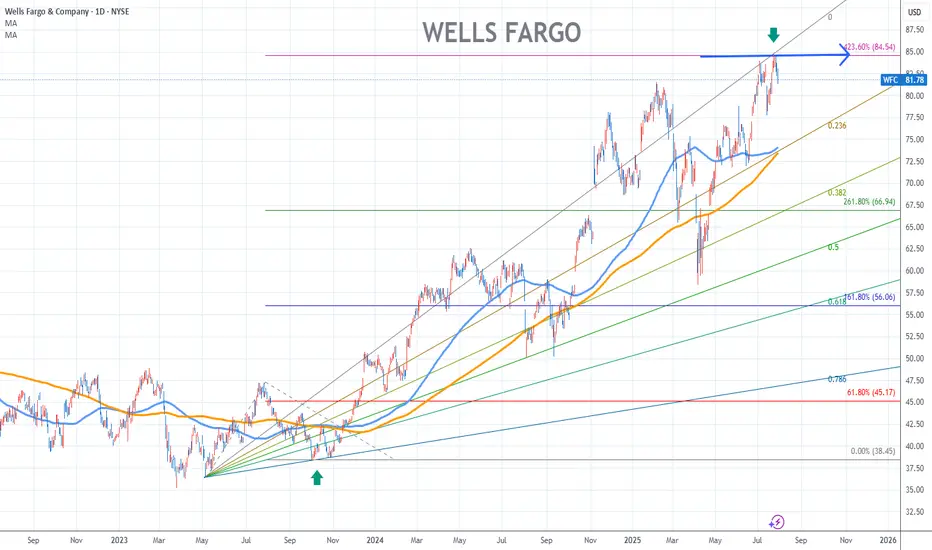
Wells Fargo Stock Chart Fibonacci Analysis 073025Hit the 84.5/423.60% resistance level.
Trading Idea
Chart time frame:D
A) 15 min(1W-3M)
B) 1 hr(3M-6M)
C) 4 hr(6M-1year)
D) 1 day(1-3years)
Stock progress:E
A) Keep rising over 61.80% resistance
B) 61.80% resistance
C) 61.80% support
D) Hit the bottom
E) Hit the top
Stocks rise as they rise from support and fall from resistance. Our goal is to find a low support point and enter. It can be referred to as buying at the pullback point. The pullback point can be found with a Fibonacci extension of 61.80%. This is a step to find entry level. 1) Find a triangle (Fibonacci Speed Fan Line) that connects the high (resistance) and low (support) points of the stock in progress, where it is continuously expressed as a Slingshot, 2) and create a Fibonacci extension level for the first rising wave from the start point of slingshot pattern.
When the current price goes over 61.80% level , that can be a good entry point, especially if the SMA 100 and 200 curves are gathered together at 61.80%, it is a very good entry point.
As a great help, tradingview provides these Fibonacci speed fan lines and extension levels with ease. So if you use the Fibonacci fan line, the extension level, and the SMA 100/200 curve well, you can find an entry point for the stock market. At least you have to enter at this low point to avoid trading failure, and if you are skilled at entering this low point, with fibonacci6180 technique, your reading skill to chart will be greatly improved.
If you want to do day trading, please set the time frame to 5 minutes or 15 minutes, and you will see many of the low point of rising stocks.
If want to prefer long term range trading, you can set the time frame to 1 hr or 1 day.
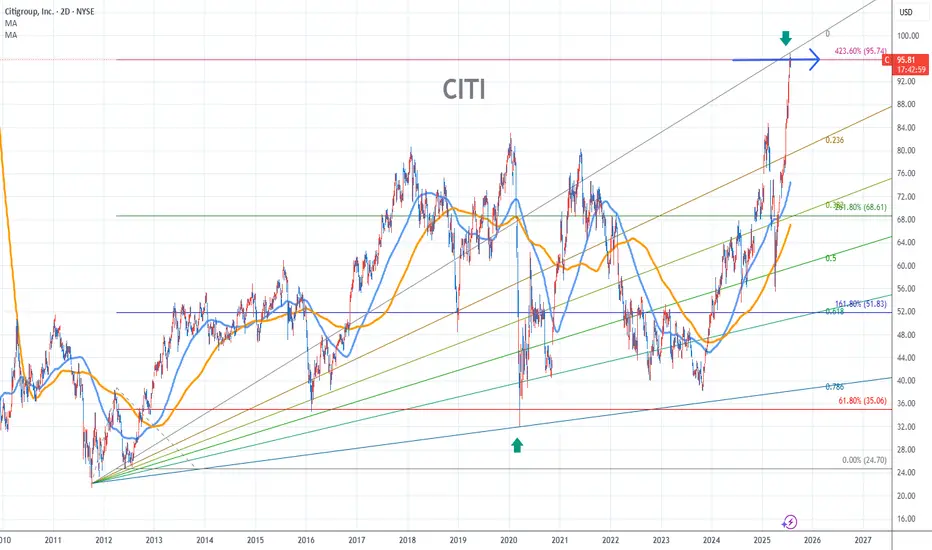
Citigroup Stock Chart Fibonacci Analysis 073025Hit the 96/423.60% resistance level.
Chart time frame:D
A) 15 min(1W-3M)
B) 1 hr(3M-6M)
C) 4 hr(6M-1year)
D) 1 day(1-3years)
Stock progress:E
A) Keep rising over 61.80% resistance
B) 61.80% resistance
C) 61.80% support
D) Hit the bottom
E) Hit the top
Stocks rise as they rise from support and fall from resistance. Our goal is to find a low support point and enter. It can be referred to as buying at the pullback point. The pullback point can be found with a Fibonacci extension of 61.80%. This is a step to find entry level. 1) Find a triangle (Fibonacci Speed Fan Line) that connects the high (resistance) and low (support) points of the stock in progress, where it is continuously expressed as a Slingshot, 2) and create a Fibonacci extension level for the first rising wave from the start point of slingshot pattern.
When the current price goes over 61.80% level , that can be a good entry point, especially if the SMA 100 and 200 curves are gathered together at 61.80%, it is a very good entry point.
As a great help, tradingview provides these Fibonacci speed fan lines and extension levels with ease. So if you use the Fibonacci fan line, the extension level, and the SMA 100/200 curve well, you can find an entry point for the stock market. At least you have to enter at this low point to avoid trading failure, and if you are skilled at entering this low point, with fibonacci6180 technique, your reading skill to chart will be greatly improved.
If you want to do day trading, please set the time frame to 5 minutes or 15 minutes, and you will see many of the low point of rising stocks.
If want to prefer long term range trading, you can set the time frame to 1 hr or 1 day.
ETHUSD Key Zone Retest – Bullish Momentum Above 3,760?Price surged past the 3,537.93 and 3,762.20 zones, holding gains above both. The current daily candle shows consolidation just above the 3,760 zone after a strong impulsive move.
Support at: 3,762.20 🔽 & 3,537.93
Resistance at: 4,056.40 🔼
🔎 Bias:
🔼 Bullish: If price continues to hold above 3,762.20 and closes strongly above this zone, we may see continuation toward 4,056.40.
🔽 Bearish: A daily close back below 3,760 could open room for a deeper correction toward 3,537.93 or even 3,040.00.
📛 Disclaimer: This is not financial advice. Trade at your own risk.

SPX500USD | Retesting All-Time HighsThe index has extended its bullish rally, printing a new local high at 6,286.5 before showing signs of slight hesitation with consecutive small-bodied candles.
Support at: 6,134.5 / 6,026.0 / 5,926.2 🔽
Resistance at: 6,286.5 🔼
🔎 Bias:
🔼 Bullish: Sustains above 6,134.5 and breaks 6,286.5 for new highs.
🔽 Bearish: Break below 6,134.5 could trigger a retracement toward 6,026.0.
📛 Disclaimer: This is not financial advice. Trade at your own risk.

MS eyes on $119: Major Resistance may End Bounce or Strong BullMS recovering well from the tariff tantrum.
About to test a major resistance $119.08-119.20
Break would show strong bull, but dip more likely.
===========================================
.

ETHUSD | Breakout Watch Above $3,040Ethereum has surged above the critical $2,530 resistance zone and is now challenging $3,040, a key structure level. A daily close above this could open the path toward $3,537 and even $4,056 in the mid-term.
Support at: 2,530 / 2,100 / 1,830 🔽
Resistance at: 3,537.93 / 4,056.40 🔼
🔎 Bias:
🔼 Bullish: Holding above 2,530 confirms breakout structure; a clean break above 3,040 targets higher zones.
🔽 Bearish: Failure to stay above 3,040 may invite a retest of 2,530.
📛 Disclaimer: This is not financial advice. Trade at your own risk.
