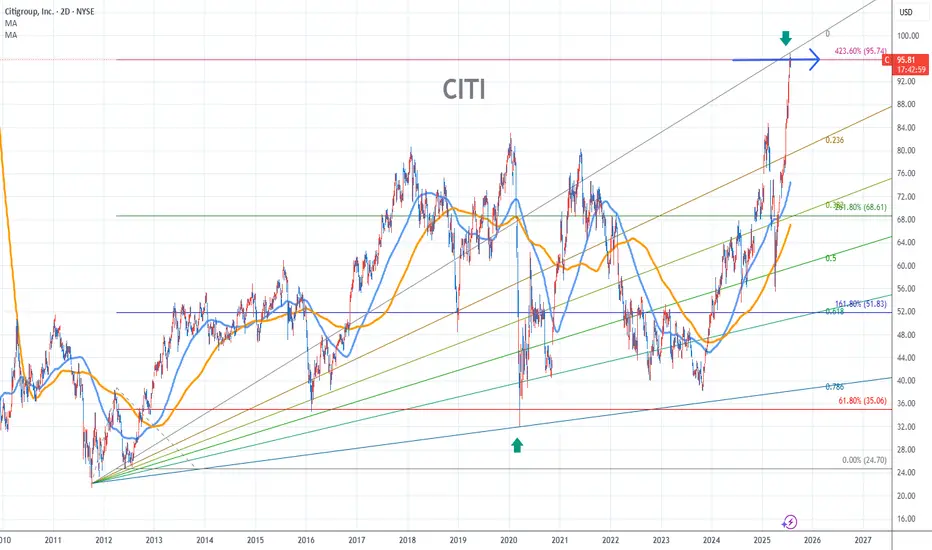
Citigroup Stock Chart Fibonacci Analysis 073025Hit the 96/423.60% resistance level.
Chart time frame:D
A) 15 min(1W-3M)
B) 1 hr(3M-6M)
C) 4 hr(6M-1year)
D) 1 day(1-3years)
Stock progress:E
A) Keep rising over 61.80% resistance
B) 61.80% resistance
C) 61.80% support
D) Hit the bottom
E) Hit the top
Stocks rise as they rise from support and fall from resistance. Our goal is to find a low support point and enter. It can be referred to as buying at the pullback point. The pullback point can be found with a Fibonacci extension of 61.80%. This is a step to find entry level. 1) Find a triangle (Fibonacci Speed Fan Line) that connects the high (resistance) and low (support) points of the stock in progress, where it is continuously expressed as a Slingshot, 2) and create a Fibonacci extension level for the first rising wave from the start point of slingshot pattern.
When the current price goes over 61.80% level , that can be a good entry point, especially if the SMA 100 and 200 curves are gathered together at 61.80%, it is a very good entry point.
As a great help, tradingview provides these Fibonacci speed fan lines and extension levels with ease. So if you use the Fibonacci fan line, the extension level, and the SMA 100/200 curve well, you can find an entry point for the stock market. At least you have to enter at this low point to avoid trading failure, and if you are skilled at entering this low point, with fibonacci6180 technique, your reading skill to chart will be greatly improved.
If you want to do day trading, please set the time frame to 5 minutes or 15 minutes, and you will see many of the low point of rising stocks.
If want to prefer long term range trading, you can set the time frame to 1 hr or 1 day.
Support and Resistance
ETHUSD Key Zone Retest – Bullish Momentum Above 3,760?Price surged past the 3,537.93 and 3,762.20 zones, holding gains above both. The current daily candle shows consolidation just above the 3,760 zone after a strong impulsive move.
Support at: 3,762.20 🔽 & 3,537.93
Resistance at: 4,056.40 🔼
🔎 Bias:
🔼 Bullish: If price continues to hold above 3,762.20 and closes strongly above this zone, we may see continuation toward 4,056.40.
🔽 Bearish: A daily close back below 3,760 could open room for a deeper correction toward 3,537.93 or even 3,040.00.
📛 Disclaimer: This is not financial advice. Trade at your own risk.

SPX500USD | Retesting All-Time HighsThe index has extended its bullish rally, printing a new local high at 6,286.5 before showing signs of slight hesitation with consecutive small-bodied candles.
Support at: 6,134.5 / 6,026.0 / 5,926.2 🔽
Resistance at: 6,286.5 🔼
🔎 Bias:
🔼 Bullish: Sustains above 6,134.5 and breaks 6,286.5 for new highs.
🔽 Bearish: Break below 6,134.5 could trigger a retracement toward 6,026.0.
📛 Disclaimer: This is not financial advice. Trade at your own risk.

MS eyes on $119: Major Resistance may End Bounce or Strong BullMS recovering well from the tariff tantrum.
About to test a major resistance $119.08-119.20
Break would show strong bull, but dip more likely.
===========================================
.

ETHUSD | Breakout Watch Above $3,040Ethereum has surged above the critical $2,530 resistance zone and is now challenging $3,040, a key structure level. A daily close above this could open the path toward $3,537 and even $4,056 in the mid-term.
Support at: 2,530 / 2,100 / 1,830 🔽
Resistance at: 3,537.93 / 4,056.40 🔼
🔎 Bias:
🔼 Bullish: Holding above 2,530 confirms breakout structure; a clean break above 3,040 targets higher zones.
🔽 Bearish: Failure to stay above 3,040 may invite a retest of 2,530.
📛 Disclaimer: This is not financial advice. Trade at your own risk.

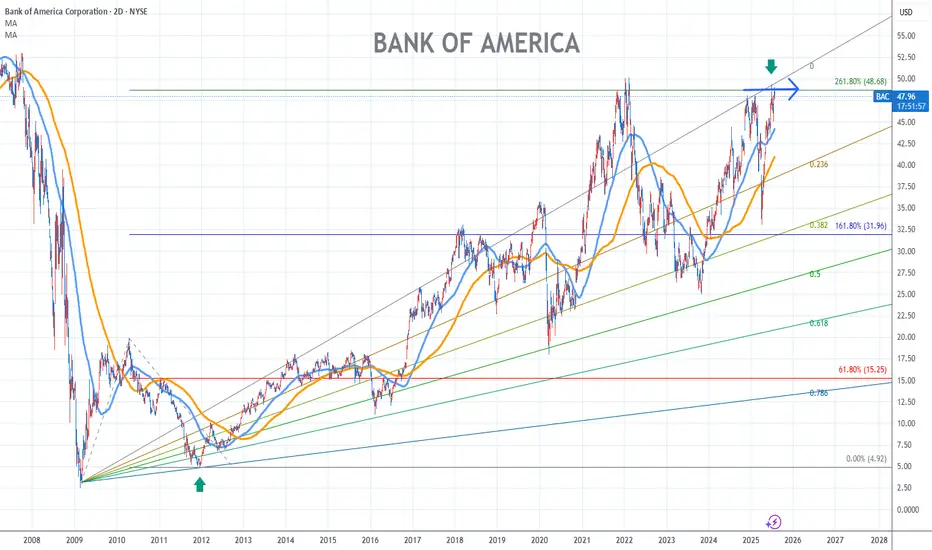
Bank of America Stock Chart Fibonacci Analysis 073025
Hit the 48.7/261.80% resistance level.
Trading Idea
Chart time frame:D
A) 15 min(1W-3M)
B) 1 hr(3M-6M)
C) 4 hr(6M-1year)
D) 1 day(1-3years)
Stock progress:E
A) Keep rising over 61.80% resistance
B) 61.80% resistance
C) 61.80% support
D) Hit the bottom
E) Hit the top
Stocks rise as they rise from support and fall from resistance. Our goal is to find a low support point and enter. It can be referred to as buying at the pullback point. The pullback point can be found with a Fibonacci extension of 61.80%. This is a step to find entry level. 1) Find a triangle (Fibonacci Speed Fan Line) that connects the high (resistance) and low (support) points of the stock in progress, where it is continuously expressed as a Slingshot, 2) and create a Fibonacci extension level for the first rising wave from the start point of slingshot pattern.
When the current price goes over 61.80% level , that can be a good entry point, especially if the SMA 100 and 200 curves are gathered together at 61.80%, it is a very good entry point.
As a great help, tradingview provides these Fibonacci speed fan lines and extension levels with ease. So if you use the Fibonacci fan line, the extension level, and the SMA 100/200 curve well, you can find an entry point for the stock market. At least you have to enter at this low point to avoid trading failure, and if you are skilled at entering this low point, with fibonacci6180 technique, your reading skill to chart will be greatly improved.
If you want to do day trading, please set the time frame to 5 minutes or 15 minutes, and you will see many of the low point of rising stocks.
If want to prefer long term range trading, you can set the time frame to 1 hr or 1 day.
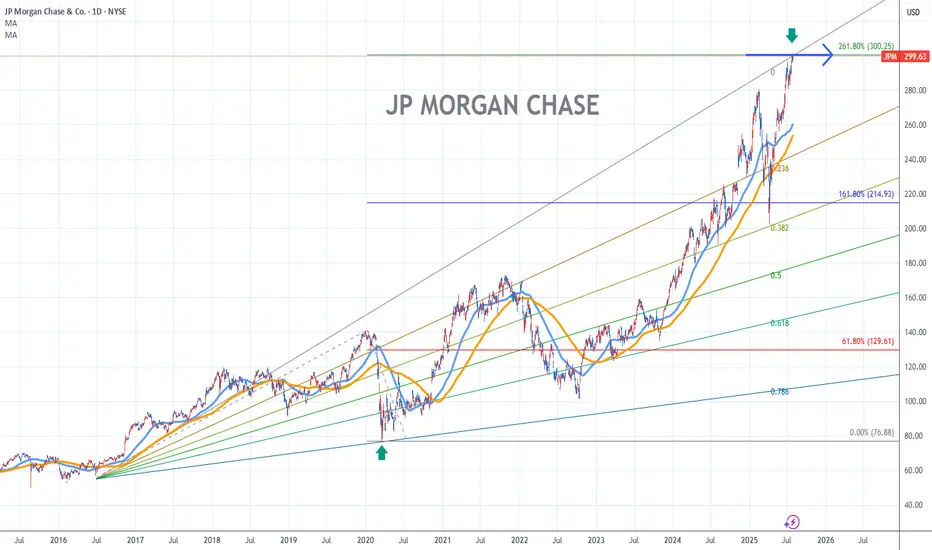
JP Morgan Chase Stock Chart Fibonacci Analysis 073025Trading Idea
Hit the 300/261.80% resistance level.
Chart time frame:D
A) 15 min(1W-3M)
B) 1 hr(3M-6M)
C) 4 hr(6M-1year)
D) 1 day(1-3years)
Stock progress:E
A) Keep rising over 61.80% resistance
B) 61.80% resistance
C) 61.80% support
D) Hit the bottom
E) Hit the top
Stocks rise as they rise from support and fall from resistance. Our goal is to find a low support point and enter. It can be referred to as buying at the pullback point. The pullback point can be found with a Fibonacci extension of 61.80%. This is a step to find entry level. 1) Find a triangle (Fibonacci Speed Fan Line) that connects the high (resistance) and low (support) points of the stock in progress, where it is continuously expressed as a Slingshot, 2) and create a Fibonacci extension level for the first rising wave from the start point of slingshot pattern.
When the current price goes over 61.80% level , that can be a good entry point, especially if the SMA 100 and 200 curves are gathered together at 61.80%, it is a very good entry point.
As a great help, tradingview provides these Fibonacci speed fan lines and extension levels with ease. So if you use the Fibonacci fan line, the extension level, and the SMA 100/200 curve well, you can find an entry point for the stock market. At least you have to enter at this low point to avoid trading failure, and if you are skilled at entering this low point, with fibonacci6180 technique, your reading skill to chart will be greatly improved.
If you want to do day trading, please set the time frame to 5 minutes or 15 minutes, and you will see many of the low point of rising stocks.
If want to prefer long term range trading, you can set the time frame to 1 hr or 1 day.
#PENGUUSDT confirms a bearish impulse📉 SHORT BYBIT:PENGUUSDT.P from $0.034625
⚡ Stop loss $0.035646
🕒 Timeframe: 4H
⚡ Overview:
➡️ A Double Top pattern BYBIT:PENGUUSDT.P has formed, signaling a bearish reversal.
➡️ The price broke the $0.0355 support and is consolidating below, confirming seller strength.
➡️ Increasing sell volume confirms bearish control.
➡️ Main focus on targets in the $0.034–0.033 zone.
➡️ The POC at $0.03113 remains the ultimate bearish objective.
🎯 TP Targets:
💎 TP 1: $0.033947
💎 TP 2: $0.033369
💎 TP 3: $0.032948
BYBIT:PENGUUSDT.P Trade Recommendations:
📢 Hold short towards the TP zones.
📢 Watch for reaction around $0.0339 — partial profit-taking possible.
📢 Invalidation if price reclaims above $0.0356.
⚠️ As long as bearish pressure holds, the price is likely to continue towards TP2–TP3.
⚠️ A recovery above $0.0356 would invalidate this setup.
🚀 The signal confirms a bearish impulse — expecting further downside!

SHORT-TERM TECHNICAL ANALYSIS FOR GOLDXAUUSD broke down sharply from the 3,330 🔽 resistance zone, violating trendline support and slicing through 3,300 🔽. Price has now found temporary support at 3,270 🔽 and is attempting a retracement.
Support Levels: 3,270 🔽
Resistance Levels: 3,300 🔼, 3,315 🔼, 3,330 🔼
Bias:
🔼 Bullish: If price breaks and retests above 3,300, a push toward 3,315 or even 3,330 is possible.
🔽 Bearish: Failure to reclaim 3,300 could lead to continued downside toward 3,270 or even lower.
📛 Disclaimer: This is not financial advice. Trade at your own risk.

$ETH to $6.45k USD - 2024's Crescendo CRYPTOCAP:ETH is showing strong signs of an impending breakout to the $6.4k–$8k range, backed by two key technical indicators:
Cup & Handle Formation: ETH has recently broken out of a textbook cup and handle pattern, confirming the breakout with a solid retest over this past week of VOL. This is a classic bullish signal pointing to higher targets.
Bull Pennant: Since the 2021 rally, ETH has been consolidating within a massive bull pennant. This long-term structure suggests Ethereum is coiled and ready for a significant move upward.
1.618 Fib: Also layering in a Fibonacci retrace, if ETH is indeed heading for ATHs and price discovery, the 1.618 FIB is a common level that traders are very familiar with. It just so happens to be right in the middle of our target box at ~$7k!
Momentum is building— we will need to keep an eye on volume and follow-through for confirmation.
To boot, bearish sentiment for ETH is near all time highs. I think it might be time for a most-hated rally. I have a short term allocation in AMEX:ETHT to ride this momentum, NFA DYOR

USD_CHF LOCAL SHORT|
✅USD_CHF price went up sharply
But a strong resistance level was hit at 0.8152
Thus, as a pullback is already happening
And a move down towards the
Target of 0.8113 shall follow
SHORT🔥
✅Like and subscribe to never miss a new idea!✅
Disclosure: I am part of Trade Nation's Influencer program and receive a monthly fee for using their TradingView charts in my analysis.

Juicy 12hr Setup on $XLMUSDT
Decided to take this as a short-term play, level by level.
Already holding an initial position (see my previous CRYPTOCAP:XLM post), but this current setup was too clean to pass up.
Still believe CRYPTOCAP:XLM is one of those coins primed to finally break out of its multiyear consolidation—and I’m expecting that breakout to happen this year.
First TP at 62c, and letting the rest ride if momentum kicks in. BINANCE:XLMUSDT

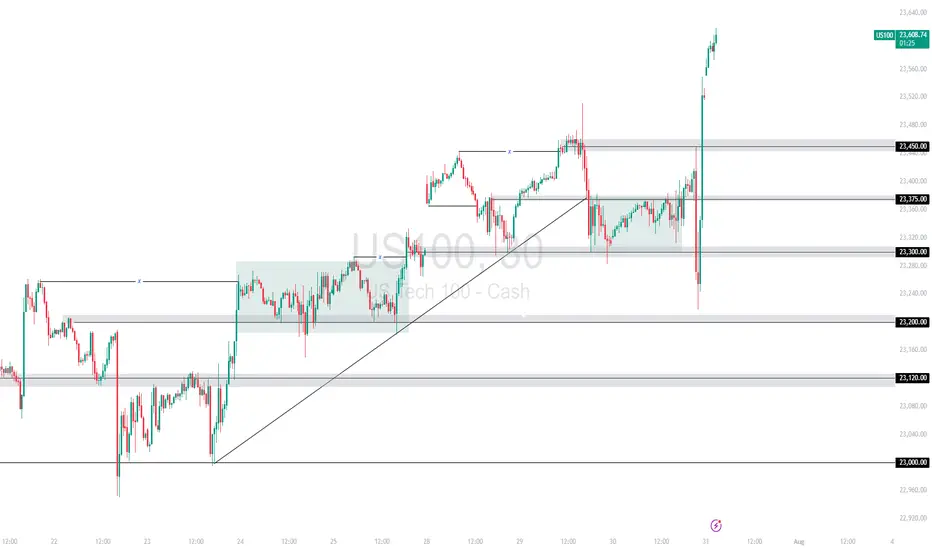
US100 Surges on Strong Fed Data and Trump Trade Deals A combination of upbeat economic data from the Fed and renewed optimism from Trump’s trade announcements fueled a powerful bullish rally on the US100. Price broke above the 23,450 🔼 resistance after reclaiming the 23,300 🔽 zone, leaving behind a strong V-shaped recovery from 23,200 🔽.
Support Levels: 23,450 🔽, 23,375 🔽, 23,300 🔽
Resistance Levels: None locally – price is printing new highs
Bias:
🔼 Bullish: Holding above 23,450 could support further upside. A clean retest may offer continuation entries.
🔽 Bearish: A drop back below 23,450 would weaken the rally and may open the path to 23,375 or 23,300.
📛 Disclaimer: This is not financial advice. Trade at your own risk.
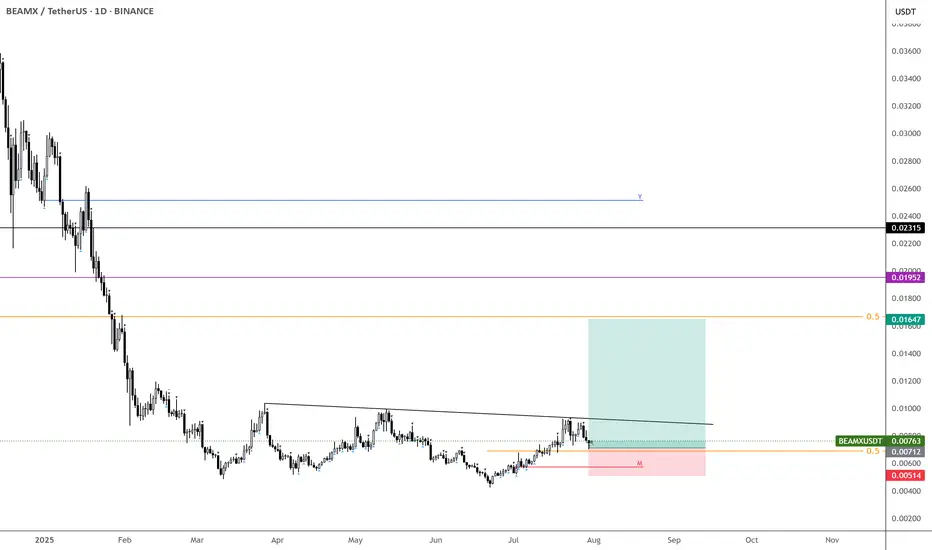
$BEAMX – Waiting for the Pop
One of those coins that’s hard not to track—when it expands, it does so aggressively.
The META sector’s been slow this year and might stay that way, with utility coins taking the spotlight this quarter, so it's key to pick your winners wisely.
That said, NASDAQ:BEAM still has a solid shot at moving higher. Buying some here and ready to adjust if it breaks above the trendline.
Targeting just above a 2x for my first offload. BINANCE:BEAMXUSDT
$POPCAT – Patience Before the Pounce
BYBIT:POPCATUSDT holding up well—expecting a move after 2 weeks of ranging.
Starting to slowly scale in around 30c and under (if you haven't already).
Will reassess if 24c is lost and stays below for too long.
Still targeting $1 if momentum kicks in.

$CHILLGUYUSDT – Second Chance Before the Breakout?Getting a second chance to enter $CHILLGUYUSDT.
Price is still basing out and holding key levels—looking constructive.
I’m adding here and will continue to do so as long as this structure holds.
The path remains tilted to the upside for now.
15 cents still firmly on the horizon.

Nzdusd We are expecting price to go back to the resistance zone , we hv a head and shoulder pattern on the daily time frame so we are expecting a retracment to the neck line then we sell


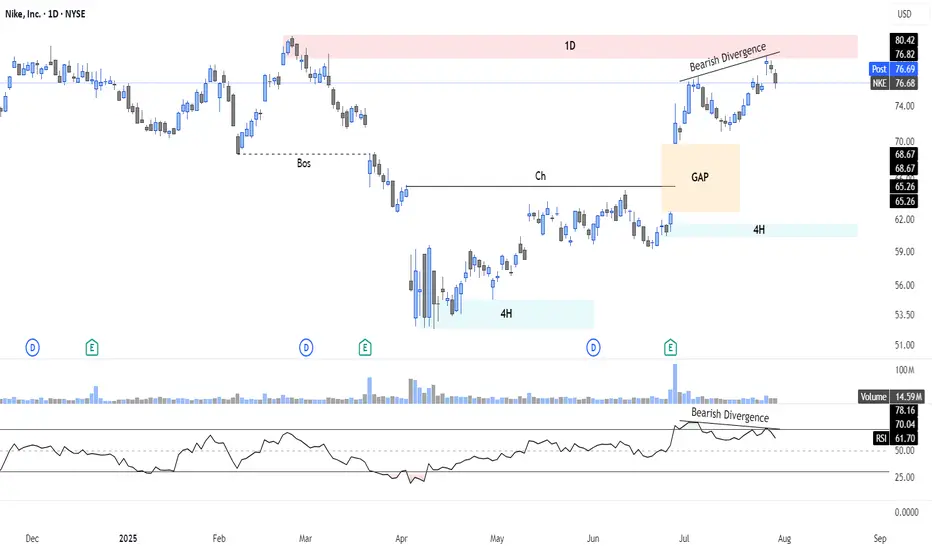
Bearish Setup on Nike ($NKE): Divergence + Supply Rejection📉 I'm watching a high-probability bearish setup on NYSE:NKE , with price rejecting a key 1D supply zone ($77–80) on bearish RSI divergence and fading momentum. A downside gap below adds further confluence.
📊 Technical Context:
Clear 1D supply rejection with divergence
Lower RSI highs vs higher price highs = Bearish divergence
Volume weakening near resistance
Open gap ($65–$68.67) below = magnetic target
Previous BOS indicates potential for continuation move lower
🎯 Strategy Ideas:
Bear Call Spread 80/85 (credit spread with resistance overhead)
Put Debit Spread 75/65 (targeting full gap fill)
⏳ Expiry: Sep 20 – well-timed before IV builds
📌 Setup offers attractive R/R with clearly defined invalidation above $81
🔔 Key Alerts:
$81: "Invalidation – bias flips if breakout confirmed"
$68.67: "Gap close in progress – partial target zone"
➡️ Follow for structured trade setups combining price action, divergence, and options strategies.
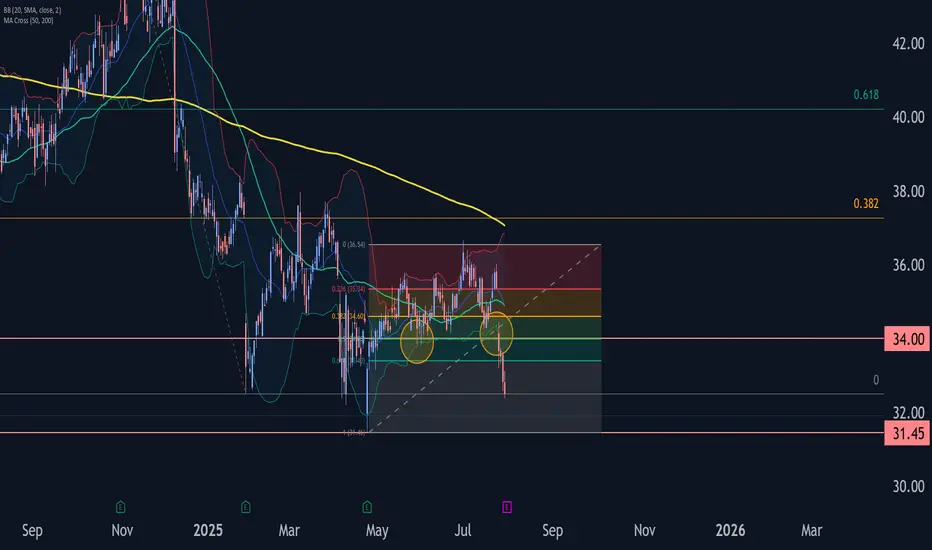
Comcast Wave Analysis – 30 July 2025- Comcast broke the support zone
- Likely fall to support level 31.45
Comcast recently broke the support zone located between the support level 34.00 (which has been reversing the price from the start of May) and the 50% Fibonacci correction of the upward wave A from April.
The breakout of this support zone accelerated the active impulse wave c, which belongs to wave B from June.
Given the clear daily downtrend, Comcast can be expected to fall further to the next support level 31.45 (former multi-month low from April).
EURUSD Wave Analysis – 30 July 2025- EURUSD falling inside accelerated impulse wave c
- Likely fall to support level 1.1200
EURUSD currency pair recently broke the support trendline from February, coinciding with the 38.2% Fibonacci correction of the upward impulse 1 from May.
The breakout of these support levels accelerated the active impulse wave c, which then broke the support at 1.1460.
EURUSD currency pair can be expected to fall further to the next support level 1.1200 (former strong support from May).

USD Dollar Index (DXY): Pushing Higher As Forecast!Welcome back to the Weekly Forex Forecast for the week of July 30 - Aug1
In this video, we will analyze the following FX market:
USD Index
In my last USD video, the forecast was for higher prices. Check the related links below to see that video forecast. It played out exactly as analyzed. The +FVG was used to push for higher prices. The FOMC decision to keep the rate unchanged only pushed it further along.
Enjoy!
May profits be upon you.
Leave any questions or comments in the comment section.
I appreciate any feedback from my viewers!
Like and/or subscribe if you want more accurate analysis.
Thank you so much!
Disclaimer:
I do not provide personal investment advice and I am not a qualified licensed investment advisor.
All information found here, including any ideas, opinions, views, predictions, forecasts, commentaries, suggestions, expressed or implied herein, are for informational, entertainment or educational purposes only and should not be construed as personal investment advice. While the information provided is believed to be accurate, it may include errors or inaccuracies.
I will not and cannot be held liable for any actions you take as a result of anything you read here.
Conduct your own due diligence, or consult a licensed financial advisor or broker before making any and all investment decisions. Any investments, trades, speculations, or decisions made on the basis of any information found on this channel, expressed or implied herein, are committed at your own risk, financial or otherwise.

EURJPY Wave Analysis – 30 July 2025
- EURJPY reversed from the resistance zone
- Likely fall to support level 169.60
EURJPY currency pair recently reversed down from the resistance zone between the resistance level 174.00, the upper daily Bollinger Band and the resistance trendline of the daily up channel from February.
The downward reversal from this resistance zone created the daily Japanese candlesticks reversal pattern, Bearish Engulfing.
EURJPY currency pair can be expected to fall further to the next round support level 169.60 (former resistance from the end of June).
