looks like GBPCHF ready to start bullish rallyafter marking last LH & LL price made support level and got a decent bounce enough to break the marked bearish trendline and also retest it which is a major confluence for a bullish trend. Buy stop order has been shown on the chart
Support and Resistance

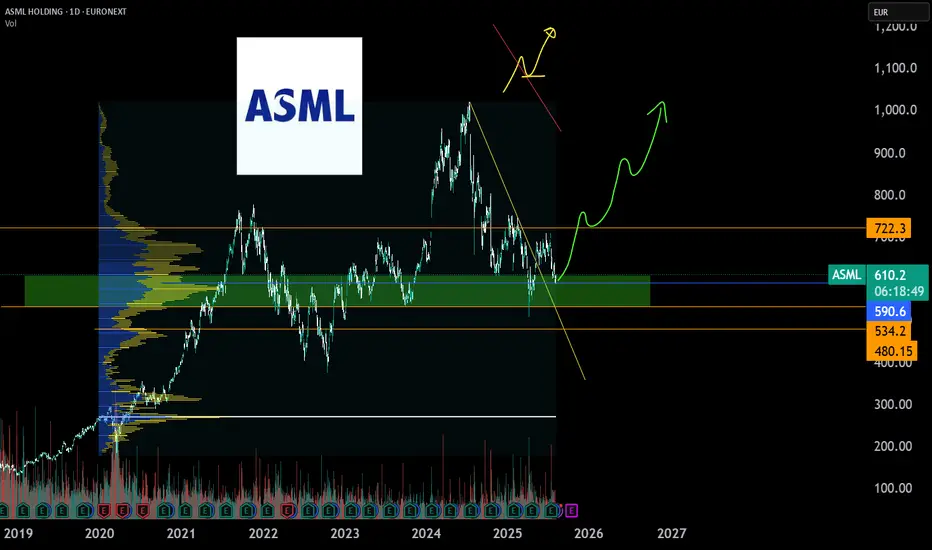
ASML enters buy zone and will posibly rotate to uptrend again.ASML is lagging behind after stagnated growth and a weak order intake due to china chip machine restrictions and uncertaincy about chip machine import tarrifs. It looks like tarrifs on chip machinery is settled and companies will likely place orders again after internal investment approvals.
Earnings of alphabet, microsoft, meta and amazon have confirmed stronger growth in AI datacenter chips than expected and more demand than production, therefore more ASML EUV machines are neceserry to fullfill production needs.
The chart analysis is in the lower range and lower P/E ~26 zone, very cheap for this company which is the monopolist in the EUV machines and therefore undervalued based on history.
Bitcoin 4h Chart Update [Tight Range / Breakout Opportunities]Breakout Opportunities
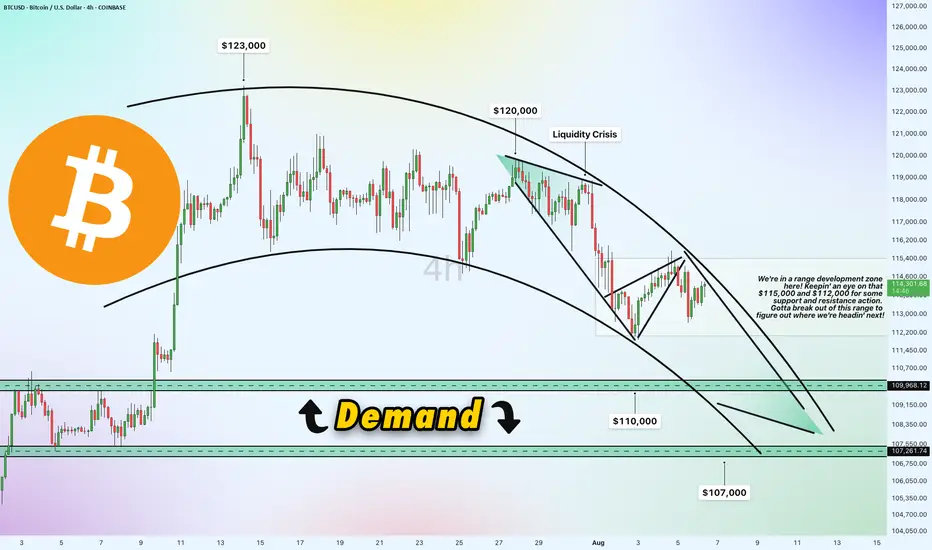
We're in a range development zone here! The chart shows Bitcoin (BTC/USD) trading within a tight range, with key levels at $115,000 and $112,000 acting as critical support and resistance zones. The price recently peaked near $123,000 but has since pulled back, forming a liquidity crisis zone around $120,000 where selling pressure kicked in. A breakout above $115,000 could signal a move toward $120,000 or higher, while a drop below $112,000 might push it toward the demand zone. Gotta break out of this range to figure out where we're headin' next!
Demand Zone
$110,000 & $107,000
Price slipped down from $120,000 due to a lack of buying liquidity, potentially it will land into a demand zone between $110,000 and $107,000. This area could act as a strong support level where buyers might step in. If the price holds here, it could bounce back toward the $112,000-$115,000 range. However, a failure to hold this zone might see it test lower support around $107,000 or even $105,000.
Direction and Possible Ranges
Upward Potential: If Bitcoin breaks above $115,000 with strong volume, the next targets could be $120,000 (liquidity crisis zone) and potentially $123,000, aligning with recent highs. A sustained move above $120,000 might open the door to $125,000 or beyond.
Downward Risk: Should the price fail to hold above $112,000 and break below, it could slide into the demand zone ($110,000-$107,000). Further weakness might push it toward $105,000, a psychological and technical support level.
Current Trend: The chart shows a descending trendline from the $123,000 peak, suggesting bearish pressure unless a decisive breakout occurs. The 4-hour timeframe indicates indecision, with the range-bound action hinting at a potential volatile move once direction is confirmed.
Keep an eye on these levels for the next big move!
NovoNordisk, possible rotation,safe green buy Zone after confirmNovo Nordisk got slammed after Patrick appeared in the Technical analysis and slammed the Price all the way down to goblintown. After some profit cuts and FUD in the market a possibly rotation is possible. The GLP-1 market is misunderstood. if a rotation is confirmed and some more facts will be shared after lilly earnings today a possible rotation and green buy zone will be confirmed. after new facts and confirmation a High risk/reward oppertunity is possible.
Let's all hope patrick will appear back again (maybe after lilly earnings) in the charts and will take everyting upside down.
Good luck.

08/08/25 Gold Swing Levels08/08/25 levels are marked; expecting an up trend
Always, price action determines trade.
Trade parameters
Entry on 5 min chart
Sl: 30-50pips
TP: 2-4x SL

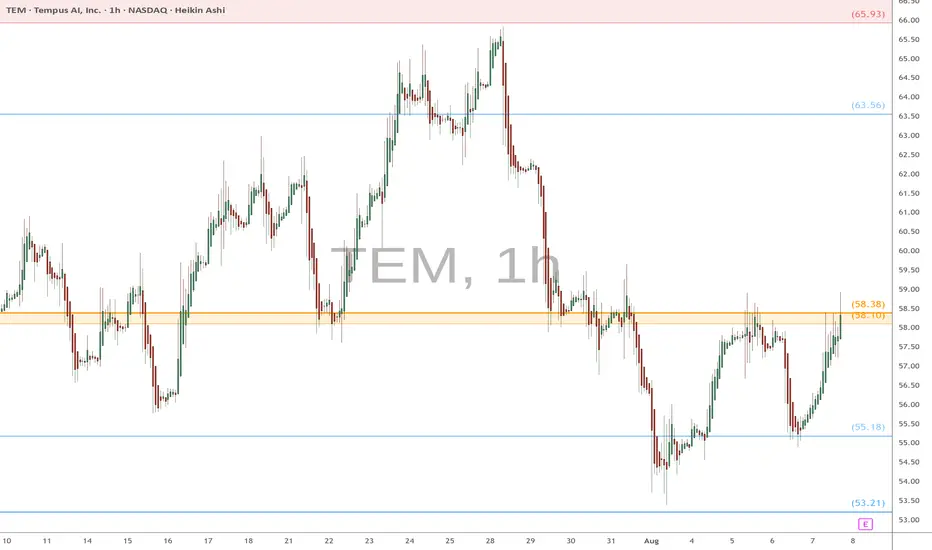
TEM eyes on $58.10/38: Double Golden zone about toe BREAK?TEM is trying to paint a bottom to its downtrend.
Look for break of Double Golden zone $58.10-58.38
Zone is well proven to all traders so watch it closely.
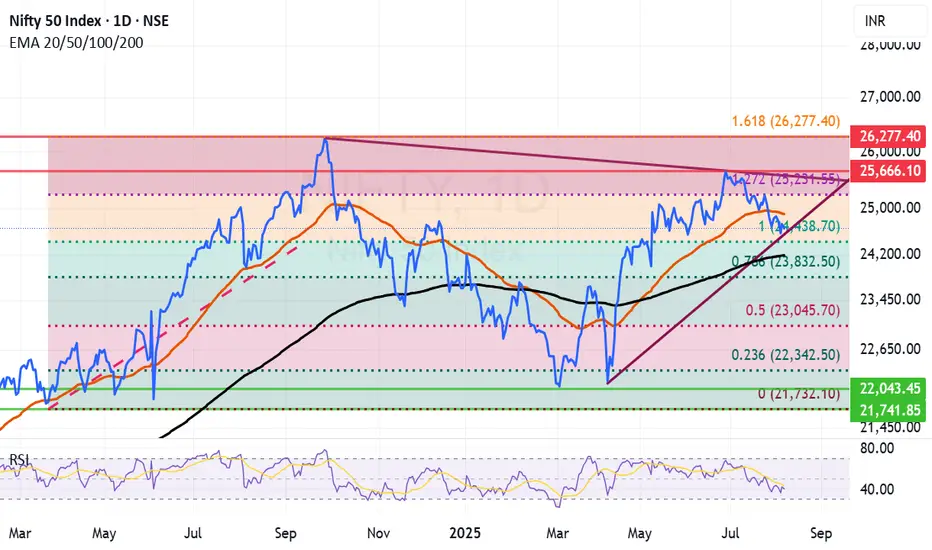
important Fibonacci retracement level approaching for NiftyVery important fibonacci retracement level for Nifty is arriving with ever increasing Trump tantrum and Indian defiance to toe US and EU line on Russian Crude and other trade practises. Market looks delicately placed at this juncture as investors fear that action from the West would undermine Indian growth story. The current fall can be utilized for shifting the balance of the portfolio towards goods that will be 100% made in India and will be consumed in India. For long term investors the current fall can be used to accumulate long term investment ideas with a horizon of 2 to 3 years.
Supports for Nifty remain at: 24438 (Important Fibonacci support), 24190 (Father line support, closing below this will enable bears to pull down Nifty towards next supports), 23832 (Next Fibonacci support), 23045 (Major Fibonacci support).
Resistance for Nifty remain at: 24896 (Mother Line Support), 25231 (Next Fibonacci resistance. A closing above this level will enable bulls to pull Nifty towards next trend line resistance), 25666 (Next Trend line resistance).
Disclaimer: The above information is provided for educational purpose, analysis and paper trading only. Please don't treat this as a buy or sell recommendation for the stock or index. The Techno-Funda analysis is based on data that is more than 3 months old. Supports and Resistances are determined by historic past peaks and Valley in the chart. Many other indicators and patterns like EMA, RSI, MACD, Volumes, Fibonacci, parallel channel etc. use historic data which is 3 months or older cyclical points. There is no guarantee they will work in future as markets are highly volatile and swings in prices are also due to macro and micro factors based on actions taken by the company as well as region and global events. Equity investment is subject to risks. I or my clients or family members might have positions in the stocks that we mention in our educational posts. We will not be responsible for any Profit or loss that may occur due to any financial decision taken based on any data provided in this message. Do consult your investment advisor before taking any financial decisions. Stop losses should be an important part of any investment in equity.
NATGAS WILL FALL|SHORT|
✅NATGAS made a retest of the
Strong horizontal resistance level of 3.150$
And as you can see the price is already
Making a local pullback from
The level which sends a clear
Bearish signal to us therefore
We will be expecting a
Further bearish correction
SHORT🔥
✅Like and subscribe to never miss a new idea!✅

GBP/JPY Could Be Rising Into a Bear ZoneGBP/JPY is trying to notch its third bullish day heading into today's Bank of England (BOE) meeting. But with a cut expected and the potential for a dovish tone, I suspect its upside could be limited. Besides, the technical clues on the daily and weekly chart suggest we may have seen a major top in July.
Matt Simpson, Market Analyst at City Index and Forex.com

MarketBreakdown | USDJPY, NZDUSD, EURJPY, US100
Here are the updates & outlook for multiple instruments in my watch list.
1️⃣ #USDJPY daily time frame 🇺🇸🇯🇵
The market is trading in uptrend.
After the price updated a high, it retraced.
I see a consolidation now and a formation of a narrow
horizontal trading range.
A bullish breakout of a resistance of the range and a daily
candle close above that will provide a strong trend-following bullish signal.
An uptrend will most likely resume then.
2️⃣ #NZDUSD daily time frame 🇳🇿🇺🇸
A test of a historically significant major demand cluster triggered a strong
bullish reaction. The price violated a strong resistance and closed above that.
I think that the market will most likely continue growing.
3️⃣ #EURJPY daily time frame 🇪🇺🇯🇵
The pair is trading within a horizontal parallel channel.
With the absence of high impact fundamental news today,
I think that the market will most likely continue consolidating
and the price may retrace from the resistance.
4️⃣ #NASDAQ Index #US100 daily time frame 🇺🇸🇨🇭
Looks like the market is preparing to update the ATH.
A confirmed violation of a minor daily resistance and a valid
Change of Character on intraday time frames indicate clear
strength of the buyers.
I guess that 23700 level will be tested soon with its highly probable breakout.
Do you agree with my market breakdown?
❤️Please, support my work with like, thank you!❤️
I am part of Trade Nation's Influencer program and receive a monthly fee for using their TradingView charts in my analysis.

Solana Wave Analysis – 7 August 2025- Solana reversed from support area
- Likely to rise to resistance level 180.00
Solana cryptocurrency recently reversed from the support area between the pivotal support level of 160.00, lower daily Bollinger Band and the 61.8% Fibonacci correction of the upward impulse 1 from June.
The upward reversal from this support area stopped the previous short-term ABC correction 2 from July.
Given the clear daily uptrend, Solana cryptocurrency can be expected to rise to the next resistance level 180.00.

GBP_CAD SHORT FROM RESISTANCE|
✅GBP_CAD is set to retest a
Strong resistance level above at 1.8511
After trading in a local uptrend for some time
Which makes a bearish pullback a likely scenario
With the target being a local support below at 1.8430
SHORT🔥
✅Like and subscribe to never miss a new idea!✅

ABOT LongAbot is again coming to hit its previous all-time high (1145) and if broken, it will go on to test its recent all-time high (1310).
Resistance will be faced at 1145, 1310 and 1328 levels.
If passed successfully in its 3rd attempt, stock may see a level as high as 1990.
Today's volume is a clear indication of entry of some big player.
Further, RSI, stoch and MACD are all bullish.
Q1 result was not so bad and Q2 result may become a catalyst to breakout the resistances.

DeGRAM | DOGEUSD broke out of the descending wedge📊 Technical Analysis
● DOGEUSD rebounded from 0.2004 support, breaking the corrective trendline and resuming its climb within the rising channel structure.
● Price is now targeting the 0.2615 resistance, with momentum driven by a sustained series of higher lows and a breakout retest.
💡 Fundamental Analysis
● Broader crypto market gains following BTC’s push above $64k have lifted altcoin sentiment, while DOGE’s network activity rose after an uptick in whale transactions.
✨ Summary
Long above 0.2200; target 0.2615. Setup remains valid while price holds above 0.2004.
-------------------
Share your opinion in the comments and support the idea with a like. Thanks for your support!

GBPUSD: Bullish Continuation Ahead?! 🇬🇧🇺🇸
GBPUSD violated a significant resistance cluster yesterday.
The market broke through that with a high momentum bullish candle.
Chances will be high that the pair will continue rising.
The next goal for the buyers is 1.35 psychological resistance.
❤️Please, support my work with like, thank you!❤️

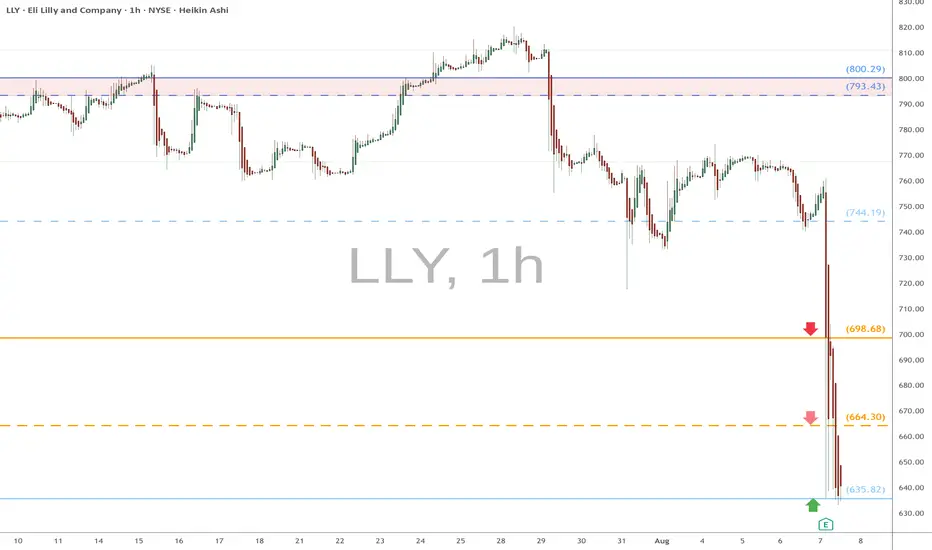
LLY eyes on $635.82: Major fib may hold earnings + news CRASHLLY earnings plus some GLP news tanked the stock.
But the crash came to an abrupt halt at a Genesis fib.
Look for a bounce but expect bears at the Golden's above.
SHORT ON SPX/USDSpy has created a Double top followed by a CHOC and retest to the downside.
Their is plenty sell side liquidity to be collected as I expect a major drop on spy.
Looking to catch 300-400 points on SPY.

SLPUSDT the big moves are ready!!As we can see on weekly chart high volume with pump show it self and price and market is ready to start one of those big pumps to the upside and this time even breakout of trendline and more gain after that too.
so we are long here and looking for at least our first target which is +250%.
DISCLAIMER: ((trade based on your own decision))
<<press like👍 if you enjoy💚

Dow Jones Industrial Average (DJIA) – 1H Chart Analysis | Aug 8,Current Structure:
Price is trading between 44,119 resistance and 43,816 support, consolidating after a sharp drop and partial recovery.
Resistance Zone:
The 44,119 level is acting as immediate intraday resistance; a clean breakout could push toward 44,514.
Support Zone:
43,816 remains a strong floor; below this, 43,524 is the key level where last strong bullish reversal started.
Momentum Outlook:
Recovery candles are showing smaller bodies with upper wicks, suggesting buyers are cautious and momentum is fading.
Trading Bias:
Bullish: Break above 44,119 → target 44,514.
Bearish: Break below 43,816 → retest of 43,524 likely.

EURCHF: Intraday Bearish Move?! 🇪🇺🇨🇭
EURCHF reached a key horizontal resistance level.
I think that there is a high probability that the price
will retrace from that.
The closest intraday support is 0.93825,
it will be the goal for the sellers.
❤️Please, support my work with like, thank you!❤️
I am part of Trade Nation's Influencer program and receive a monthly fee for using their TradingView charts in my analysis.

Nifty levels - Aug 08, 2025Nifty support and resistance levels are valuable tools for making informed trading decisions, specifically when combined with the analysis of 5-minute timeframe candlesticks and VWAP. By closely monitoring these levels and observing the price movements within this timeframe, traders can enhance the accuracy of their entry and exit points. It is important to bear in mind that support and resistance levels are not fixed, and they can change over time as market conditions evolve.
The dashed lines on the chart indicate the reaction levels, serving as additional points of significance to consider. Furthermore, take note of the response at the levels of the High, Low, and Close values from the day prior.
We hope you find this information beneficial in your trading endeavors.
* If you found the idea appealing, kindly tap the Boost icon located below the chart. We encourage you to share your thoughts and comments regarding it.

Hidden secrets amidst gold volatility
💡Message Strategy
The current gold price is primarily supported by the following fundamental factors:
First, US President Trump signed an executive order imposing an additional 25% tariff on Indian imports, bringing the cumulative tariff rate to 50%. Meanwhile, the market expects Japanese goods to face an additional 15% tariff. This series of policies has fueled concerns about global economic uncertainty, significantly increasing market demand for safe-haven assets and benefiting gold.
Second, recent weak US economic data, including last Friday's weaker-than-expected non-farm payroll data and Tuesday's subdued ISM services PMI, have reinforced expectations of a Federal Reserve rate cut this year.
Furthermore, the US dollar has remained under pressure, weakening against major currencies to a more than one-week low. Since gold is priced in US dollars, a weaker dollar has increased purchasing power in non-US markets, indirectly pushing up gold prices.
Despite the overall optimistic tone in the equity market, the upward trend in risky assets has not dampened gold's momentum, indicating that market sentiment has not yet returned to a risk-on, and gold continues to serve as a core safe-haven asset.
📊Technical aspects
Looking at the two-hour chart, gold prices have been trading in a volatile consolidation pattern since rebounding from a low of $2,955. They are currently trading above the middle Bollinger Band ($3,340) and approaching the upper Bollinger Band ($3,430).
The Bollinger Bands are showing signs of convergence, indicating a temporary contraction in volatility, which could be a precursor to a potential breakout. A subsequent breakout above the upper Bollinger Band on larger volume would signal a "Bollinger Band squeeze + breakout" pattern, potentially testing the previous high of $3,430.
If gold breaks through the 3440 line with strength, then gold will continue to challenge the 3500 integer mark.
💰Strategy Package
Long Position:3365-3375,SL:3350,Target: 3400-3430

Don’t Blink — Gold Charging Toward 3400!Overnight, we entered a long trade at 3365 and successfully closed the trade by hitting TP: 3395, locking in nearly 300pips of profit. This was a very successful and accurate trading strategy.
Just now, gold became very crazy after rising, and plunged directly from around 3397 to around 3372. It was a very scary and crazy diving action. In fact, I am not worried about it. On the contrary, I am very happy that it provides me with another opportunity to enter the market and go long on gold. I've already entered a long position in gold again, as planned, in the 3375-3365 area.
Regarding the recent plunge in gold, I think it was intended to scare off the long positions that were somewhat loose in their intentions. Although gold has fallen sharply, it is still in a recent volatile upward structure. The volatile upward structure has not been destroyed in the short term, so I believe that gold will not have much room for retracement for the time being under the support of the bullish structure. On the contrary, I believe that after gold touches around 3397, even if it is weak, it will try to hit the 3400 mark, and it is even expected to continue the bullish trend to the 3420-3430 area.
There may be many friends in the market waiting for the opportunity to enter the long market at 3350 or even 3340, but what I want to say is that under the support of the gold bull structure, the downward space has been greatly limited. In the short term, gold may not go to such a low position at all, so relatively speaking, I prefer to go long on gold in the 3375-3365 area, and I have indeed done so!
