DeGRAM | SHIBUSD fell below the support line📊 Technical Analysis
● A classic Head and Shoulders pattern has formed below resistance at 0.00001411, confirming a bearish reversal with neckline break.
● Price is descending inside a bearish flag and is testing prior support at 0.00001270, with the next major level near 0.00001088.
💡 Fundamental Analysis
● Risk sentiment weakened after latest FOMC minutes signaled persistent inflation risk, fueling a defensive tilt in crypto.
● Whale outflows from SHIB wallets and declining DEX volumes suggest bearish positioning and fading demand.
✨ Summary
Bearish reversal confirmed below 0.00001411. Break of 0.00001270 opens path to 0.00001088. Watch neckline retests for renewed selling pressure.
-------------------
Share your opinion in the comments and support the idea with a like. Thanks for your support!
Support and Resistance

DeGRAM | GBPUSD reached the lower boundary of the channel📊 Technical Analysis
● GBPUSD has broken out of a falling wedge within a descending channel, reclaiming the lower boundary of the broader structure.
● Price is consolidating just above 1.33160 support and appears ready to retest the 1.34650 resistance, aided by a series of higher lows and a bullish break of short-term trendlines.
💡 Fundamental Analysis
● Weakening USD sentiment continues after Friday’s softer core PCE and downward revision of Michigan inflation expectations.
● UK economic sentiment improved after recent wage growth and mortgage approval data exceeded forecasts, bolstering GBP.
✨ Summary
Breakout from wedge confirms bullish bias. Support at 1.33160; target 1.34650 short-term. Watch for rally continuation while holding above 1.33625.
-------------------
Share your opinion in the comments and support the idea with a like. Thanks for your support!

NAS100 MAY FORM THE BEARISH HEAD AND SHOULDERS.NAS100 MAY FORM THE BEARISH HEAD AND SHOULDERS.
NAS100 has been trading sideways since the beginning of the week, forming local highs with lows staying at same price for the most part. The price seem to form the Head and Shoulders reversal pattern
What is a Head and Shoulders?
A Head and Shoulders pattern is a reversal chart pattern signaling a potential trend change. It consists of three peaks: two lower "shoulders" and a higher "head" in the middle, connected by a "neckline" (support level). A bullish (inverse) Head and Shoulders forms at a downtrend's end, signaling an uptrend; a bearish Head and Shoulders forms at an uptrend's end, signaling a downtrend.
Currently the SMA50 is pushing on NAS100 from above, while SMA200 is supporting the price. In case the SMA200 on 30-m minutes timeframe gets broken, we may see the decline towards 23,200.00 support level.

SHIBUSDT major weekly support of 0.000010$ is strong!!Two weekly supports which are 0.000010$ & 0.000007$ are strong enough to hold price like past years and i think soon those weekly +100% candles will surprise us here on BINANCE:SHIBUSDT too.
all major supports and resistances are all also mentioned on the chart too.
DISCLAIMER: ((trade based on your own decision))
<<press like👍 if you enjoy💚

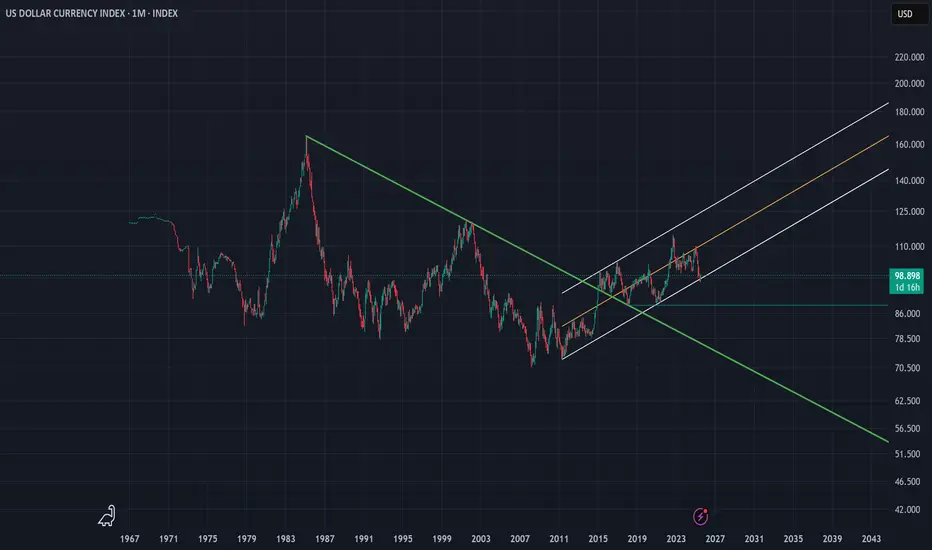
DXY | Timeframe: 1MWith the breakout of the downtrend line drawn since 1985 and its breach in late 2014, the DXY index officially entered a relatively stable upward trend and is currently oscillating within a parallel channel. Although, on the monthly timeframe, it has recently touched the lower boundary of the channel, we can expect at least a rise toward the channel’s midline. However, if the lower support of the channel is broken, a static support around the approximate rate of 88 can be considered a notable support level. Should this support also fail, the long-term downtrend dating back to 1985 would be regarded as the most important support for the DXY index. Meanwhile, moving averages such as the MA50, MA100, and other longer-period moving averages serve as dynamic supports along the way.
It is also worth mentioning that currently reaching the 120 level is considered an ideal target for the DXY index, and ultimately, it is by breaking this resistance zone that the index can reach its “Utopia”.
---------
I will try to continuously update this analysis of the TOTAL symbol according to market changes and developments. Also, I welcome reading your critiques and comments, so don’t forget to leave a comment!
HSI dipping, traders are flipping,stay Zen - Index is yoga-ing!Hello everyone!
Today HK50 PEPPERSTONE:HK50 D open at 25350, Hi:25446 Lo:25164
IMO: Deep retracement is happening with profit taking from futures expiring tomorrow for traders & waiting for catalysts for talks next week.
For 4H - Index moving closer to Gravity Trend Line - look out for entry for swing (using shorter tf to entry).
At point of writing ✍️: the HK50 $PEPPERSTONE uptrend mode is on track and now in the retracing mode.
currently on D Chart -
🗝️ Resistance Level : 25300
Support Level : 24950
Support level 24558 (MA30)
🗝️ Strong Support Level : 24048 (Gravity Trend Line)
1H Chart HK50 $PEPPERSTONE
If today not able to close 25304 (25335 HSI), it's likely a deep retracement.
Shor term pullback -for swing trade and for mid-longer term it's still on bull track. Most likely people profit taking before the HSI futures expires tomorrow.
Macro view - Index continue to be Bullish. Well, markets cooled a bit waiting for details from the ongoing US-China trade talks early August'25.
Higher Hi🚩point marked in Chart HK50 $PEPPERSTONE
21May2025 -23909
11June2025 -24430
25June2025 -24531
16Jul2025 - 24842
18Jul2025 - 25052
24Jul2025 - 25729
?? ??2025 - 26163 Revised Target
The HSI Index HSI:HSI
At point of writing ✍️ Index is being sucked towards to D GravityLine - 24085; it fall below the sideway box.
If it doesn't close above the key support level this week, the deep retracement is happening.
🧨🧨🧨Pay attention and cautious.
🗝️ Next Resistance Level : 25350
🗝️ Next Support Level : 24900-25200
🗝️ Strong Support Level : 24300-24750
Let's follow your own zentradingstrategy , continue to trade; Observe your emotions as you would the clouds—passing, shifting, never you.— Mindfulness helps you respond, not react, in volatile markets and moments.
Be ease at trading!
** Please Boost 🚀, FOLLOW ✅, SHARE 🙌 and COMMENT ✍ if you enjoy this idea!
Share your trading journey here to encourage the community and friends who pursing the same journey.

NZDUSD potential 600 pips in makingPrice of NZDUSD have made a structure that has a high probability to be a triangle just after a leading diagonal. If this view is favored then we should expect price to regain its bullish momentum to make wave C. To take advantage of this possibility a trade should find areas of support to go long. One of the places is as marked on the chart on lower trendline of the triangle.

BTCUSDT.PThe best area to buy MARKETSCOM:BITCOIN is $119,000 and wait for the pullback to be complete.
But for selling and shorting, be sure to wait for $115,000 to break down.
⚠️Please control risk managements.

XAUUSD. MINOR UPWARDS CONSOLIDATION BEFORE THE NEXT MOVE.XAUUSD. MINOR UPWARDS CONSOLIDATION BEFORE THE NEXT MOVE.
XAUUSD rebounded from local support level of 3,300.00 and attempted to develop some bullish momentum here yesterday. However, the price went into consolidation, showing us the weakness of this short-term bullish rebound. RSI shows the bearish divergence, the price is ready to drop. Of course, fundamentals of last couple of days don't favor this asset either. The decline towards support level of 3,300.00 is expected.

EURUSD – Will the bullish parallel channel hold?The EUR/USD currency pair is currently trading within a clearly defined bullish parallel channel, as shown on the 4-hour chart. This channel has provided consistent directional structure over recent weeks, with price respecting both its upper resistance and lower support boundaries. At present, the pair is approaching the lower end of this channel, raising the critical question: will it bounce off support and continue the bullish trajectory, or will it decisively break down, opening the door to lower price targets?
Bullish parallel channel
On the 4-hour timeframe, the EUR/USD has been consistently moving within a bullish parallel channel, characterized by higher highs and higher lows. This price structure suggests sustained upward momentum, with the top of the channel acting as dynamic resistance and the bottom as reliable support. Today, price action is testing the lower boundary of the channel once again. A successful hold at this level could confirm continued bullish structure and open the door for a potential rebound.
Bullish scenario
In the bullish scenario, the EUR/USD holds its ground at the support region around 1.164, where the lower boundary of the channel intersects with price. For upward continuation, it must overcome the short-term resistance posed by the 4-hour Fair Value Gap (FVG) between 1.169 and 1.174. A reclaim and close above this zone could signal a shift in short-term momentum and lead to a move back toward the upper boundary of the channel. However, the path upward is not without resistance , price must navigate through potential supply zones and maintain higher lows to preserve the bullish structure.
Bearish scenario
On the other hand, a break and close below the channel support could indicate a change in market sentiment and invalidate the bullish pattern. In this bearish case, we would expect a structure break confirmation followed by a possible retest of the broken trendline and the 4-hour FVG. If this retest fails to reclaim the trendline, bearish continuation becomes more likely. The next significant area of interest lies around the 1.150 level, where a bullish 4-hour FVG exists. This zone could act as a potential short-term support and serve as a target for the downside move before any meaningful bounce occurs.
Final thoughts
The EUR/USD pair is currently at a technical crossroads. Traders should watch closely for price behavior around the lower channel boundary to determine whether bullish momentum will resume or whether a bearish breakout will set the tone for deeper retracement. Confirmation, either through a bounce or a breakdown with a retest, will be key in validating the next directional move.
-------------------------
Disclosure: I am part of Trade Nation's Influencer program and receive a monthly fee for using their TradingView charts in my analysis.
Thanks for your support. If you enjoyed this analysis, make sure to follow me so you don't miss the next one. And if you found it helpful, feel free to drop a like 👍 and leave a comment 💬, I’d love to hear your thoughts!

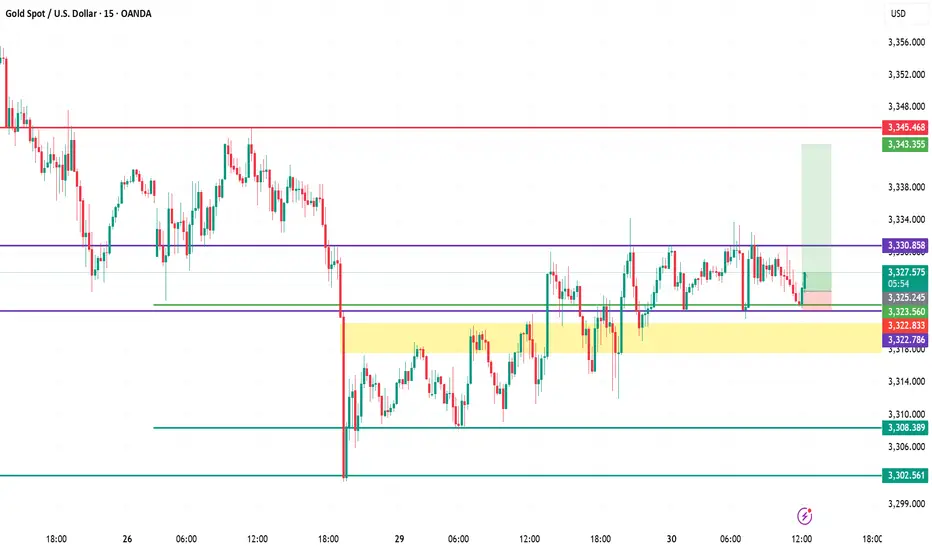
XAUUSD (Gold) Analysis – July 30, 2025 | 15-Min ChartStructure & Context
Gold is consolidating just above the key intraday support of $3,323, following a bounce from the high-demand zone ($3,322–$3,323.5).
Demand Zone Validity
The yellow zone has consistently attracted buyers, defending it multiple times with sharp rejections. This confirms it as a short-term demand base.
Resistance Still Capping Upside
$3,330.85 acts as immediate resistance. Price has failed to close above it despite several wicks testing this zone — showing strong seller presence.
Scalp Long Idea In Play
A buy setup is in motion with entry near $3,323.5, stop below $3,322, and target at $3,337.5. Risk-to-reward remains favorable while above demand.
Critical Levels to Watch
Support: $3,322.8 → $3,308.3 → $3,302.5
Resistance: $3,330.8 → $3,337.5 → $3,345.4
🎯 Bias: Bullish above $3,322, bearish if broken.
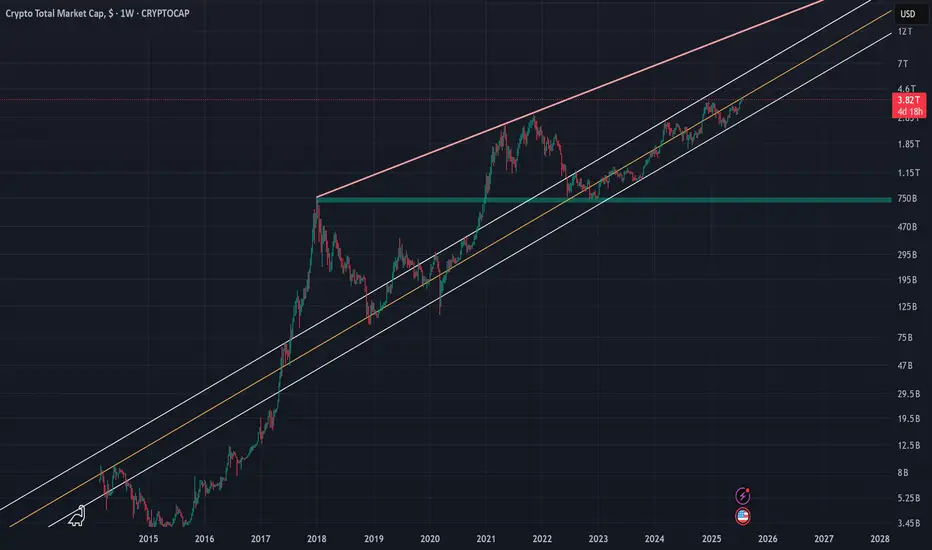
Crypto Total Market Cap (TOTAL) | 1WThe crypto market cap represented by the symbol TOTAL can be considered the most important index for analyzing the cryptocurrency market, although I believe that analyzing Bitcoin itself, given its strong positive correlation with the TOTAL index, would yield similar results. In the attached image, the red line actually indicates the overall resistance level of the symbol, and the drawn parallel channel illustrates the current upward trend of the TOTAL symbol, which is now on the verge of encountering its round resistance at 4 trillion dollars. While we should expect a correction around this level, breaking through the 4 trillion dollar resistance could likely lead to a market cap of 6 to 7 trillion dollars in the next phase. On the other hand, with support at 2.4 trillion dollars based on the 100-week SMA on the weekly timeframe, the 750 billion dollar level—marked by a green zone in the image—can still be considered the most important long-term market support, even before the fifth halving.
I will try to continuously update this analysis of the TOTAL symbol according to market changes and developments. Also, I welcome reading your critiques and comments, so don’t forget to leave a comment!
USDT DOMINANCE Update (2H)After losing important levels, the price has now started to pull back, and it seems that some of the market’s major players have taken profits.
On the chart, the price faces two key levels ahead, from which it could be rejected at either one.
There is also a possibility that the price will reach the key level zone.
We are waiting for the reaction to these levels.
A daily candle close above the invalidation level will invalidate this analysis.
For risk management, please don't forget stop loss and capital management
Comment if you have any questions
Thank You

EURUSD has formed a double top patternOn the daily chart, EURUSD has formed a double top pattern. Currently, attention should be paid to the resistance around 1.1600. If the rebound does not break through, it is expected to continue to fall. The support below is around 1.1450. If it falls below, the support below is around 1.1370.

GBPUSD SELLAfter seeing the previous daily candle close bearish and the 4hr had a retrace back into the moving averages we could expect price to see further sell off into support

EURJPY ANALYSISAfter seeing the daily still pushing to the downside and breaking below key support of 171.250 we could be looking out for a retest and continuation to the down side target of 170.000

MIDWEEK FORECAST WHAT TO LOOK FOR WHEN WEARING THE MARKET LENSLess is more when you are looking for setups you can just check how am not complicating my charts yet am always finding setups everyday

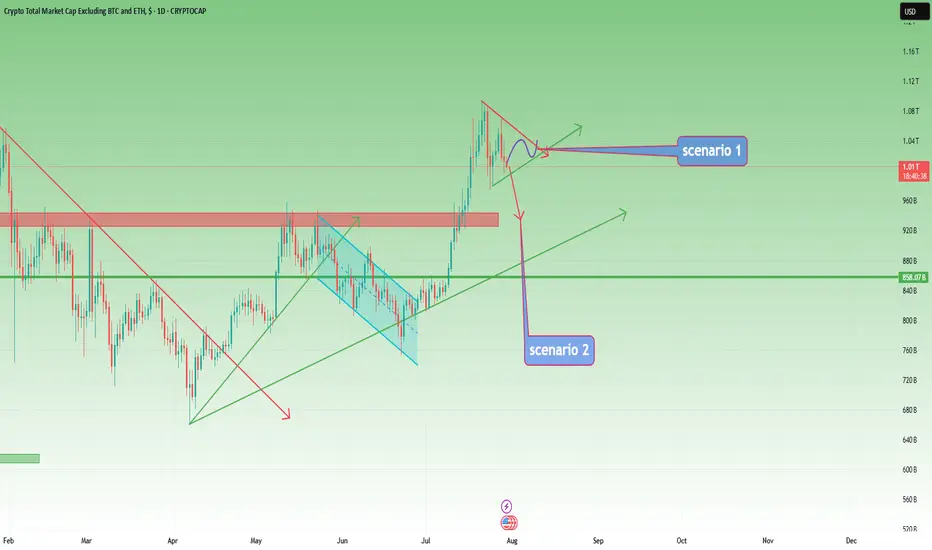
TOTAL3 – Still Bullish, But Waiting for Clarity
In my previous analysis on TOTAL3, I mentioned the high probability of a correction, but also noted that I didn’t expect the 925–940B zone to be reached.
And indeed, price reversed early — finding support around 975B before moving higher.
However, after a push up to 1.07T, the market has started to pull back again.
📊 Current Outlook – Two Scenarios I’m Watching:
Bullish Triangle:
Price may continue to consolidate into a symmetrical triangle, then resume the uptrend from there.
Deeper Pullback into Support:
The market could retest the 925–940B zone, a key support area, before bouncing back up.
⚠️ Bearish Reassessment?
Of course, if price breaks back below 925B and stays there, we’ll have to reconsider the bullish case.
But for now, the trend remains intact, and there’s no technical reason to panic.
📌 My Plan:
I already hold a bag of alts, and I’m not adding for now.
I’ll wait until the pattern becomes clearer — whether it’s a triangle breakout or a dip into support.
Until then, I’m sitting comfortably on what I already hold.
USDJPY PRICE AT RESISTANCE!Price is stuck at a resistance level of 148.198 ahead of US fed interest rate today. I from the higher timeframes (monthly and weekly) the market is still bullish. If we do get a break above the resistance level. More bullish price action will be envisaged.

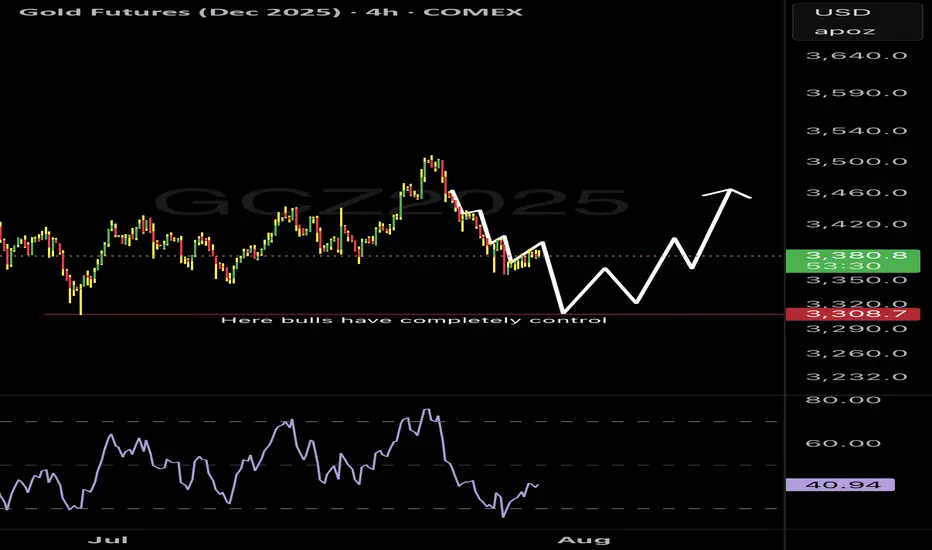
Gold loading up on buys but first, more drops!Gold is in a place where many are loading up on buys and I understand why. Gold has been taking some significant drops since pushing all time highs but check my charts and reason with me.
In the large timeframes gold still has some movement down to complete the cycle before going back for all time highs again.
Additionally it’s holding the $3388 resistance level (futures price) pretty strong on the 15 minute chart. It’s gonna be an interesting week for gold to say the least.
Gold (XAU/USD) 4H Timeframe UpdateGold opened the week continuing its bearish move down to the 3303 area. Since then, price has been slowly climbing, showing signs of retracement — but structure remains uncertain.
On the 4H timeframe, we’re currently forming a head and shoulders pattern (now 2/3 complete), and price action is also shaping a bearish flag, suggesting a possible continuation to the downside.
We’re heading into heavy economic news starting tomorrow morning, along with the beginning of earnings season for major assets — all of which could trigger sharp volatility in gold.
Key levels to watch:
• A break above the swing high at 3345 would suggest a bullish continuation.
• A break below the swing low at 3308 would confirm a bearish move.
• The resistance level at 3365 is a key zone to monitor — this is where I expect the right shoulder of the head and shoulders pattern to complete.
Importantly, the 50 SMA is currently traveling in line with this 3365 resistance, adding extra confluence. A break above 3365 would not only take out a strong historical level but also break above the 50 SMA, signaling potential strength to the upside. On the flip side, a rejection from this area would serve as a double rejection — from both resistance and the 50 SMA — reinforcing the bearish case.
For now, it’s a tug of war between buyers and sellers, and with the upcoming data releases, momentum could shift fast.
⚠️ As always, wait for confirmed setups, manage your risk, and only trade with a plan.
Limit risk to 1–2% of your capital per day.

could continue to trendI am still fairly new to trading. It took my quite some time to analyze this chart, it was a trend, then it became a ranged market. I had difficulty finding a support, however, i did find my middle support, it is the black line, it could possible drop there, or, it would stay in my green support

OSCR: back to support and now it’s decision timeAfter the recent impulse move, OSCR has pulled back to a key support zone around 13.65. That area aligns with the 0.79 Fib retracement, a horizontal level from spring, and a rising trendline that has already triggered reversals in the past. The structure is still intact, and buyers are testing the level again. If support holds and we get a bullish confirmation, the next target is 17.01, followed by a potential breakout toward the high at 22.81.
Volume remains elevated, the overall structure is healthy, and the correction is controlled. A break below 13.00 would invalidate the setup - until then, it’s a clean, high-reward zone with tight risk.
Fundamentally, Oscar Health has revised its 2025 guidance: revenue is expected in the $12–12.2B range, with operating losses projected between $200M and $300M. Despite softening topline growth, earnings per share are improving, and investor sentiment has been shifting. Technical strength is also reflected in the recent rise in RS Rating to 93, confirming that the stock is showing relative leadership even as the market cools.
This is one of those setups where both technicals and narrative are aligning - now we just need confirmation from the chart.
