AUDUSD InsightHello to all subscribers.
Please share your personal opinions in the comments. Don’t forget to like and subscribe!
Key Points
- According to the U.S. June Job Openings and Labor Turnover Survey (JOLTS), the seasonally adjusted number of job openings was 7.437 million, a decrease of 275,000 from the previous month, falling short of the market expectation of 7.55 million.
- During high-level talks between the U.S. and China held in Stockholm, Sweden, both sides reportedly agreed to extend the tariff suspension measure for an additional 90 days.
- While the Federal Reserve is expected to hold rates steady in the July FOMC meeting, there is growing anticipation for a dovish stance suggesting a possible rate cut in September.
This Week's Major Economic Events
+ July 30: Germany Q2 GDP, U.S. ADP Nonfarm Employment Change (July), U.S. Q2 GDP, Bank of Canada rate decision, FOMC meeting results announcement
+ July 31: Bank of Japan rate decision, Germany July Consumer Price Index (CPI), U.S. June Personal Consumption Expenditures (PCE) Price Index
+ August 1: Eurozone July CPI, U.S. July Nonfarm Payrolls, U.S. July Unemployment Rate
AUDUSD Chart Analysis
The pair recently climbed above the 0.66000 level but has since reversed, giving back gains. However, both higher highs and higher lows are being established, suggesting the current pullback is part of a gradual uptrend. A continued bullish outlook is expected over the long term, with a projected high around the 0.69000 level.
Support and Resistance

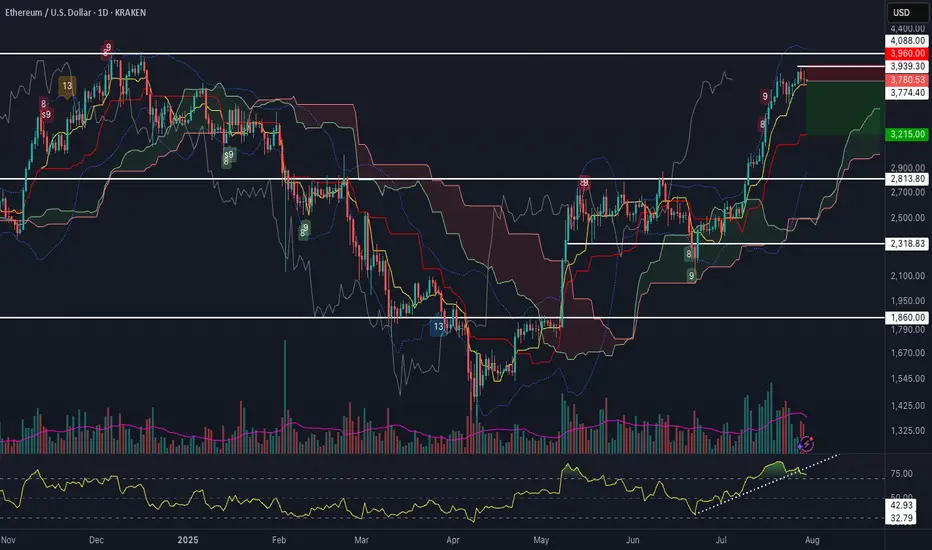
ETH Potential Swing ReversalAfter a strong leg higher, Ethereum is flashing a confluence of short-term reversal signals:
1. RSI trendline break on the daily, with bearish divergence building
2. %B Bollinger Band divergence, following three consecutive upper band taps during this move
3. Demark 9
4. Formation of a Doji candle at resistance, showing indecision near a key level
A clean break here opens room towards Ichimoku cloud support at $3,215.
🧠 Thoughts welcome!
Crude oil starts to rise, are you ready?
💡Message Strategy
Oil prices continued their upward trend amid rising geopolitical risks. US President Trump recently issued a tough statement, demanding Russia end the conflict with Ukraine within 10 to 12 days or face secondary sanctions.
Fears that Russian crude oil exports might be disrupted pushed Brent crude oil prices close to $70 per barrel, marking their largest single-day gain in two weeks at 2.3%. Meanwhile, US West Texas Intermediate (WTI) crude oil prices also remained stable around $67.
The intertwined uncertainties of geopolitics and trade policy have complicated market sentiment. Besides the situation between Russia and Ukraine, investors are closely watching the August 1st trade policy deadline set by the United States and the upcoming OPEC+ meeting in early August, which will determine its September crude oil production increase plan.
The industry generally expects that despite tight crude oil inventories in some parts of the world and strong peak season consumption in the Northern Hemisphere, if OPEC+ continues to increase production, oversupply pressure will gradually emerge by the end of the year.
📊Technical aspects
From a technical perspective, the daily chart of US crude oil (WTI) shows a modest upward trend. The current price is trading steadily above its 100-day moving average, indicating continued bullish momentum.
The Relative Strength Index (RSI) remains between 55 and 60, remaining within overbought territory, suggesting further upside potential. A successful break above the key resistance level of $68.50 would open up opportunities towards $70.
💰Strategy Package
Long Position:66.50-67.00,SL:65.50,Target:68.50-69.00

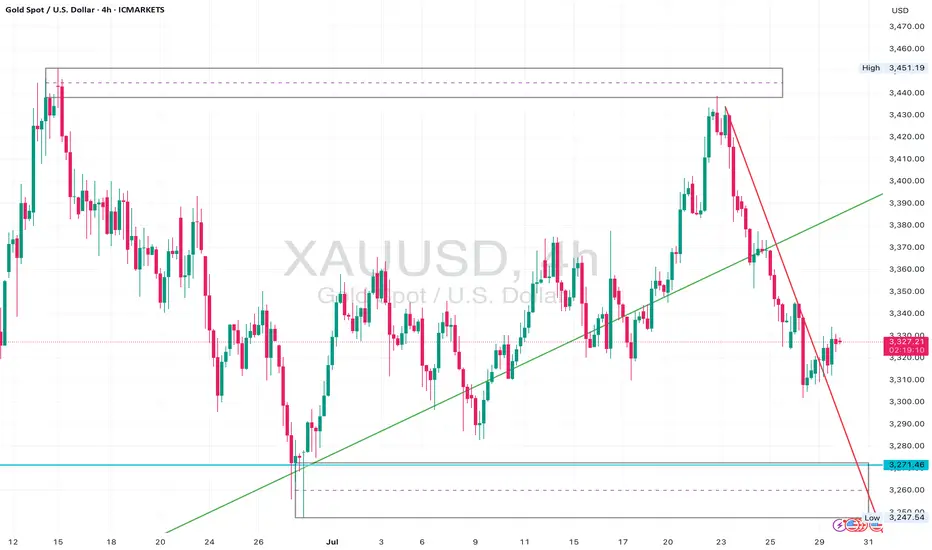
Gold Bear Flag Forming After Trendline Break – Short Setup BelowGold (XAUUSD) recently broke a major ascending trendline that had held since late June, leading to an aggressive sell-off from the $3,440s down to the $3,270 zone.
Following that, price is now consolidating just beneath the previous support trendline, forming what appears to be a bear flag or rising channel inside a corrective structure.
The $3,330–$3,340 zone is now acting as resistance, and price is struggling to close above this level.
The current structure suggests continuation to the downside, with clean space to revisit the $3,271 liquidity pool and potentially even sweep that low.
Watch for bearish confirmation below the current flag – especially if price prints a rejection wick or engulfing candle at the upper edge of the box.
⸻
Key Levels:
• Resistance: $3,330 – $3,340 (flag top + previous support turned resistance)
• Support: $3,271 zone, followed by $3,248 sweep potential
⸻
Trigger Criteria:
• Bearish rejection inside the flag (e.g. pin bar or engulfing)
• Break and retest of the flag bottom or horizontal support
⸻
Risk Note:
A clean break back above $3,350 and reclaim of the previous trendline would invalidate this idea short term and shift bias back to neutral/bullish.
Why Did Novo Stock Fall So Sharply YesterdayNovo Nordisk shares plunged nearly 20–23% on July 29, 2025, marking its worst trading day since Black Monday in 1987.
Significant Downgrade of 2025 Financial Outlook
The company revised its sales growth forecast for 2025 down to 8–14%, from its prior guidance of 13–21%, and reduced expected operating profit growth from 16–24% to 10–16%. This adjustment was attributed to weaker-than-expected demand for Wegovy and Ozempic, and rising competitive pressures
#TheWallStreetJournal
I will start my accumulation using DCA, but will be happier to start buying this stock heavily from $47 zone.
trade with care.
I look forward to connecting with you

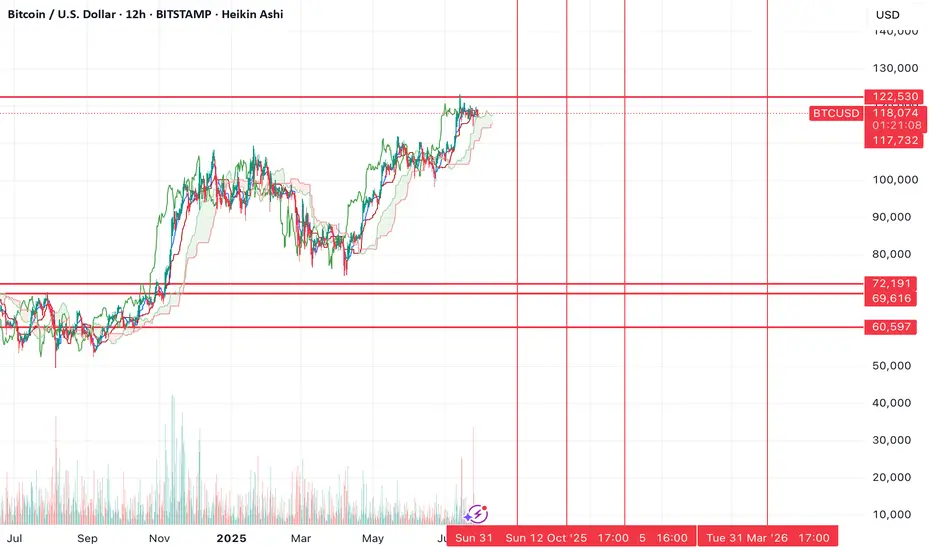
BTC highs in, new lows coming soon?~$122.5k was the top of the range. Now we'll need to go test the lows before we can continue higher.
Alts are clearly not confirming a trend change .
Many still bearish on HTFs (including ETH), I think the reason is because Bitcoin goes lower before we see a continued run and that will drag down alts with it. I think people holding alts here with hopes for new highs (in the near future) are about to have their hopes crushed, that also goes for people long crypto miners.
I don't think the real run starts until end of 2025 or 2026.
Time will tell.
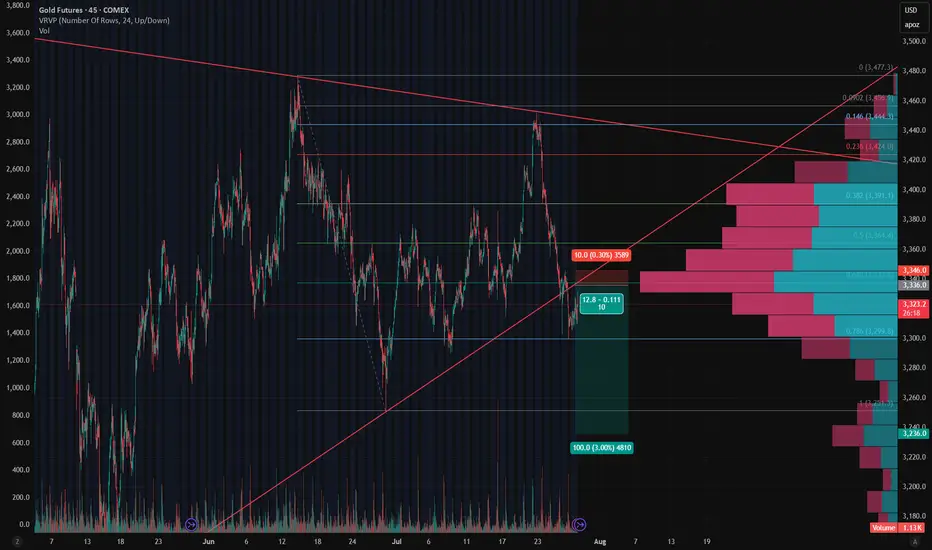
Gold - Short Setup Off Major Trendline Rejection📉 Gold - Short Setup Off Major Trendline Rejection
Gold has broken down through the rising trendline and is now retesting it — the moment of truth! 🧐
🔻 Short Entry: 3,336
🎯 Target: 3,236 (Fib 1.0 + HVN gap fill)
🛑 Stop: 3,346 (Above trendline retest)
⚖️ Risk/Reward: ~1:10
📊 Bonus: High volume node above adds resistance. Bearish volume profile structure confirms the breakdown bias.
Watching for volume to pick up on the move down. Let's see if GC bleeds into August. 🩸📆
XAGUSD | Silver Rebounds from 37.50 After 39.50 RejectionSilver pulled back sharply after failing at the 39.50 resistance zone. Price is currently consolidating just above the 37.50 support area, which has held firm on the initial retest.
Support at: 37.50 / 37.00 🔽
Resistance at: 39.50 🔼
🔎 Bias:
🔼 Bullish: A clean breakout above 39.50 could resume the uptrend.
🔽 Bearish: A break below 37.50 opens room toward 37.00 and 36.00.
📛 Disclaimer: This is not financial advice. Trade at your own risk.

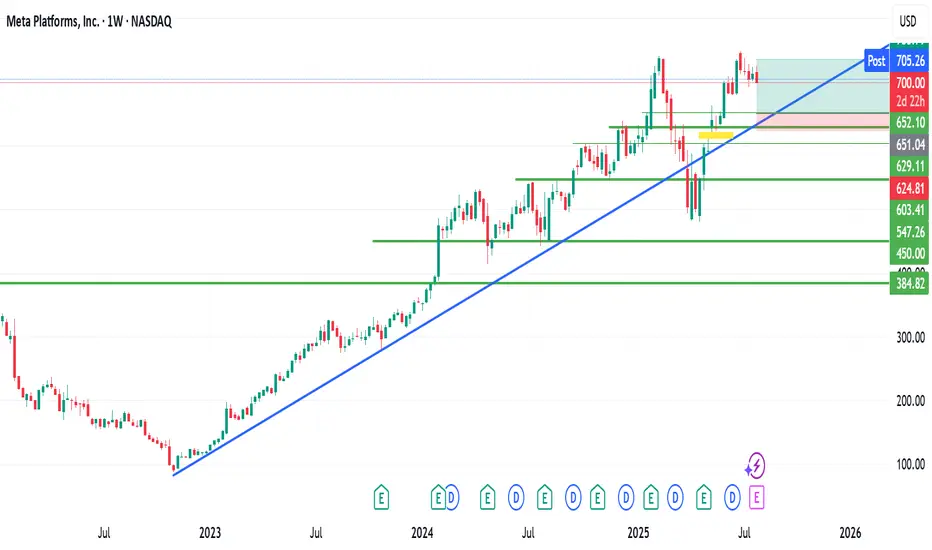
Is this possible with METAIs this possible with META?
META stock is currently trading at $700.
My technical view as shown on the chart, is looking at a possible retracement to around $650.
The question is ''Is this possible?
If it ever gets to this forecasted zone, I will accumulate massively.
Nikkei 225 Wave Analysis – 29 July 2025- Nikkei 225 reversed from the resistance zone
- Likely fall to support level 40000.00
Nikkei 225 index recently reversed from the resistance zone between the resistance levels 42000.00 (which started the sharp sell-off in 2024) and 41285.00.
This resistance zone was further strengthened by the upper daily and the weekly Bollinger Bands.
Given the strength of the aforementioned resistance zone and the overbought weekly Stochastic, Nikkei 225 index can be expected to fall to the next round support level 40000.00.

XAUUSD BUYS PROJECTION Hey everyone wow is been long since I posted here I can say for sure trading has never been so tougher for me cuz am tryna refine my edge and I miss posting and sharing my ideas here so this is my analysis on Gold after seeing Gold rejected a strong resistance zone and price keeps pushing down tho I missed the sells but market is always full of opportunity and here are my zones to take buys from,mind you these zone are very strong support zones that mostly buyers get in the market so I will be waiting for price to get to the first zone which is the green and the second is for scaling in after placing the first on breakeven and yes I will update you guys…..

NZDUSD to form a higher low?NZDUSD - 24h expiry
Pivot support is at 0.5935.
We expect a reversal in this move.
Risk/Reward would be poor to call a buy from current levels.
A move through 0.5975 will confirm the bullish momentum.
The measured move target is 0.6000.
We look to Buy at 0.5935 (stop at 0.5910)
Our profit targets will be 0.5985 and 0.6000
Resistance: 0.5975 / 0.5985 / 0.6000
Support: 0.5935 / 0.5925 / 0.5910
Risk Disclaimer
The trade ideas beyond this page are for informational purposes only and do not constitute investment advice or a solicitation to trade. This information is provided by Signal Centre, a third-party unaffiliated with OANDA, and is intended for general circulation only. OANDA does not guarantee the accuracy of this information and assumes no responsibilities for the information provided by the third party. The information does not take into account the specific investment objectives, financial situation, or particular needs of any particular person. You should take into account your specific investment objectives, financial situation, and particular needs before making a commitment to trade, including seeking, under a separate engagement, as you deem fit.
You accept that you assume all risks in independently viewing the contents and selecting a chosen strategy.
Where the research is distributed in Singapore to a person who is not an Accredited Investor, Expert Investor or an Institutional Investor, Oanda Asia Pacific Pte Ltd (“OAP“) accepts legal responsibility for the contents of the report to such persons only to the extent required by law. Singapore customers should contact OAP at 6579 8289 for matters arising from, or in connection with, the information/research distributed.

AMD: Potential Mid-Term Reversal from Macro SupportPrice has reached ideal macro support zone: 90-70 within proper proportion and structure for at least a first wave correction to be finished.
Weekly
As long as price is holding above this week lows, odds to me are moving towards continuation of the uptrend in coming weeks (and even years).
1h timeframe:
Thank you for attention and best of luck to your trading!

PEPE/ETH Weekly longPEPE against ETH is nearing a nice support level,
I will buy PEPE here and sell it at the tops against ETH to gain more ETH

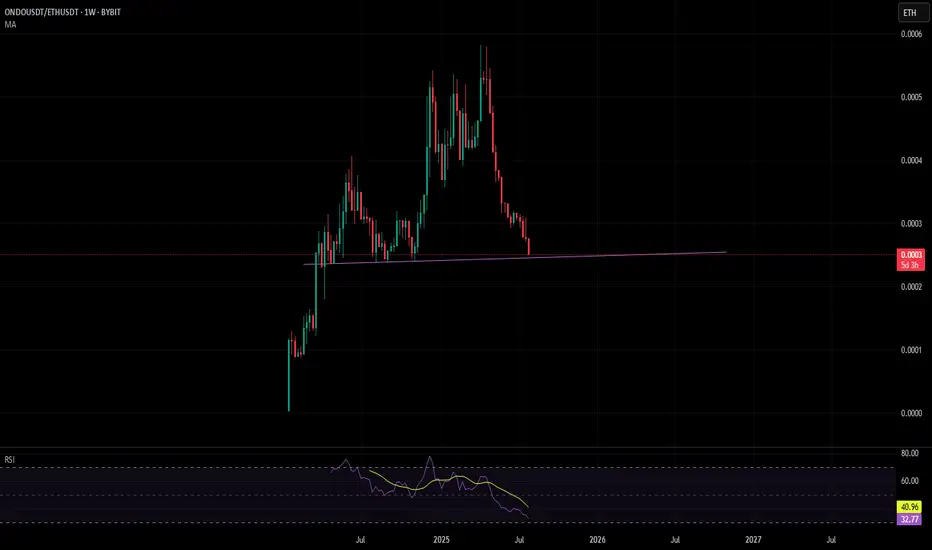
ONDOETH WeeklyOndo-ETH is nearing a nice clean support level.
I will buy ondo here and sell it at the top against ETH
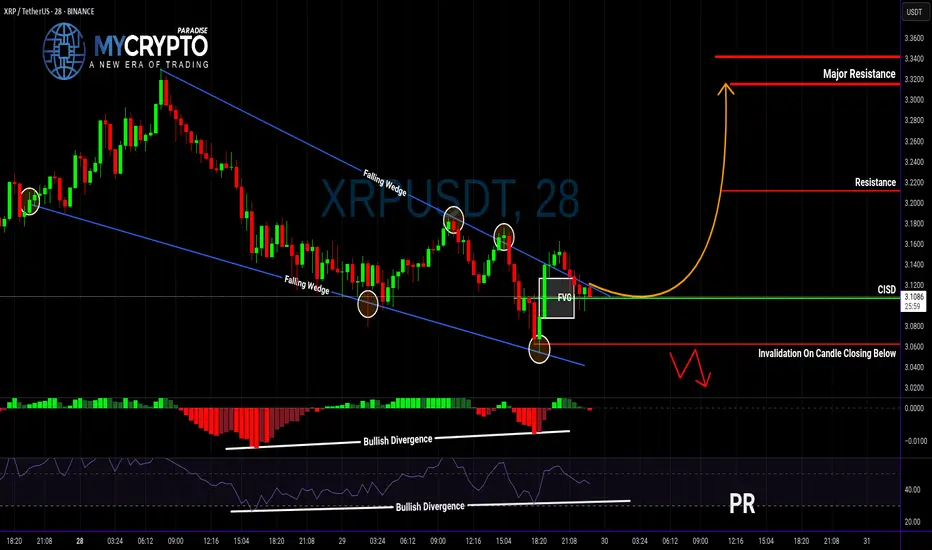
XRP Breakout Could Be a Trap… Or the Start of Something Big?Yello, Paradisers — are you about to buy into a fake breakout or position yourself right before a major move? Let’s break it down before emotions take over.
💎XRPUSDT has officially broken out of a falling wedge — a classic bullish reversal structure. What makes this breakout even more interesting is that it's supported by bullish divergence on both MACD and RSI, plus a Change In State of Delivery (CISD). All these technical signals combined significantly increase the probability of a bullish continuation.
💎Now, if you’re a disciplined trader looking for a safer entry with a higher risk-to-reward ratio, the smart move is to wait for a potential pullback to the CISD level. That would set up an opportunity offering a risk-to-reward of over 1:2.55 — not something you want to ignore.
💎But don’t get too comfortable…
💎If the price breaks down and closes below our invalidation level, the entire bullish idea is off the table. In that case, it’s wiser to stay patient and wait for clearer price action to develop. No emotional entries — only strategic moves.
🎖Strive for consistency, not quick profits. Treat the market as a businessman, not as a gambler. That’s how you’ll get inside the winner circle.
MyCryptoParadise
iFeel the success🌴