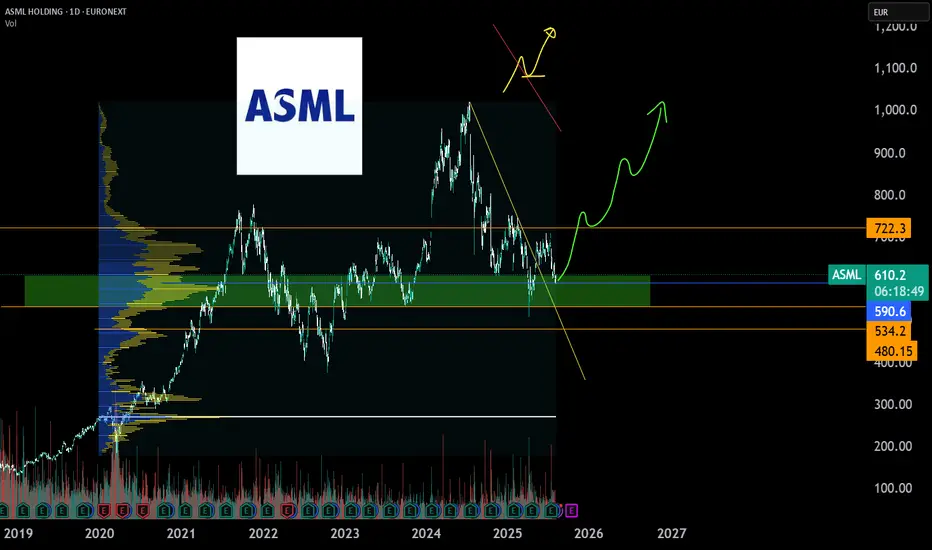
ASML enters buy zone and will posibly rotate to uptrend again.ASML is lagging behind after stagnated growth and a weak order intake due to china chip machine restrictions and uncertaincy about chip machine import tarrifs. It looks like tarrifs on chip machinery is settled and companies will likely place orders again after internal investment approvals.
Earnings of alphabet, microsoft, meta and amazon have confirmed stronger growth in AI datacenter chips than expected and more demand than production, therefore more ASML EUV machines are neceserry to fullfill production needs.
The chart analysis is in the lower range and lower P/E ~26 zone, very cheap for this company which is the monopolist in the EUV machines and therefore undervalued based on history.
Support and Resistance
OMNI : Will it happen again?Hello friends🙌
✅As you can see, everything is clearly and explicitly drawn for you.
✅Just pay attention to risk and capital management for trading and if you like, support us.
🔥Follow us for more signals🔥
*Trade safely with us*

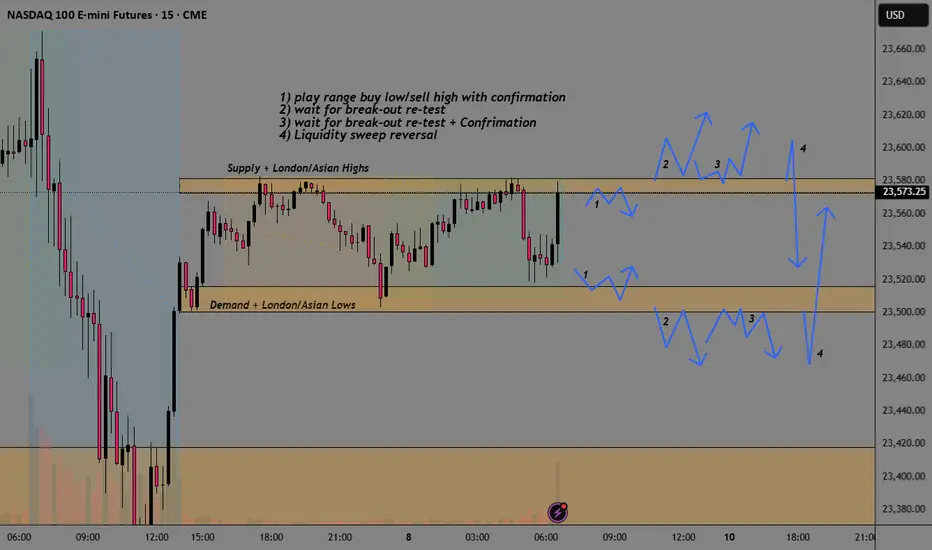
NQ Break-Out AnalysisSee chart from analysis of different options depending on the type of trader and what others are looking at.
1) play range buy low/sell high with confirmation
2) wait for break-out re-test
3) wait for break-out re-test + Confirmation
4) Liquidity sweep reversal
USDT DOMINANCE New Update (4H)First of all you should know that "USDT Dominance" is always moving inverse of BTCUSDT
We have a key level on the chart that This key level has been lost, and there hasn't been a pullback to it yet. It seems that the candles intend to make a pullback to this level. Upon this pullback, we expect a rejection to the downside.
Let's see what happens.
For risk management, please don't forget stop loss and capital management
Comment if you have any questions
Thank You

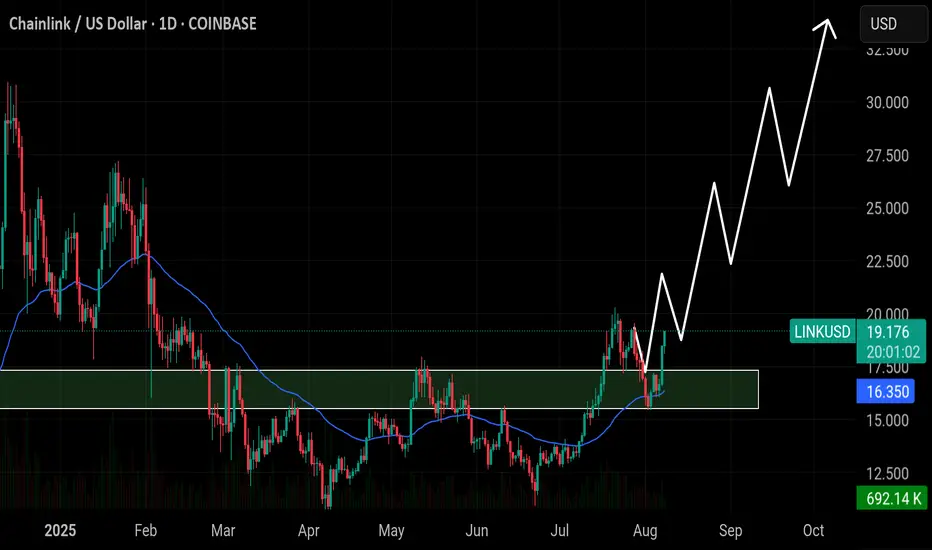
$LINK has retested the $15.80 breakout zone and bounced stronglyBIST:LINK has retested the $15.80 breakout zone and bounced strongly. Price is now gaining momentum and holding above the 50EMA. As long as this zone holds, LINK is likely to push toward $24, $28, and $32 in the coming weeks. A break below $15.0 would invalidate this bullish setup.
XAUUSD Wave iv Pullback Buy Plan – Targeting Wave v BreakoutBias
Primary Trend: Bullish – likely in Wave iii of a larger Wave (III).
Current pullback appears to be a minor Wave iv correction inside Wave iii, offering potential re-entry zones before pushing to Wave v and then larger Wave (III) completion.
Buy Limit / Long Entry: Around 3,380 – 3,384
Just above LR / MD zone and trendline support.
Aligns with Elliott Wave structure for a Wave v continuation.

Chainlink Wave Analysis – 7 August 2025- Chainlink reversed from the support area
- Likely to rise to resistance level 19.55
Chainlink cryptocurrency recently reversed from the support area between the support level 15.00 (former resistance from June), lower daily Bollinger Band and the 50% Fibonacci correction of the upward impulse i from June.
The upward reversal from this support area stopped the previous short-term ABC correction ii from last month.
Given the strongly bullish sentiment seen across the cryptocurrency markets, Chainlink cryptocurrency can be expected to rise to the next resistance level 19.55.

600% falling wedge extension for VARA Network?On the above 4 day chart price action has corrected 90%. A number of reasons now exist for long entries, they include:
1) Price action and RSI resistance breakouts.
2) Support and resistance. Past resistance confirms support.
3) Point no. 2 confirms a “double bottom” in price action.
4) Notice the 4 day hammer candle?
5) The falling wedge confirmation forecasts a 600% move in price action.
Is it possible sellers keep selling? Sure, I hear their supplies are endless.
Is it probable? No.
Ww
Type: trade
Risk: small, tiny market cap.
Timeframe for long: Now
Return: 600%

FTNT eyes on $70-72: Fib supports hope to hold earnings DUMPFTNT earnings report has apparently disappointed.
The crash finally stopped at support zone $70.69-72.09
Looking for accumulation here and climb back up soon.

Gold Spot (XAU/USD) Analysis – 30-Minute TimeframeGold Spot (XAU/USD) Analysis – 30-Minute Timeframe
At present, the price is fluctuating within a range between a key support zone and a key resistance zone. The overall market structure has taken on a ranging pattern, and traders are waiting for a breakout from either side.
🔹 Bullish Scenario: A breakout and consolidation above the current resistance could lead to a move toward higher resistance levels and eventually the main supply zone.
🔹 Bearish Scenario: A breakout and consolidation below the mid-range support could trigger a decline toward lower support levels and even a retest of recent lows.
Given the current situation, the price reaction to these zones will likely determine the next market direction.

LULU - Updated analysis and what to look out forWe have a pretty clear HTF zone to look out for below - $130-$160 - in which we will need to see how price holds up. I cannot imagine a drop below there - that would make this completely undervalued - and I will be looking for long trades when we arrive there and see the LTF algorithms playing out.
Until then,
Happy Trading :)

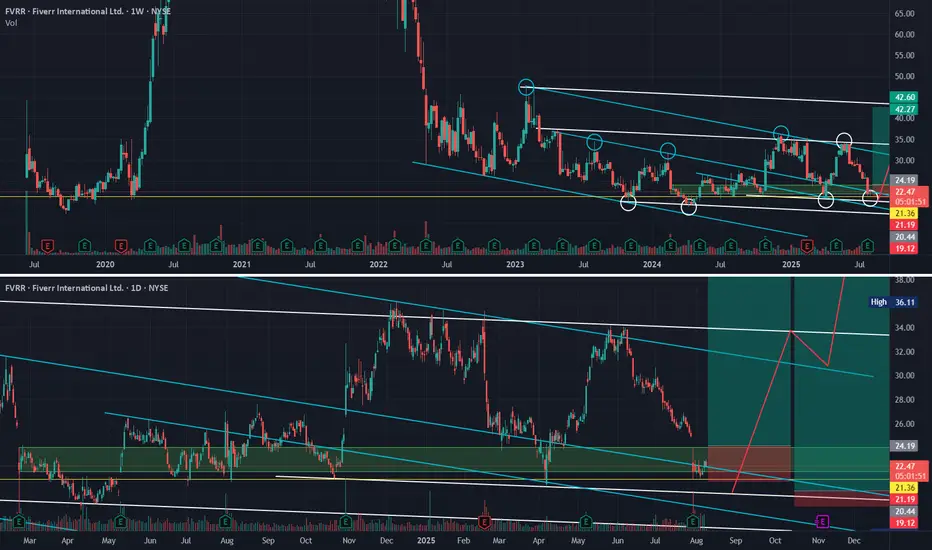
The stock that keeps on disappointing - Where & why I'm bullishFVRR. We all know the company. Many of us have probably waited patiently for a covid-like resemblance of the stock price. And yet here we are, sitting at $22, wondering if we'll ever reach $40 again.
I'm here to tell you, aside from the company being fundamentally strong and proving that with earnings and revenue growth YOY, the algorithms have got your back technically as well!
The overall reason I am technically bullish on this company and have been since April 2024 is the white algorithm as outlined by the white circles in the weekly chart above. Notice any time we are selling down and respecting teal/blue on the buy-side (blue circles), we hold and respect white taper (white circles) on the sell-side and allow for price to make it's way up back toward teal.
Once we prove the white algorithm on the buy-side as well, we will break out of this LTF consolidation and head toward HTF algorithms.
I want to prime you for three possible scenarios:
#1.
We are holding a very strong multi-year demand zone (green box). If we continue to hold this and close back above, as with every other time, it is a strong buy signal.
#2.
We are holding above a multi-year support zone at $21.70 (yellow line). This has held us (save for one or two liquidity grabs) since the company's IPO. Another attempt at this level will be a no-brainer scoop-up as far as R:R is concerned.
#3.
My prediction (and hope) is that we are trying, once again, to prove this white tapered algorithm on the sell-side. If we do that, we give price the ability/permission to break out of teal once and for all and head toward the fair-value pricing of this company (according to all the analysts - not me) in the $40+ range.
This is another one that may require a bit of patience to get the best case scenario - allowing for a push lower toward our HTF white algorithm.
In any case, I am still bullish on this chart - even with all the selling pressure and sideways movement.
Happy Trading :)
Ethereum breakoutEthereum monthly chart shows a clear breakout above the 3800 resistance, targeting 8k.

XAUUSD POSSIBLE DROP IN PRICEGold is reacting at the 3400 psychological level. I anticipate a drop in price from that level coupled with the recent tariff that trump imposed on gold bar. A sell opportunity is envisaged from the current market price


Nifty levels - Aug 11, 2025Nifty support and resistance levels are valuable tools for making informed trading decisions, specifically when combined with the analysis of 5-minute timeframe candlesticks and VWAP. By closely monitoring these levels and observing the price movements within this timeframe, traders can enhance the accuracy of their entry and exit points. It is important to bear in mind that support and resistance levels are not fixed, and they can change over time as market conditions evolve.
The dashed lines on the chart indicate the reaction levels, serving as additional points of significance to consider. Furthermore, take note of the response at the levels of the High, Low, and Close values from the day prior.
We hope you find this information beneficial in your trading endeavors.
* If you found the idea appealing, kindly tap the Boost icon located below the chart. We encourage you to share your thoughts and comments regarding it.
Wishing you success in your trading activities!

BankNifty levels - Aug 11, 2025Utilizing the support and resistance levels of BankNifty, along with the 5-minute timeframe candlesticks and VWAP, can enhance the precision of trade entries and exits on or near these levels. It is crucial to recognize that these levels are not static, and they undergo alterations as market dynamics evolve.
The dashed lines on the chart indicate the reaction levels, serving as additional points of significance. Furthermore, take note of the response at the levels of the High, Low, and Close values from the day prior.
We trust that this information proves valuable to you.
* If you found the idea appealing, kindly tap the Boost icon located below the chart. We encourage you to share your thoughts and comments regarding it.
Wishing you successful trading endeavors!

Gold is aiming at 3,440.00.Gold is aiming at 3,440.00.
Gold’s upward trend is poised to continue, driven by potential Federal Reserve rate cuts, ongoing central bank purchases, and increased ETF investments. Markets are betting on a 93% chance of a rate cut at the Fed’s next meeting. Central banks added 166 tons to global gold reserves in Q2, according to the World Gold Council, while gold-backed ETFs experienced robust inflows during the same period.
XAUUSD has been trading bullish during August 7 trading session. Уven the geopolitical relief did not prevent gold from continuing its upward path. On August 7 the price has successfully retested the 3,380.00 support and is currently heading towards the level of 3,440.00.

CADCHF LONGCADCHF will moves UP.
because chf will decresing. the abc pattern in the chart.
I think USDCHF is Long too.

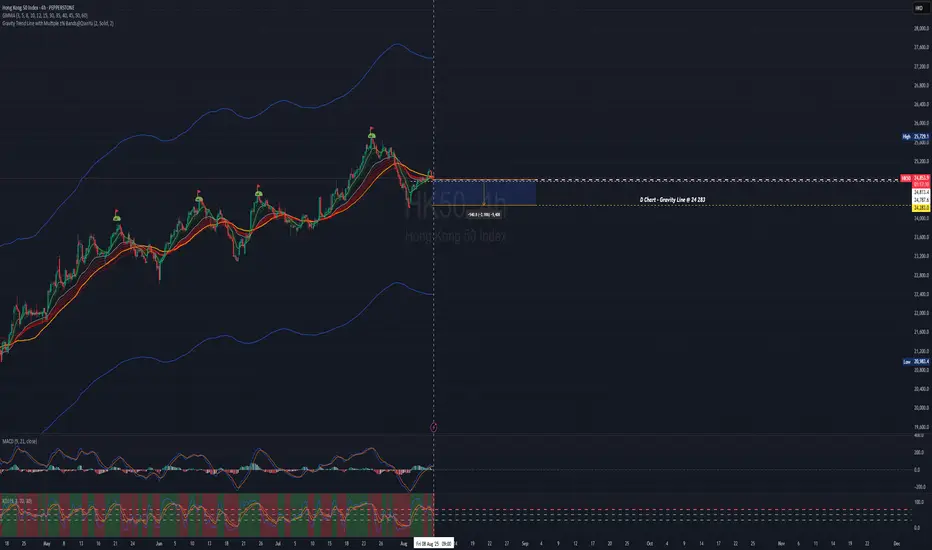
The Index is at plank mode, be patient then take position.Hello everyone!
From previous update, HSI uptrend mode is still on track.
Previous POV: Deep retracement had happened. From 25,419 retraced to 24250 (circa 3.23% , 812pts). Check the previous post.
For this week and upcoming; looking at shorter time frame for Long entry.
For intraday, swing trade - look out for entry for swing (using shorter tf to entry), you may use Fibo and other indicator whichever you feel comfortable and confident.
At point of writing ✍️: the HK50 $PEPPERSTONE 4H chart is undecisive.
For aggressive entry, you may take Long position and set SL.
Otherwise you may wait for confirmation (depends on your time frame of trade).
currently on D Chart -
🗝️ Resistance Level : 25060 (the recent Hi)
Support Level : 24,787
Support level 24,612 (EMA30)
🗝️ Strong Support Level : 24,283 (from 24048@30Jul25, Gravity Trend Line)
Macroview - Hong Kong Markets continue to be Bullish.
Higher Hi⛳ marked in D Chart HK50 $PEPPERSTONE
21May2025 -23909
11June2025 -24430
25June2025 -24531
16Jul2025 - 24842
24Jul2025 - 25729
?? ??2025 - 26713 Next Hi
Notice the trend, after the ⛳ , retraced back to Gravity Trend Line area, GMMA squeezing before it spreading out again for bullish trend.
Nothing complicated. Pay attention, set up your SOP. Take your position, setting stop loss and ride on the trend.
This applicable to Long and Short position.
The HSI Index
At point of writing ✍️ Index is being sucked towards to D GravityLine - 24344; it reversed to bullish on 5Aug25.
🗝️ Next Resistance Level : 25115
🗝️ Next Support Level : 24826
🗝️ Strong Support Level : 24700 (EMA30)
Let's follow your own zentradingstrategy , continue to trade;
When in doubt, sit. Not every candle needs a response.
— Sometimes, the wisest action is non-action.
Be ease at trading!
** Please Boost 🚀, FOLLOW ✅, SHARE 🙌 and COMMENT ✍ if you enjoy this idea!
Share your trading journey here to encourage the community and friends who pursing the same journey.
This is for educational and reference purposes only. It does not constitute financial advice or a recommendation to buy or sell any financial instrument. Always perform your own due diligence and consult a licensed financial advisor before making investment
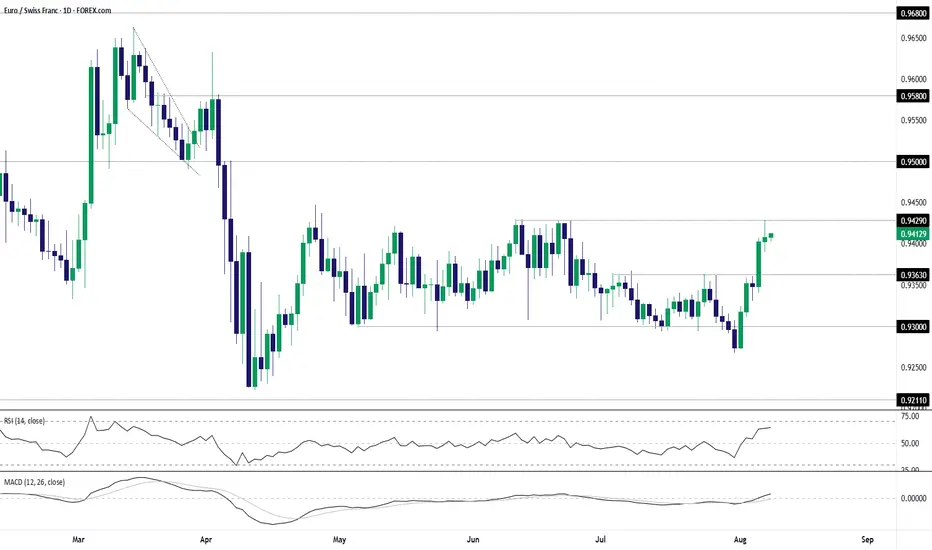
EUR/CHF Bulls Test Range Highs Following Sharp ReboundEUR/CHF sits just beneath the top of the range it’s been trading in over the past three months, providing a variety of potential setups depending on how the near-term price action evolves.
The bullish engulfing candle on the daily chart last Friday set the tone for the price action seen this week, sparking a significant bullish reversal after a false break of .9300 support. The subsequent move saw the price take out resistance at .9363 before stalling at .9429—a level that capped the pair in June.
Given recent price action, traders should be on alert for a potential extension of the bullish move.
Should we see a break and close above .9429, it would allow for longs to be established with a stop beneath for protection, targeting resistance at .9500. Offers may be encountered just beneath .9450, presenting a potential hurdle for bulls along the way.
Alternatively, if the pair cannot break .9429 meaningfully, the setup could be flipped with shorts established beneath the level with a stop above for protection. Potential targets include .9363 or .9300.
Momentum indicators have skewed bullish over the past week, with RSI (14) trending higher but not yet overbought, while MACD has crossed the signal line and now sits in positive territory. It’s not a roaring endorsement for a bullish bias, but it does favour upside rather than downside in the near term.
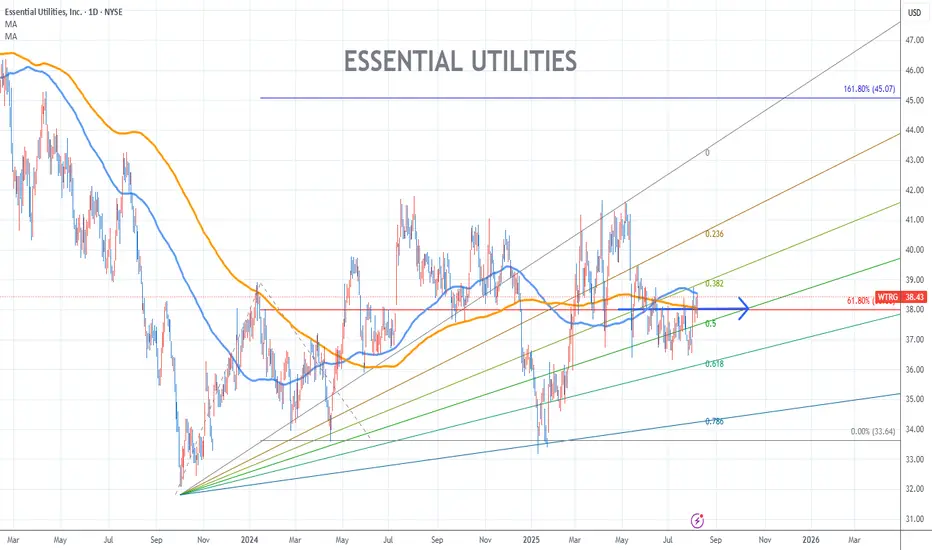
Essential Utilities Stock Chart Fibonacci Analysis 080725Trading Idea
1) Find a FIBO slingshot
2) Check FIBO 61.80% level
3) Entry Point > 38/61.80%
Chart time frame:B
A) 15 min(1W-3M)
B) 1 hr(3M-6M)
C) 4 hr(6M-1year)
D) 1 day(1-3years)
Stock progress:A
A) Keep rising over 61.80% resistance
B) 61.80% resistance
C) 61.80% support
D) Hit the bottom
E) Hit the top
Stocks rise as they rise from support and fall from resistance. Our goal is to find a low support point and enter. It can be referred to as buying at the pullback point. The pullback point can be found with a Fibonacci extension of 61.80%. This is a step to find entry level. 1) Find a triangle (Fibonacci Speed Fan Line) that connects the high (resistance) and low (support) points of the stock in progress, where it is continuously expressed as a Slingshot, 2) and create a Fibonacci extension level for the first rising wave from the start point of slingshot pattern.
When the current price goes over 61.80% level , that can be a good entry point, especially if the SMA 100 and 200 curves are gathered together at 61.80%, it is a very good entry point.
As a great help, tradingview provides these Fibonacci speed fan lines and extension levels with ease. So if you use the Fibonacci fan line, the extension level, and the SMA 100/200 curve well, you can find an entry point for the stock market. At least you have to enter at this low point to avoid trading failure, and if you are skilled at entering this low point, with fibonacci6180 technique, your reading skill to chart will be greatly improved.
If you want to do day trading, please set the time frame to 5 minutes or 15 minutes, and you will see many of the low point of rising stocks.
If want to prefer long term range trading, you can set the time frame to 1 hr or 1 day.
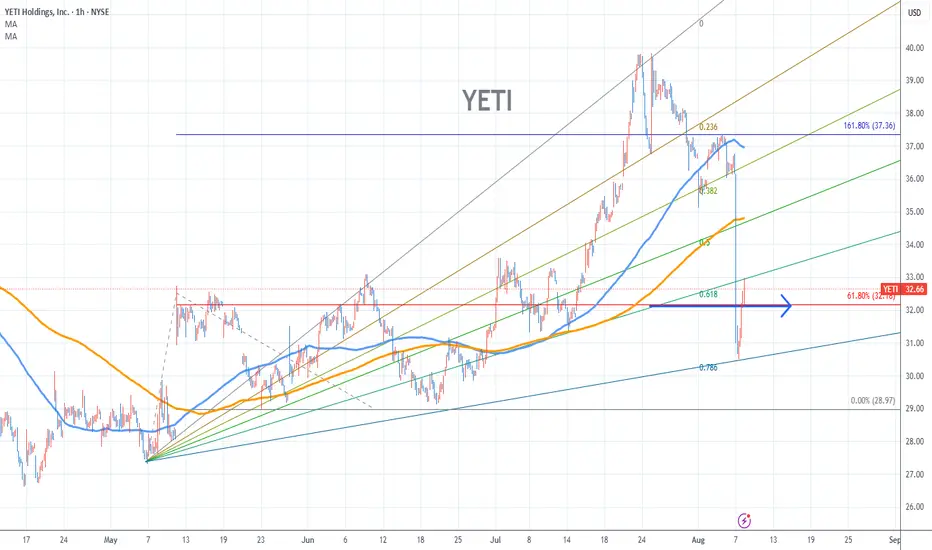
Yeti Stock Chart Fibonacci Analysis 080725Trading Idea
1) Find a FIBO slingshot
2) Check FIBO 61.80% level
3) Entry Point > 32/61.80%
Chart time frame:B
A) 15 min(1W-3M)
B) 1 hr(3M-6M)
C) 4 hr(6M-1year)
D) 1 day(1-3years)
Stock progress:C
A) Keep rising over 61.80% resistance
B) 61.80% resistance
C) 61.80% support
D) Hit the bottom
E) Hit the top
Stocks rise as they rise from support and fall from resistance. Our goal is to find a low support point and enter. It can be referred to as buying at the pullback point. The pullback point can be found with a Fibonacci extension of 61.80%. This is a step to find entry level. 1) Find a triangle (Fibonacci Speed Fan Line) that connects the high (resistance) and low (support) points of the stock in progress, where it is continuously expressed as a Slingshot, 2) and create a Fibonacci extension level for the first rising wave from the start point of slingshot pattern.
When the current price goes over 61.80% level , that can be a good entry point, especially if the SMA 100 and 200 curves are gathered together at 61.80%, it is a very good entry point.
As a great help, tradingview provides these Fibonacci speed fan lines and extension levels with ease. So if you use the Fibonacci fan line, the extension level, and the SMA 100/200 curve well, you can find an entry point for the stock market. At least you have to enter at this low point to avoid trading failure, and if you are skilled at entering this low point, with fibonacci6180 technique, your reading skill to chart will be greatly improved.
If you want to do day trading, please set the time frame to 5 minutes or 15 minutes, and you will see many of the low point of rising stocks.
If want to prefer long term range trading, you can set the time frame to 1 hr or 1 day.