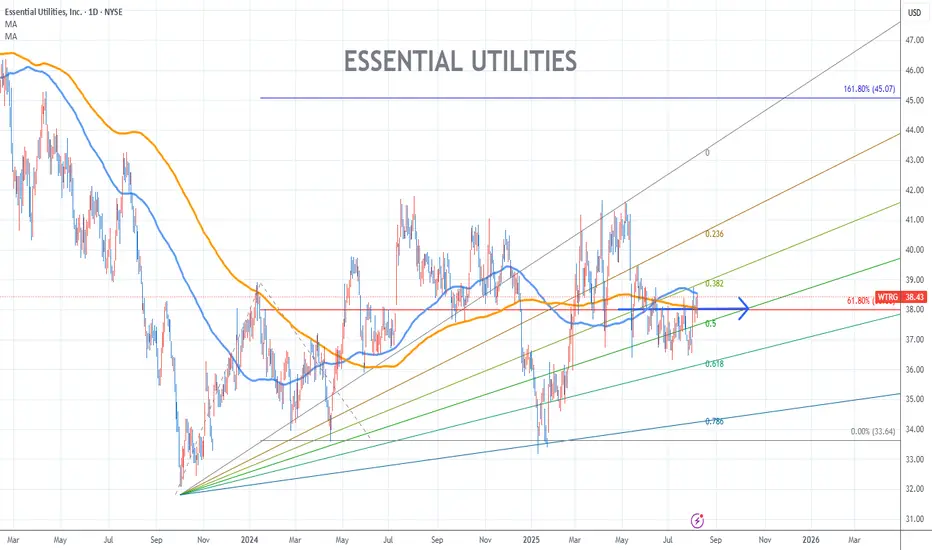
Essential Utilities Stock Chart Fibonacci Analysis 080725Trading Idea
1) Find a FIBO slingshot
2) Check FIBO 61.80% level
3) Entry Point > 38/61.80%
Chart time frame:B
A) 15 min(1W-3M)
B) 1 hr(3M-6M)
C) 4 hr(6M-1year)
D) 1 day(1-3years)
Stock progress:A
A) Keep rising over 61.80% resistance
B) 61.80% resistance
C) 61.80% support
D) Hit the bottom
E) Hit the top
Stocks rise as they rise from support and fall from resistance. Our goal is to find a low support point and enter. It can be referred to as buying at the pullback point. The pullback point can be found with a Fibonacci extension of 61.80%. This is a step to find entry level. 1) Find a triangle (Fibonacci Speed Fan Line) that connects the high (resistance) and low (support) points of the stock in progress, where it is continuously expressed as a Slingshot, 2) and create a Fibonacci extension level for the first rising wave from the start point of slingshot pattern.
When the current price goes over 61.80% level , that can be a good entry point, especially if the SMA 100 and 200 curves are gathered together at 61.80%, it is a very good entry point.
As a great help, tradingview provides these Fibonacci speed fan lines and extension levels with ease. So if you use the Fibonacci fan line, the extension level, and the SMA 100/200 curve well, you can find an entry point for the stock market. At least you have to enter at this low point to avoid trading failure, and if you are skilled at entering this low point, with fibonacci6180 technique, your reading skill to chart will be greatly improved.
If you want to do day trading, please set the time frame to 5 minutes or 15 minutes, and you will see many of the low point of rising stocks.
If want to prefer long term range trading, you can set the time frame to 1 hr or 1 day.
Support and Resistance
NZDUSD Wave Analysis – 7 August 2025- NZDUSD reversed from the support area
- Likely to test resistance level 0.6050
NZDUSD currency pair recently reversed from the support area between the strong support level of 0.5880 (which has been reversing the price from May) and the lower daily Bollinger Band.
The upward reversal from this support area created a clear daily Japanese candlestick reversal pattern, the Hammer, which initiated active correction ii.
Given the strongly bearish US dollar sentiment seen today, NZDUSD currency pair can be expected to rise to the next resistance level 0.6050 (top of wave 2 from July).

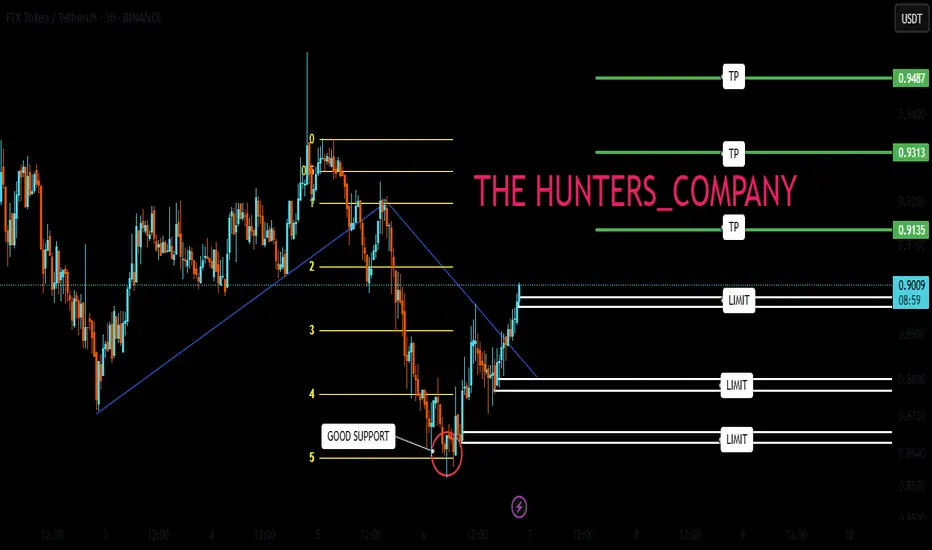
FTT : Go to work, it's goodHello friends🙌
✅after the decline we had, you can see that the price was supported by buyers in the support area we identified with Fibonacci and broke its resistance.
✅Now you can buy in the support areas we have identified for you with risk and capital management and move towards the set goals.
🔥Follow us for more signals🔥
*Trade safely with us*
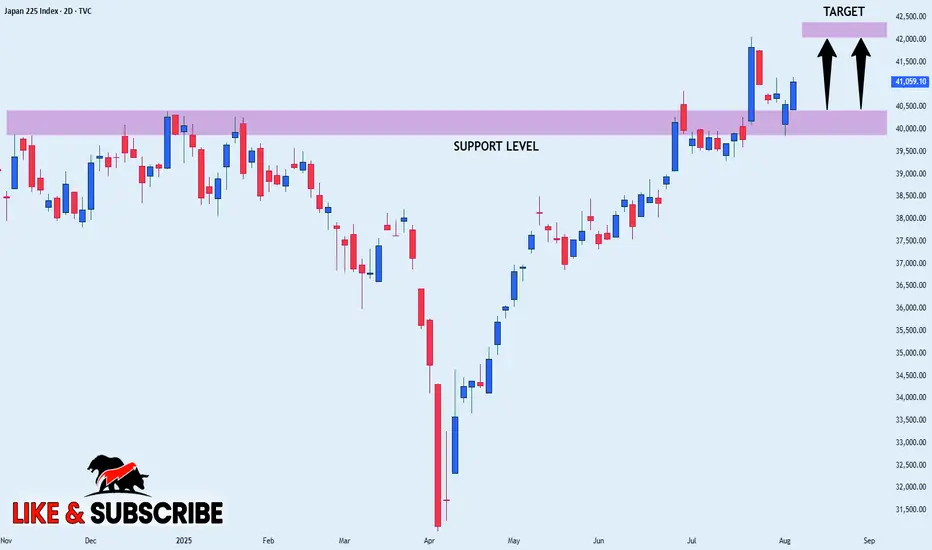
NIKKEI WILL KEEP GROWING|LONG|
✅NIKKEI is trading in an uptrend
And the index was making a bearish correction
But it has now retested a horizontal support level of 40,500
From where we are already seeing a bullish
Reaction and I am expecting the index to go further up
LONG🚀
✅Like and subscribe to never miss a new idea!✅
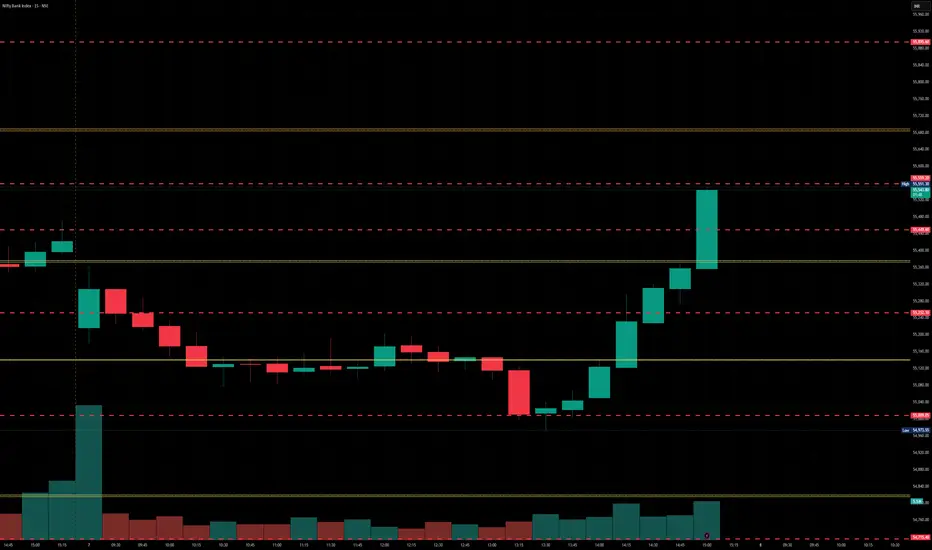
BanknIfty levels - Aug 08, 2025Utilizing the support and resistance levels of BankNifty, along with the 5-minute timeframe candlesticks and VWAP, can enhance the precision of trade entries and exits on or near these levels. It is crucial to recognize that these levels are not static, and they undergo alterations as market dynamics evolve.
The dashed lines on the chart indicate the reaction levels, serving as additional points of significance. Furthermore, take note of the response at the levels of the High, Low, and Close values from the day prior.
We trust that this information proves valuable to you.
* If you found the idea appealing, kindly tap the Boost icon located below the chart. We encourage you to share your thoughts and comments regarding it.
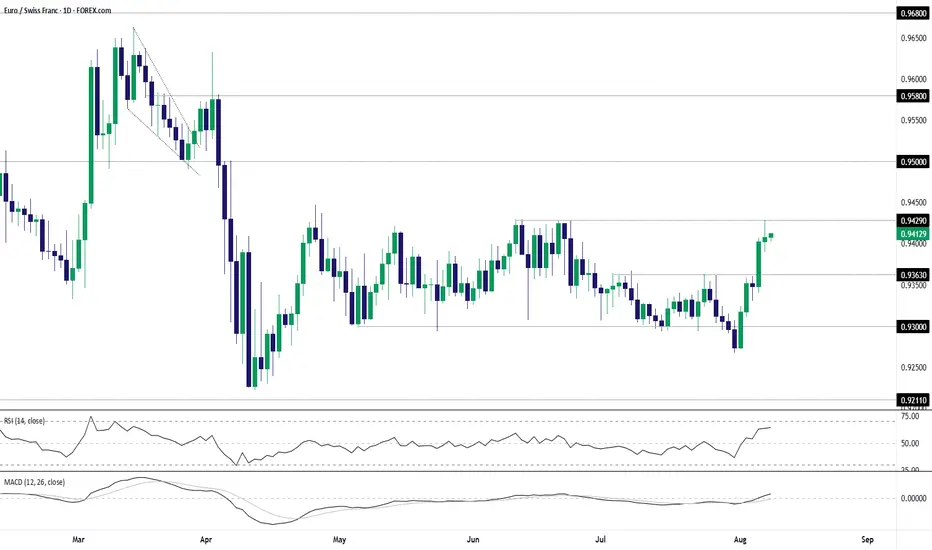
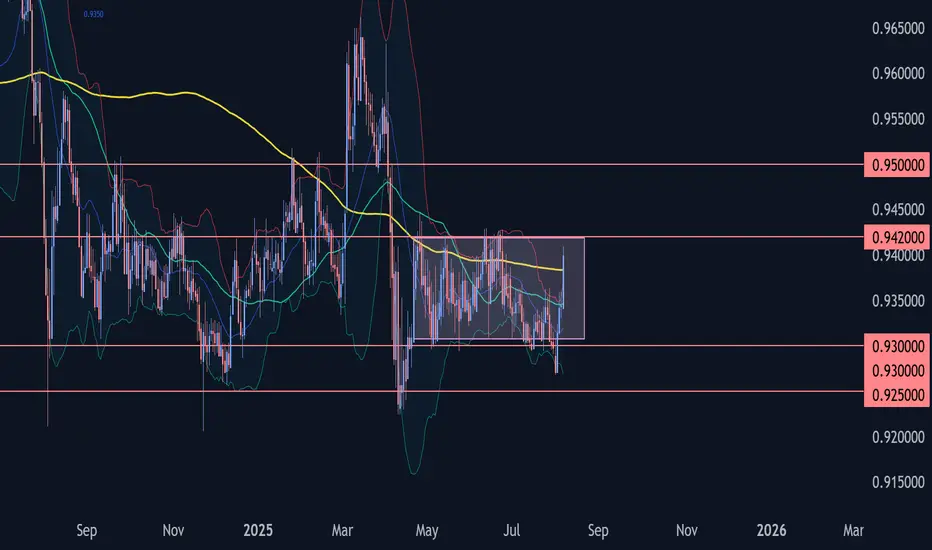
EUR/CHF Bulls Test Range Highs Following Sharp ReboundEUR/CHF sits just beneath the top of the range it’s been trading in over the past three months, providing a variety of potential setups depending on how the near-term price action evolves.
The bullish engulfing candle on the daily chart last Friday set the tone for the price action seen this week, sparking a significant bullish reversal after a false break of .9300 support. The subsequent move saw the price take out resistance at .9363 before stalling at .9429—a level that capped the pair in June.
Given recent price action, traders should be on alert for a potential extension of the bullish move.
Should we see a break and close above .9429, it would allow for longs to be established with a stop beneath for protection, targeting resistance at .9500. Offers may be encountered just beneath .9450, presenting a potential hurdle for bulls along the way.
Alternatively, if the pair cannot break .9429 meaningfully, the setup could be flipped with shorts established beneath the level with a stop above for protection. Potential targets include .9363 or .9300.
Momentum indicators have skewed bullish over the past week, with RSI (14) trending higher but not yet overbought, while MACD has crossed the signal line and now sits in positive territory. It’s not a roaring endorsement for a bullish bias, but it does favour upside rather than downside in the near term.
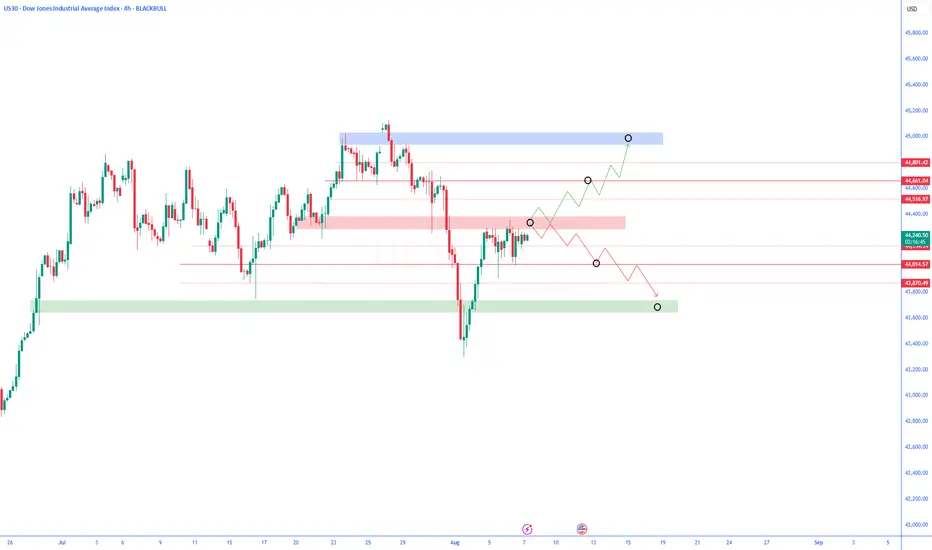
4H Analysis of Dow Jones | Selling Pressure Below Key Resistance4H Analysis of Dow Jones
🔸 Price is currently trading below a key resistance level and has yet to break above it.
🔻 If weakness persists, a bearish reversal toward lower support levels is likely.
🔹 A confirmed breakout above the resistance could open the path for further upside.
✅ Price reaction to this resistance will determine the next market direction.
AUDJPY Potential UpsidesHey Traders, in the coming week we are monitoring AUDJPY for a buying opportunity around 94.900 zone, AUDJPY is trading in an uptrend and currently is in a correction phase in which it is approaching the trend at 94.900 support and resistance area.
Trade safe, Joe.

Bitcoin inverted HEAD & SHOULDERSIf this is an inverted HEAD & shoulders pattern for bitcoin, then the neckline is already broken and bitcoin is Back testing that now, well the target is $160k as well

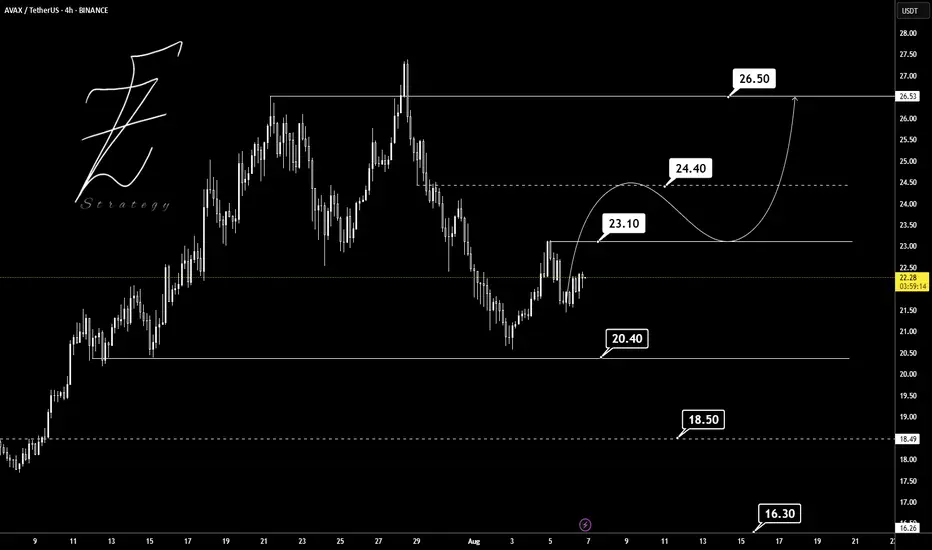
AVAXUSDT The overall trend of BINANCE:AVAXUSDT on the 4H timeframe shows signs of a potential bullish reversal, as a higher low has formed around the 20.40 support level after a strong downtrend. Currently, the price is ranging between the key support at 20.40 and the resistance at 23.10. A breakout above 23.10 could push the price toward the next major resistance at 24.40, which is a critical decision zone for the market. If buyers maintain momentum and break above 24.40, the next bullish target will be around 26.50 ✅ However, if the 20.40 support fails to hold, lower supports at 18.50 and 16.30 may come into play. The momentum currently leans slightly bullish, but price behavior between 23.10 and 24.40 will determine the next strong move. 📊
Key Support & Resistance Levels:
Supports: 20.40 – 18.50 – 16.30
Resistances: 23.10 – 24.40 – 26.50
Always remember to manage and control your risk properly. 🔒
Could Oil (WTI) Be Breaking Out of its Range?Oil (WTI) has moved back to the forefront of traders thinking this week after OPEC+’s weekend decision to raise September production by circa 550k barrels per day. They also put traders on notice that all options remain open regarding further production increases to replace another output layer, amounting to 1.66 million barrels per day that has been offline since 2023. A decision on what comes next is due to take place at a meeting scheduled for September 7th.
Perhaps unsurprisingly, this potential for extra production (supply) being unleashed into the market later in the year has led to some downside pressure for Oil this week. This is because it comes at a time of uncertainty surrounding Oil demand due to possible weaknesses in the global economy, created by President Trump’s tariff policies. Oil (WTI) prices have fallen 4.8% from opening levels on Monday to post a new 1 month low at 64.20 yesterday, a level that it currently holding (more on this in technical update below).
Looking forward, one of the challenges traders are facing for where Oil moves next is President Trump’s August 8th deadline for Russia to end the war with Ukraine or face fresh sanctions on its energy exports. President Trump has also suggested he would increase tariffs on countries buying Oil from Russia, including China, although right now India is his initial focal point in this regard and yesterday, he doubled tariffs on Indian goods (25% to 50%) due to the country’s purchases of Russian Oil. These new tariffs are due to start in 3 weeks’ time.
With so much uncertainty surrounding Oil prices, including reports of a possible meeting between President Trump and President Putin being scheduled at some stage next week, it could be useful to be prepared for a potential increase in Oil (WTI) price volatility.
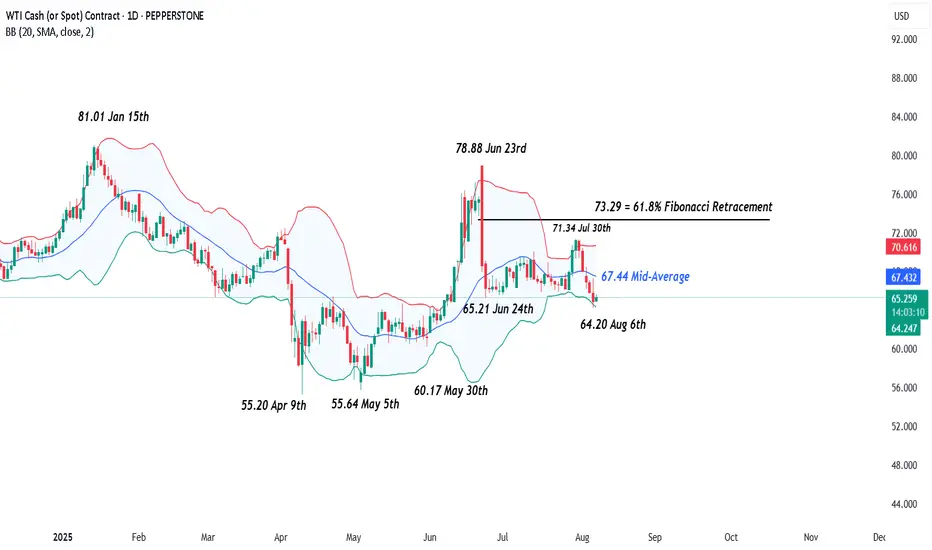
Technical Update: New Correction Lows Posted
Having seen the sharp sell-off in Oil between June 23rd and 24th 2025, a period of more balanced activity developed, as a reaction to over-extended downside conditions in price.
As the chart above shows, this resulted in a phase of sideways price activity between support marked by the 65.21 June 24th low, up to 71.34, which is equal to the July 30th failure high. However, price declines on Wednesday this week, have produced closes below 65.21, in the process of posting a new correction low at 64.20.
While communications between the US and Russia regarding the war in Ukraine are on-going, this type of break lower in the Oil price is no guarantee of future declines, so it could be helpful to assess what could be the potential support and resistance levels to focus on, just in case the outcome of these events lead to an increase in Oil price volatility.
Possible Next Support Levels:
As we have said above, the August 6th price weakness has seen a new correction low posted at 64.20, and this may now be viewed as the first support focus. Closes below 64.20 might then lead to a more extended decline in price.
Such moves would indicate the potential of further price weakness, with the next support possibly marked by the May 30th session low at 60.17, perhaps further towards 55.64 (May 5th low), if this level in turn gives way.
Potential Resistance Levels:
On the topside, within a period of price weakness, it can be the declining Bollinger mid-average that reflects the first possible resistance, and for Oil this currently stands at 67.44. Closing breaks above 67.44, if seen, could prompt further attempts to develop price strength to test higher resistance levels.
The first possible level would appear to be marked by 71.34, which is the July 30th session high. If this level was broken on a closing basis, it might then lead to tests of 73.29, which is equal to the 61.8% Fibonacci retracement of the June 23rd to June 24th sell-off.
The material provided here has not been prepared accordance with legal requirements designed to promote the independence of investment research and as such is considered to be a marketing communication. Whilst it is not subject to any prohibition on dealing ahead of the dissemination of investment research, we will not seek to take any advantage before providing it to our clients.
Pepperstone doesn’t represent that the material provided here is accurate, current or complete, and therefore shouldn’t be relied upon as such. The information, whether from a third party or not, isn’t to be considered as a recommendation; or an offer to buy or sell; or the solicitation of an offer to buy or sell any security, financial product or instrument; or to participate in any particular trading strategy. It does not take into account readers’ financial situation or investment objectives. We advise any readers of this content to seek their own advice. Without the approval of Pepperstone, reproduction or redistribution of this information isn’t permitted.
EURUSD SHIFTED TO INTRADAY BULLISH!Price has aligned with higher timeframe bias after breaking the major key level. From the intraday perspective, if I’d get a retrace to 1.16000 I’ll be looking forward to buying EURUSD

DeGRAM | EURUSD returned to the channel📊 Technical Analysis
● EURUSD broke above the descending channel resistance and reclaimed the 1.1567 level, signaling a potential reversal after defending 1.1446 support.
● The price is forming a bullish sequence of higher lows, and a breakout above 1.1592 could open the path toward the 1.1765 resistance zone.
💡 Fundamental Analysis
● A weaker-than-expected US ISM Services report triggered USD selling, while hawkish ECB remarks from Nagel supported euro recovery.
● Markets are pricing in fewer Fed hikes as job data cools, reducing dollar appeal and favoring EUR upside.
✨ Summary
Long bias above 1.1446. Breakout targets 1.1592 ➜ 1.1765. Setup valid while structure holds above prior resistance-turned-support.
-------------------
Share your opinion in the comments and support the idea with a like. Thanks for your support!

ETH Is Testing a 500+ Day Resistance Wall at $4,000Ethereum has now made its 4th attempt to break above the $4K level, a price ceiling that has held strong for over 518 days.
🔴 3 clear rejections in the past
🟠 Current price is knocking again
📈 Breakout Zone: ~$4,000–$4,200
⚠️ Rejection Zone: Keep an eye on close of weekly candle
This is a major technical level. If ETH can break and hold above, it could open the door to new price discovery. If rejected again, expect volatility and possibly a pullback into lower range support.
🧠 Chart is for educational use only. Not financial advice.

UPST watch $67.57-68.55: Major Support might hold earnings DUMPUPST earnings were apparently not pleasing to the Street.
We got a bull trap then a dump to support zone at $67.57-68.55
Looking support to hold and Break-n-Retest to start adding longs.

Gold Poised to Rise on Looming Russia Sanctions!!Hey Traders, above is a breakdown of the current technical and fundamental setup for Gold, with a focus on key support zones and the macro landscape that could drive further upside.
From a technical standpoint, the first major support area to watch is around 3,334, which previously acted as a strong resistance level. Now that price has broken above it, we could see this zone retested as a support — a classic breakout-retest scenario that may offer a potential bounce opportunity.
The second key zone is located near 3,311, a historically significant support/resistance level. What makes this level even more critical is its confluence with the primary ascending trendline, reinforcing its importance as a structural support in case of a deeper retracement.
On the fundamental side, gold continues to benefit from its role as a safe-haven asset, especially amid rising geopolitical and economic tensions. There are two major catalysts in play right now:
Escalating trade tensions, particularly around new tariffs. Markets are pricing in a high baseline tariff risk of 15%, which adds a layer of uncertainty and supports defensive assets like gold.
Mounting geopolitical pressure on Russia, with the U.S. expected to announce secondary sanctions this week. These could further disrupt global markets and drive demand for hard assets.
In summary, gold is positioned well both technically and fundamentally. If price holds above the mentioned support zones, we could see renewed bullish momentum in the sessions ahead. Keep an eye on developments related to trade policy and sanctions, they could be key drivers of the next move.

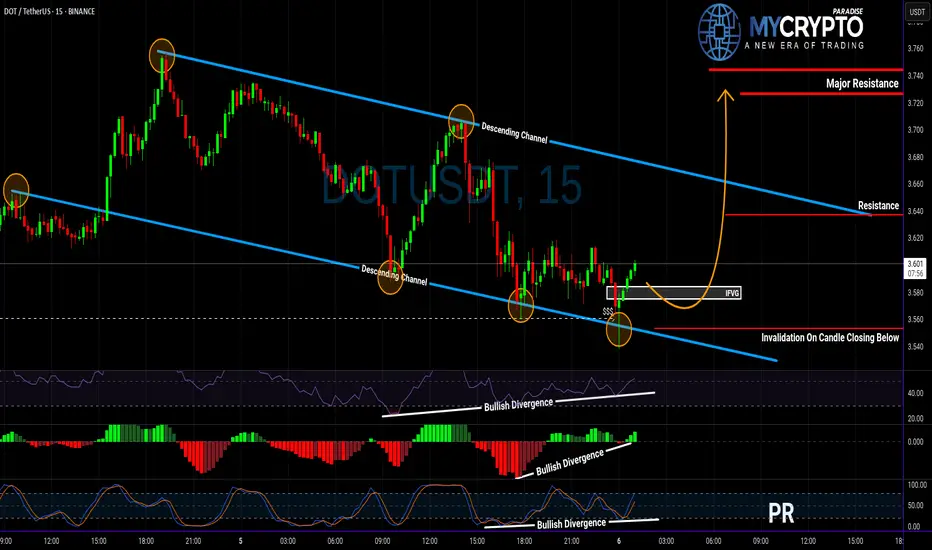
DOT About to Explode or Collapse? Read This Before Entering!Yello Paradisers, are you watching DOT closely? Because this setup could either give aggressive traders a golden entry—or wipe out the impatient ones 👀
💎DOTUSDT is showing strength after sweeping liquidity and now sitting right at the supportive trendline of its descending channel. What’s catching our attention is the clear bullish divergence on RSI, MACD, and Stoch RSI, which together boost the probability of a bullish breakout from here.
💎If we get a pullback, the IFVG zone (Inverse Fair Value Gap) below offers a clean setup for a high RR (risk-to-reward) trade. That would be a more strategic entry for patient traders. But for those who trade more aggressively, the current price is already offering a decent RR setup—just remember, this is not advisable for beginners. Patience and discipline remain key, especially in uncertain zones like this.
💎However, if DOTUSDT breaks down and closes a candle below our invalidation level, the bullish scenario is completely off the table. In that case, the smartest move is to step aside and wait for better confirmation before making any decisions.
🎖Strive for consistency, not quick profits. Treat the market as a businessman, not as a gambler.
MyCryptoParadise
iFeel the success🌴
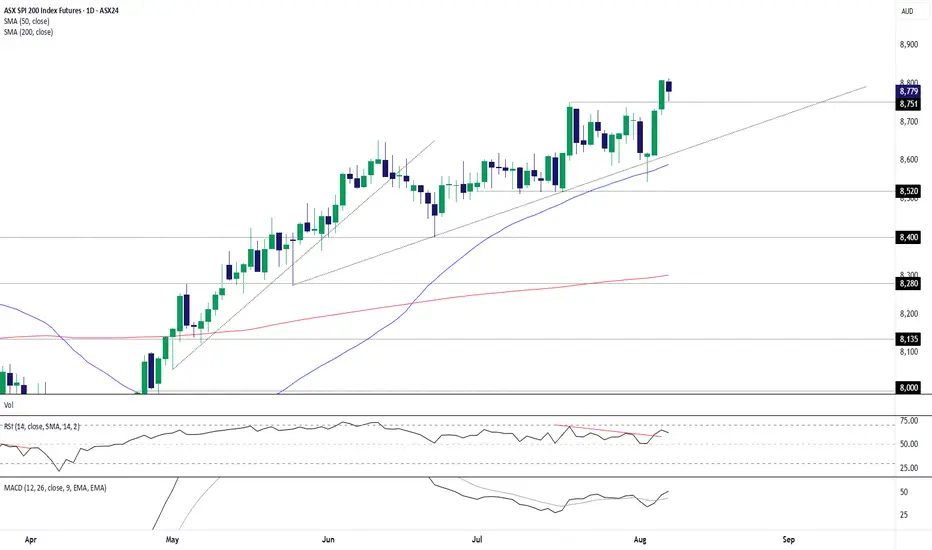
ASX 200 Futures: Back-Test Bounce Keeps Bulls in ControlASX 200 futures remain a buy-on-dips prospect, putting the contract on track to test the 9000 level soon.
Already sitting in an established uptrend, the latest leg higher coincided with a three-candle morning star pattern being completed on Tuesday, providing a bullish signal that goes some way to explaining the price taking out the former record high of 8751 a day later. The back-test and bounce from this level overnight suggest the path of least resistance remains higher. It also provides a level to build bullish setups around should we see a retracement to the level.
If we see a pullback towards 8751, longs could be established above with a stop below for protection. Wednesday’s high and 8900 are levels of note for those contemplating the trade, although 9000 comes across as a more appealing target.
Momentum indicators are also signalling growing topside pressure, with RSI (14) breaking its downtrend above 50 while MACD has crossed the signal line from below in positive territory. Combined, it provides a backdrop that favours a bullish bias.
Good luck!
DS
Dollar Index (DXY): Important Bearish BreakoutThe Dollar Index has fallen below a key daily/intraday support level,
which has now become resistance.
A bearish trend is likely to persist, with the next target set at 98.15.

EURCHF Wave Analysis – 6 August 2025
- EURCHF rising inside sideways price range
- Likely to test resistance level 0.9420
EURCHF currency pair recently reversed from the support area between the strong support level of 0.9300 (lower border of the sideways price range from April) and the lower daily Bollinger Band.
The upward reversal from this support area created the clear daily Japanese candlesticks reversal pattern Bullish Engulfing – which started active impulse wave 3.
Given the strongly bearish Swiss franc sentiment seen today, EURCHF can be expected to rise to the next resistance level 0.9420 (upper border of the active sideways price range).
Nikkei primary trend remains bullish.NIK225 - 24h expiry
Price action continues to trade around significant highs.
The primary trend remains bullish.
20 1day EMA is at 40385.
We look for a temporary move lower.
Dip buying offers good risk/reward.
We look to Buy at 40405 (stop at 40105)
Our profit targets will be 41305 and 41455
Resistance: 40895 / 41043 / 41315
Support: 40635 / 40375 / 40000
Risk Disclaimer
The trade ideas beyond this page are for informational purposes only and do not constitute investment advice or a solicitation to trade. This information is provided by Signal Centre, a third-party unaffiliated with OANDA, and is intended for general circulation only. OANDA does not guarantee the accuracy of this information and assumes no responsibilities for the information provided by the third party. The information does not take into account the specific investment objectives, financial situation, or particular needs of any particular person. You should take into account your specific investment objectives, financial situation, and particular needs before making a commitment to trade, including seeking, under a separate engagement, as you deem fit.
You accept that you assume all risks in independently viewing the contents and selecting a chosen strategy.
Where the research is distributed in Singapore to a person who is not an Accredited Investor, Expert Investor or an Institutional Investor, Oanda Asia Pacific Pte Ltd (“OAP“) accepts legal responsibility for the contents of the report to such persons only to the extent required by law. Singapore customers should contact OAP at 6579 8289 for matters arising from, or in connection with, the information/research distributed.

AUD_JPY BEARISH BIAS|SHORT|
✅AUD_JPY has retested a key resistance level of 96.000
And as the pair is already making a bearish pullback
A move down to retest the demand level below at 95.500 is likely
SHORT🔥
✅Like and subscribe to never miss a new idea!✅

XRP : Will Ripple be pumped?Hello friends🙌
✅ considering the decline we had and the entire market, Ripple has also fallen like other currencies.
✅You can see that the price has hit resistance several times but failed to break it. Finally, in the last hit, which we also identified on the chart, the powerful price broke through the resistance.
✅Now, in the support area we identified on the chart, you can see that the price is supported by buyers and higher lows have been recorded.
✅Now that the price has pulled back and buyers have provided good support, you can buy in steps with risk and capital management and move with it to the specified goals.
🔥Follow us for more signals🔥
*Trade safely with us*
