NZDCAD SHORT Market structure bearish on HTFs DW
Entry at both weekly and daily
Weekly Rejection at AOi
Previous Weekly Structure Point
Daily Rejection at AOi
Daily EMA retest
Previous Structure point Daily
Around Psychological Level 0.82000
H4 Candlestick rejection
Levels 3.23
Entry 100%
REMEMBER : Trading is a Game Of Probability
: Manage Your Risk
: Be Patient
: Every Moment Is Unique
: Rinse, Wash, Repeat!
: Christ is King.
Support and Resistance

EURJPY: Classic Bullish Pattern 🇪🇺🇯🇵
There is a high chance that EURJPY will continue growing.
A bullish breakout of a neckline of an inverted head & shoulders
pattern leaves clear bullish clues.
Next resistance - 171.9
b]❤️Please, support my work with like, thank you!❤️
I am part of Trade Nation's Influencer program and receive a monthly fee for using their TradingView charts in my analysis.

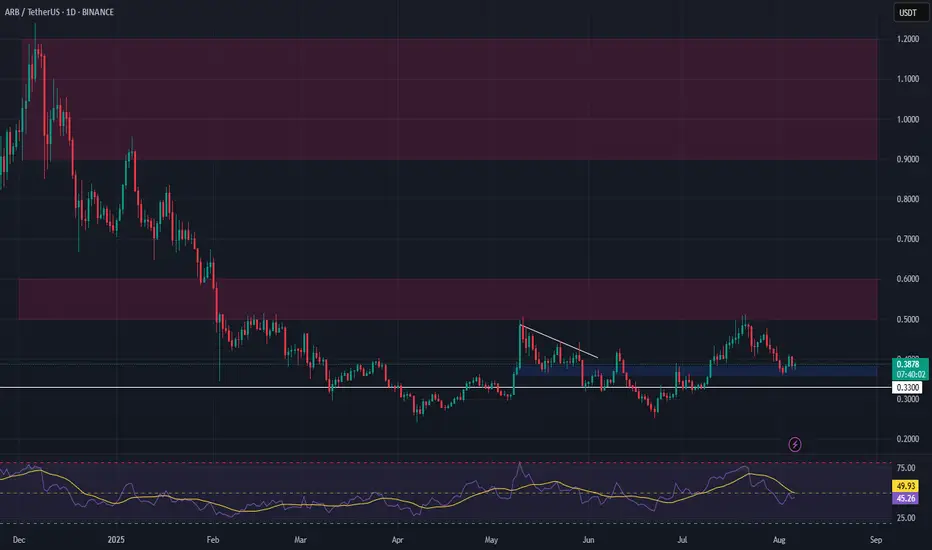
ARB Setup – Watching Key Support for Long EntryArbitrum (ARB) has pulled back into a critical support zone after recent declines. This level is showing strong buyer interest, and we’re eyeing a potential spot long entry as price consolidates near the lows.
📌 Trade Setup:
• Entry Zone: $0.386 – $0.38
• Take Profit Targets:
o 🥇 $0.50 – $0.60
o 🥈 $0.95 – $1.20
• Stop Loss: Just below $0.33
USDCAD: Bearish Structure with Rejection from Key Supply ArraysGreetings Traders,
In today’s analysis of USDCAD, recent price action confirms the presence of bearish institutional order flow. As a result, we aim to align ourselves with this directional bias by identifying strategic selling opportunities.
Key Observations:
Weekly Timeframe Insight:
Last week's candle rebalanced a weekly Fair Value Gap (FVG), indicating internal range price action. As a rule of thumb, once internal imbalances are addressed, the draw typically shifts toward external liquidity—located at the swing low, where the weekly liquidity pool resides.
H4 Resistance Alignment:
On the H4 timeframe, price shifted bearish and has since retraced into a bearish FVG that aligns precisely with a reclaimed bearish order block. The alignment of these bearish arrays strengthens the case for continued downside, making this zone a high-probability resistance area.
Trading Plan:
Entry Strategy:
Look for bearish confirmation setups on the M15 or lower timeframes within the H4 supply arrays (FVG + OB confluence).
Target Objective:
The primary draw on liquidity lies within the discount range—targeting the liquidity pool below the most recent swing low.
For a detailed market walkthrough and in-depth execution zones, be sure to watch this week’s Forex Market Breakdown:
Stay patient, wait for your confirmations, and trade in alignment with the flow of smart money.
Kind regards,
The Architect 🏛️📉

ANF watch $103: Proven Resistance zone holding up next major legANF trying to paint a bottom after a downtrend.
Now testing a proven Resistance $103.14-103.97
Look for a Break-n-Retest, dips not interesting

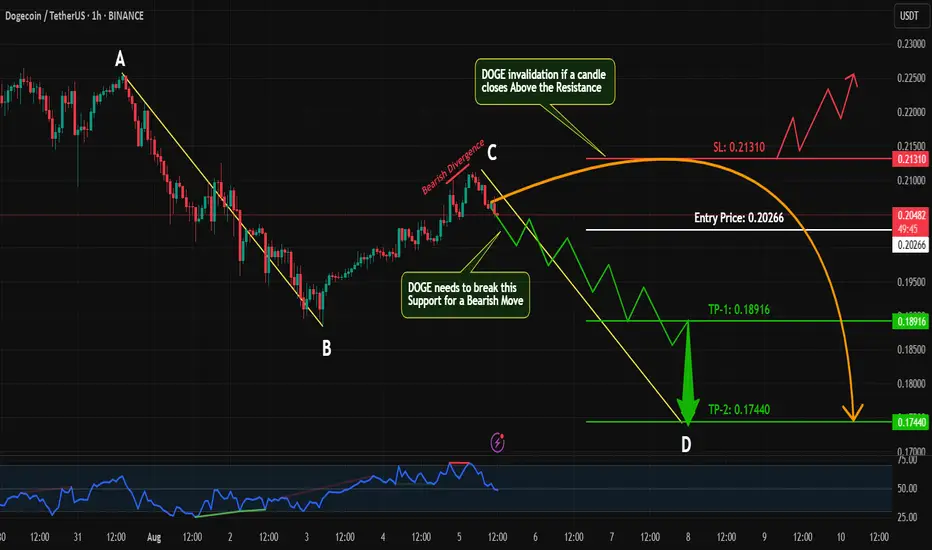
DOGE Bearish Setup in Progress |AB=CD Pattern+Bearish Divergence Hey Traders!
#DOGE/USDT is currently showing signs of a bearish continuation on the 1H timeframe 📉. Here's why I'm watching this closely:
🔹 AB=CD Harmonic Pattern:
The AB leg is already complete, and the price action is now progressing toward forming the CD leg — a classic harmonic setup suggesting further downside.
🔹 Bearish Divergence on RSI:
While the price made a higher high, RSI failed to confirm — signaling weakening momentum and potential reversal ahead.
🔹 Key Support Level in Focus:
I’m watching the previous minor support zone for confirmation. If price breaks and retests this level, it could be a great entry point for a short trade with solid risk-reward.
📌 Trade Plan:
✅ Wait for confirmation below support
✅ Look for bearish candlestick patterns or breakdown
✅ Enter short with proper risk management (SL just above local highs)
💬 What do you think about this setup? Are you already short on #DOGE or waiting for more confirmation? Drop your thoughts below 👇 and let’s discuss!
If you find this analysis helpful, don’t forget to:
👍 Like
💬 Comment
🔁 Share
📥 Follow for more high-probability setups!
Strike with precision and win in the gold trading market!Gold continues to fluctuate in an upward structure, with lows gradually rising, showing that the bulls are still in a dominant position. The current key support has moved up to the 3360 line. Before this position is effectively broken, the overall idea is to maintain a low-long strategy. It should be noted that the current market has been consolidating at a high level for three consecutive days, and has the basis for further strengthening. It is not advisable to wait for a sharp pullback at this time, but to pay attention to the continuity opportunities of direct pull-ups. It is recommended to seize the strong continuation opportunities in the current period in terms of operations, and strategically postpone it to the European and American trading sessions for simultaneous execution. Specifically pay attention to the long order layout opportunities in the support area of 3375-3360, and the upper resistance is around 3390-3405. Overall, we should flexibly participate in the high-altitude and low-long rhythm in this range. It is recommended to wait and see in the middle position, chase orders cautiously, and wait patiently for key points to enter the market.

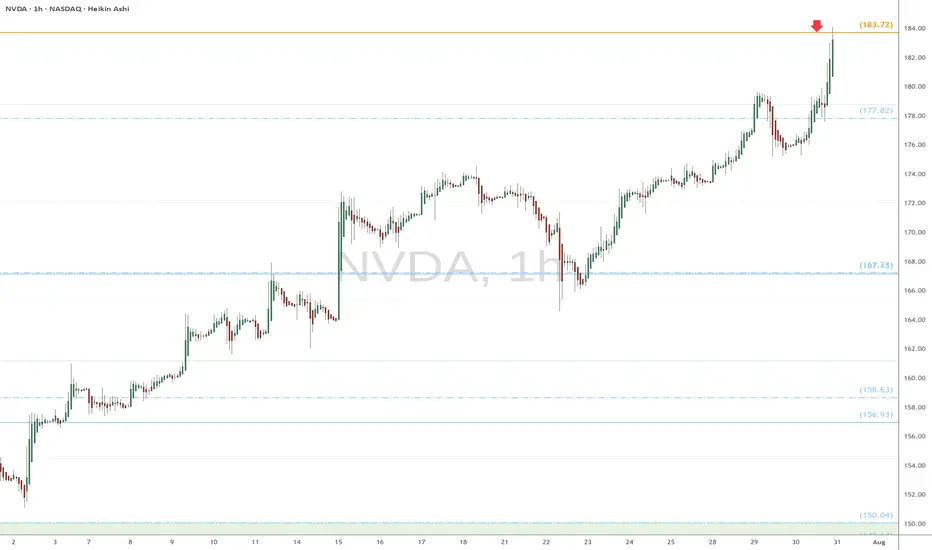
NVDA heads up at $183.72: Golden Genesis fib to mark a TOP?Chips have been flying high since the April lows.
NVDA has just hit a Golden Genesis fib at $183.72
This is a "very high gravity" fib so expect a reaction.
It is PROBABLE that we "orbit" this fib a few times.
It is POSSIBLE that we reject to form a major top.
It is PLAUSIBLE that we Break-n -Retest to continue.\
.
See "Related Publications" for previous EXACT plots ------>>>>>>>>
Such as this post at the last Golden Genesis:
Hit the BOOST and FOLLOW for more such PRECISE and TIMELY charts
============================================================
.
NZDUSD SHORTsMarket structure bearish on HTFs DW
Entry on Weekly and Daily AOi
Weekly Rejection at At AOi
Previous Weekly Structure Point
Daily Rejection at AOi
Daily EMA retest
Previous Structure point Daily
Around Psychological Level 0.59500
H4 Candlestick rejection
Levels 3.67
Entry 100%
REMEMBER : Trading is a Game Of Probability
: Manage Your Risk
: Be Patient
: Every Moment Is Unique
: Rinse, Wash, Repeat!
: Christ is King.

SN - Potential ALL TIME HIGH ?SN - CURRENT PRICE : 115.50 - 116.10
SN is bullish as the price is making HIGHER HIGH and HIGHER LOW. On 01 August 2025 the stock made a down gap due to weak market sentiment. However, today 04 August 2025 the share price rises and move above the down gap zone. This scenario hints that the bulls are strong enough to overcome the selling pressure. As the major trend is up, trend follower traders may anticipate to buy the stock right now. Nearest target will be 122 (one dollar below the ALL TIME HIGH resistance). Then if it continues to break 123, next target will be 1.35.
ENTRY PRICE : 115.50 - 116.10
TARGET : 122 and 135
SUPPORT : 110

DXY (USDX): Trend in daily time frameThe color levels are very accurate levels of support and resistance in different time frames, and we have to wait for their reaction in these areas.
So, Please pay special attention to the very accurate trend, colored levels, and you must know that SETUP is very sensitive.
(((((we have two trend)))))
BEST,
MT

XAUUSD rises due to tariff wars and weak economic dataXAUUSD rises due to tariff wars and weak economic data
Gold climbed to 3,380.00 level on August 7, hitting a two-week high, as renewed U.S. tariff threats and expectations of Federal Reserve rate cuts in September and December boosted its appeal. President Trump announced 100% tariffs on imported semiconductors (excluding U.S.-made), 25% on Indian imports, and 50% on select Brazilian goods. Additionally, Weak U.S. economic data and a cooling labor market further support gold’s rise.
Technically, price has formed the Pennant chart pattern right below the local resistance of 3,380.00. Further breakout of the level and ascending towards 3,440.00 level is expected in short-term.

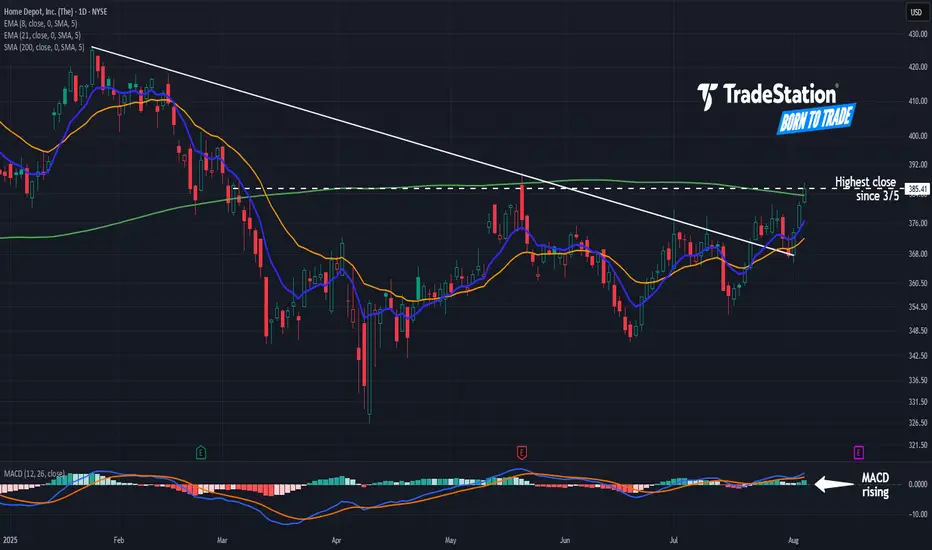
Home Depot May Have BottomedHome Depot has yet to recover from a first-quarter slide, but some traders may think the home-improvement chain has bottomed.
The first pattern on today’s chart is the series of lower highs between January and mid-July. HD has fought above that falling trendline in the last two weeks. Has resistance been broken?
Second, the stock has challenged a peak from around May 20 and yesterday had its highest closing price since March 5. It’s also back above the 200-day simple moving average.
Third, the 8-day exponential moving average (EMA) is above the 21-day EMA. MACD has also been rising. Those signals may reflect increased bullishness in the short term.
TradeStation has, for decades, advanced the trading industry, providing access to stocks, options and futures. If you're born to trade, we could be for you. See our Overview for more.
Past performance, whether actual or indicated by historical tests of strategies, is no guarantee of future performance or success. There is a possibility that you may sustain a loss equal to or greater than your entire investment regardless of which asset class you trade (equities, options or futures); therefore, you should not invest or risk money that you cannot afford to lose. Online trading is not suitable for all investors. View the document titled Characteristics and Risks of Standardized Options at www.TradeStation.com . Before trading any asset class, customers must read the relevant risk disclosure statements on www.TradeStation.com . System access and trade placement and execution may be delayed or fail due to market volatility and volume, quote delays, system and software errors, Internet traffic, outages and other factors.
Securities and futures trading is offered to self-directed customers by TradeStation Securities, Inc., a broker-dealer registered with the Securities and Exchange Commission and a futures commission merchant licensed with the Commodity Futures Trading Commission). TradeStation Securities is a member of the Financial Industry Regulatory Authority, the National Futures Association, and a number of exchanges.
TradeStation Securities, Inc. and TradeStation Technologies, Inc. are each wholly owned subsidiaries of TradeStation Group, Inc., both operating, and providing products and services, under the TradeStation brand and trademark. When applying for, or purchasing, accounts, subscriptions, products and services, it is important that you know which company you will be dealing with. Visit www.TradeStation.com for further important information explaining what this means.
GBPUSD SHORT Market structure bearish on HTFs DW
Entry at Both Weekly and Daily AOi
Weekly rejection at AOi
Weekly Previous Structure point
Daily Rejection at AOi
Previous Structure point Daily
Around Psychological Level 1.34000
H4 Candlestick rejection
Levels 4.8
Entry 95%
REMEMBER : Trading is a Game Of Probability
: Manage Your Risk
: Be Patient
: Every Moment Is Unique
: Rinse, Wash, Repeat!
: Christ is King.

WTI watch $70.34-70.43: Resistance zone that may STOP the surgeUSOIL spiked on Trump/Russia/Iran tariff threats.
Just hit a significant resistance at $70.34-70.43
Look for a Dip-to-Fib or Break-n-Retest for longs.

MP eyes on $49.43: Golden Genesis fib stopped the news spikeMP is now partially owned by the DOD, which spiked the price.
That massive move smacked into the Golden Genesis at $49.43
Look for a Break-n-Retest for idea long, or Dip-to-Fib below.

XAUUSD - 4/8/25Theres alot happening that is influencing Gold. But just following the market structure, we see a HTF BoS towards more bearish action. However friday's news did bring a big push up with huge imbalance in the Dollar as well as Gold.
I identified the zone that broke structure above and looking for price to touch this zone before going back down to take out any imbalance. t
The current TP is quite way down at the moment targeting the HTF equal low liquidity, but I will trail my SL.
if this Zone that broke structure is taken out then my bias will shift to bullish trades to retest the ATH.

EURUSD – Critical Zone AheadBack on June 29, I shared a buy idea on EURUSD (tagged below this post).
Due to a busy schedule, I couldn't post an update—but as you can see, price reacted to my marked zone, did a quick stop-hunt, and moved up strongly.
Now, the current zone marked on the chart is a potential short area,
but again—we don’t tell the market what to do. We follow it.
📌 If the level breaks upward, we’ll wait for a pullback to go long.
If a valid short signal shows up, we’ll go short.
🔁 Anything can happen—this is why I always remind traders:
Don’t stand in front of the market.
Those who do… often end up like sardines eaten by the whales 🐋—liquidated and out of capital.
Let the market choose the direction, and we simply follow.
📈 Stay flexible. Stay humble. Stay profitable.

USDJPY: Trend in 2H time framePlease pay special attention to the very accurate trend, colored levels, and red level as SL.
Be careful
BEST
MT

Gold Poised for a Surge: 3400 in Sight, 3430 Within ReachToday, gold retreated to a low of around 3350 before rebounding again, reaching a high of around 3390. During this process, we seized the opportunity to go long on gold near 3356 and closed the trade by successfully hitting TP: 3380, making a profit of 240 pips!
Although gold retreated after reaching 3390, I had originally planned to short gold near 3395, but gold didn't reach that level during the rally, so our shorting plan had to be shelved. Currently, it's trading in a narrow range around 3380. Clearly, I'm not considering shorting gold after a pullback.
Although gold retreated to around 3350 during the day, it did not destroy the current bullish structure of gold. In addition, gold regained the 3370-3375 area again during the rebound, and the gold bulls became even stronger. Therefore, I have now lost the desire and interest to short gold. Gold has currently reached a high near 3390. Given its current structure and strength, I don't believe 3390 is the current high. Gold is likely to attempt to break through 3400, and even has the potential to continue its rise to the 3420-3430 range. As the center of gravity of gold shifts upward, the current short-term support has moved up to the 3375-3365 area; and the relatively strong support is located in the 3360-3350 area.
Therefore, for short-term trading, I prefer to start trying to go long on gold after it retreats to the 3375-3365 area, and expect gold to hit 3400 as expected, or even continue to the 3420-3430 area.

AUDUSD – Plan Ready for Both ScenariosWe're patiently waiting for price to reach our key zone. If we get a valid sell signal, we’ll take the short.
But if the market breaks above this level with strength and gives us a clean pullback, we’re ready to go long.
No guessing. No hoping. Just reacting to what the market shows us.
📌 Discipline over prediction.

AUDCAD SHORT Market structure bearish on HTFs 3
Entry at both Daily and Weekly AOi
Weekly Rejection at AOi
Previous Weekly Structure Point
Daily Rejection at AOi
Previous Structure point Daily
Around Psych Level 0.89500
H4 Candlestick rejection
Rejection from Previous structure
Levels 4.18
Entry 120%
REMEMBER : Trading is a Game Of Probability
: Manage Your Risk
: Be Patient
: Every Moment Is Unique
: Rinse, Wash, Repeat!
: Christ is King.

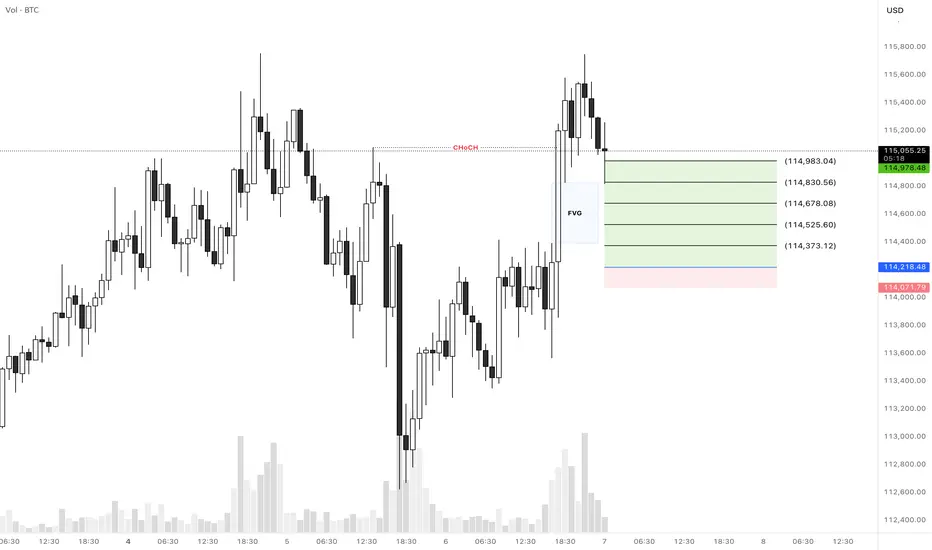
BTCUSD Long SetupHello everyone.
We have a CHoCH in 1H TF that it left a FVG area and it was touched a minute ago...
Let's see how does it reacts to this FVG area and if it didn't push the price up then we can expect our entry is valid...
Another thing that we should consider is that we're in down trend in 4H TF and the price didn't break the previous high for a CHoCH, so this trade would be a little risky so please consider the risk management...
Let's see what happens...
Good luck