EURUSD SHIFTED TO INTRADAY BULLISH!Price has aligned with higher timeframe bias after breaking the major key level. From the intraday perspective, if I’d get a retrace to 1.16000 I’ll be looking forward to buying EURUSD
Support and Resistance

USDJPY: Trend in 2H time framePlease pay special attention to the very accurate trend, colored levels, and red level as SL.
Be careful
BEST
MT

Waaree energyies ready for warWaaree energies forming head and shoulder pattern waiting for neckline to break.After that target will be 1200 points atleast. This target is long term target it may take atleast 13 weeks after break out.
So target is 4400
Neckline 3200
Wait for 3400 for safety after that take the trade for the target of 4400.

SILVER WILL GO UP|LONG|
✅SILVER is going up
Now and the pair made a bullish
Breakout of the key horizontal
Level of 37.73$ and the breakout
Is confirmed so we are bullish
Biased and we will be expecting
A further bullish move up
LONG🚀
✅Like and subscribe to never miss a new idea!✅

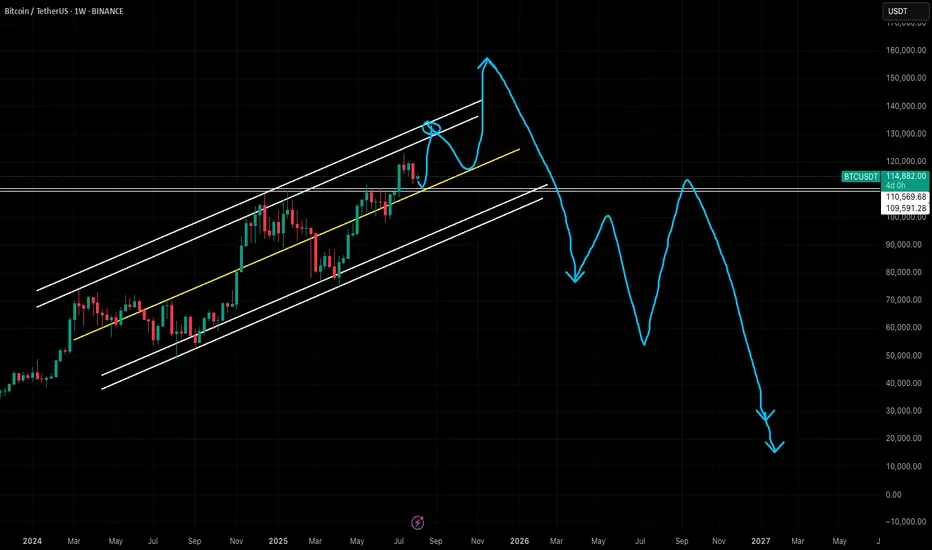
Bitcoin Analysis As Per Seasonality & PatternBitcoin Analysis As Per Seasonality & Pattern - DYOR
Expecting Top Of Bitcoin Around $150k - $160k By The End Of This Year 2025 and Right After That Bitcoin Can Start Falling After Completing Its Bull Cycle
In Next Bear Market Which I Am Expecting In Year 2026 - Potential Bottom Should Be Below $20k - In Next Bear Market Expecting Bitcoin To Take Longest Correction In History Can Around 90% Drop From Its Top
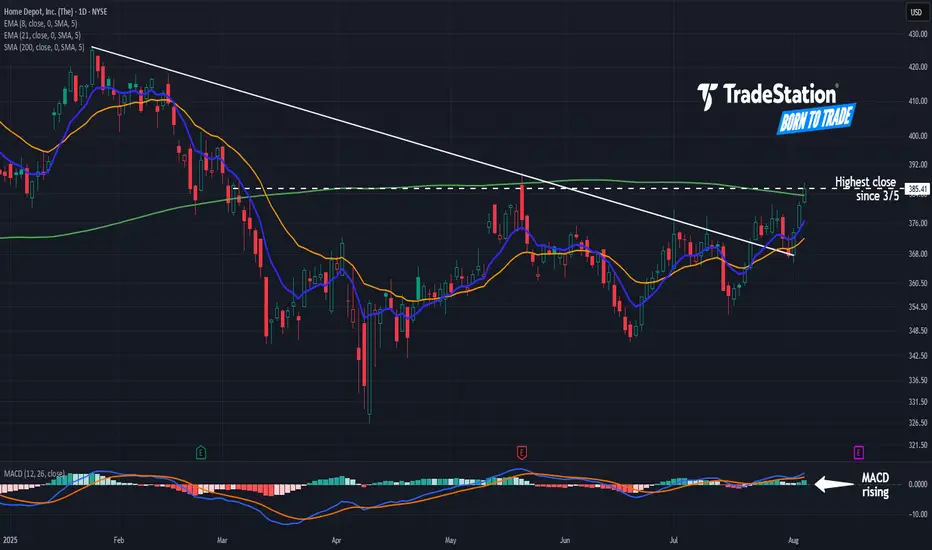
Home Depot May Have BottomedHome Depot has yet to recover from a first-quarter slide, but some traders may think the home-improvement chain has bottomed.
The first pattern on today’s chart is the series of lower highs between January and mid-July. HD has fought above that falling trendline in the last two weeks. Has resistance been broken?
Second, the stock has challenged a peak from around May 20 and yesterday had its highest closing price since March 5. It’s also back above the 200-day simple moving average.
Third, the 8-day exponential moving average (EMA) is above the 21-day EMA. MACD has also been rising. Those signals may reflect increased bullishness in the short term.
TradeStation has, for decades, advanced the trading industry, providing access to stocks, options and futures. If you're born to trade, we could be for you. See our Overview for more.
Past performance, whether actual or indicated by historical tests of strategies, is no guarantee of future performance or success. There is a possibility that you may sustain a loss equal to or greater than your entire investment regardless of which asset class you trade (equities, options or futures); therefore, you should not invest or risk money that you cannot afford to lose. Online trading is not suitable for all investors. View the document titled Characteristics and Risks of Standardized Options at www.TradeStation.com . Before trading any asset class, customers must read the relevant risk disclosure statements on www.TradeStation.com . System access and trade placement and execution may be delayed or fail due to market volatility and volume, quote delays, system and software errors, Internet traffic, outages and other factors.
Securities and futures trading is offered to self-directed customers by TradeStation Securities, Inc., a broker-dealer registered with the Securities and Exchange Commission and a futures commission merchant licensed with the Commodity Futures Trading Commission). TradeStation Securities is a member of the Financial Industry Regulatory Authority, the National Futures Association, and a number of exchanges.
TradeStation Securities, Inc. and TradeStation Technologies, Inc. are each wholly owned subsidiaries of TradeStation Group, Inc., both operating, and providing products and services, under the TradeStation brand and trademark. When applying for, or purchasing, accounts, subscriptions, products and services, it is important that you know which company you will be dealing with. Visit www.TradeStation.com for further important information explaining what this means.
Rivian major consolidation coming to a decisionRivian is in my opinion coming closer to a decision on a breakout or breakdown. I personally love Rivian - I own one, and it's my favorite car I've ever owned. Next year they're planning on launching a much more affordable mid size SUV (R2) that I think will drastically increase their sales. It brings everything that is great about R1S/R1T to a more affordable platform without losing all the great technology and things we love about the more expensive R1.
I see that opportunity and want to be in on it, however as a trader, I need a deal and Rivian at $12 is not it. So I'm hoping this consolidation will break down for an opportunity at $7. There have been people holding this stock for so long betting on another Tesla, and with any luck some of them will finally throw in the towel if this obvious symmetrical triangle breaks down.
And if not, and it breaks up then I'm happy for all those loyal fans who've been holding for years. I love my SUV and am excited for Rivian to keep making even greater cars.
It's hard to predict how this pattern will play out, that's why I'm personally waiting on the sidelines.
Good luck!

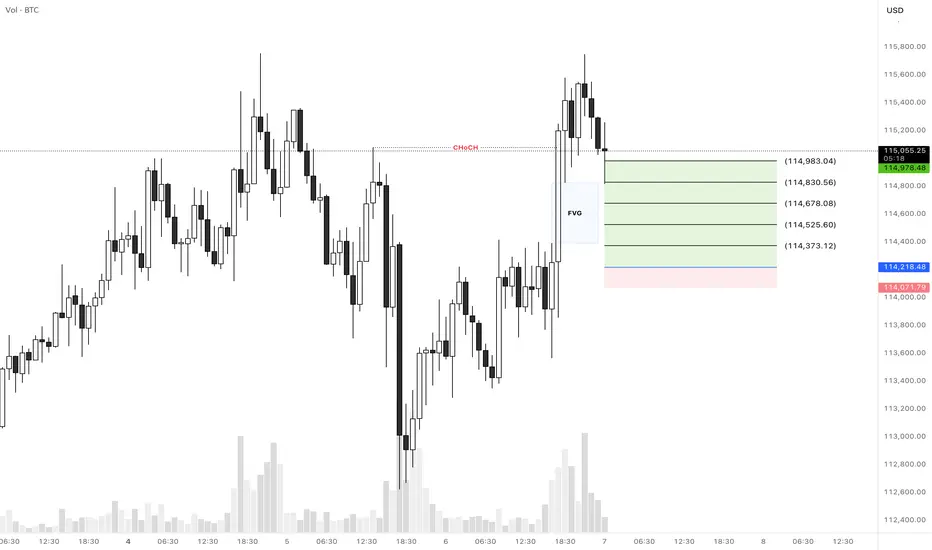
BTCUSD Long SetupHello everyone.
We have a CHoCH in 1H TF that it left a FVG area and it was touched a minute ago...
Let's see how does it reacts to this FVG area and if it didn't push the price up then we can expect our entry is valid...
Another thing that we should consider is that we're in down trend in 4H TF and the price didn't break the previous high for a CHoCH, so this trade would be a little risky so please consider the risk management...
Let's see what happens...
Good luck
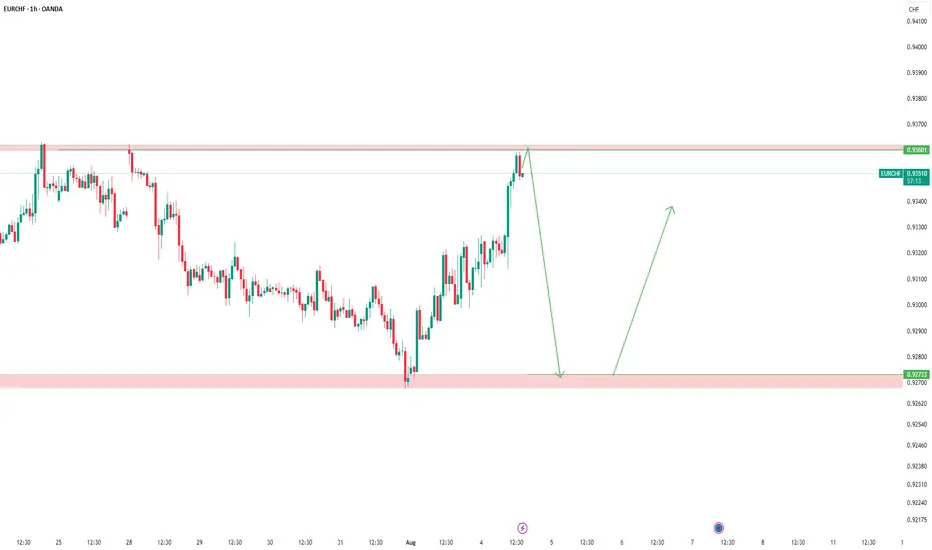
EURCHF – Waiting for the Signal, Not the MiracleWe are currently in a great area for a potential short, and the marked zone looks ideal for an entry—but only if a valid signal confirms it.
We’re not upset if the level gets broken.
We don’t say “this strategy doesn’t work.”
Why? Because we know the market is not under our control.
If price breaks above and gives a clean pullback, we’ll go long.
Simple. No ego. No bias.
Also, the lower level marked on the chart seems to be a great zone for either taking profit from shorts or initiating fresh longs.
🎯 We follow the market, not fight it.
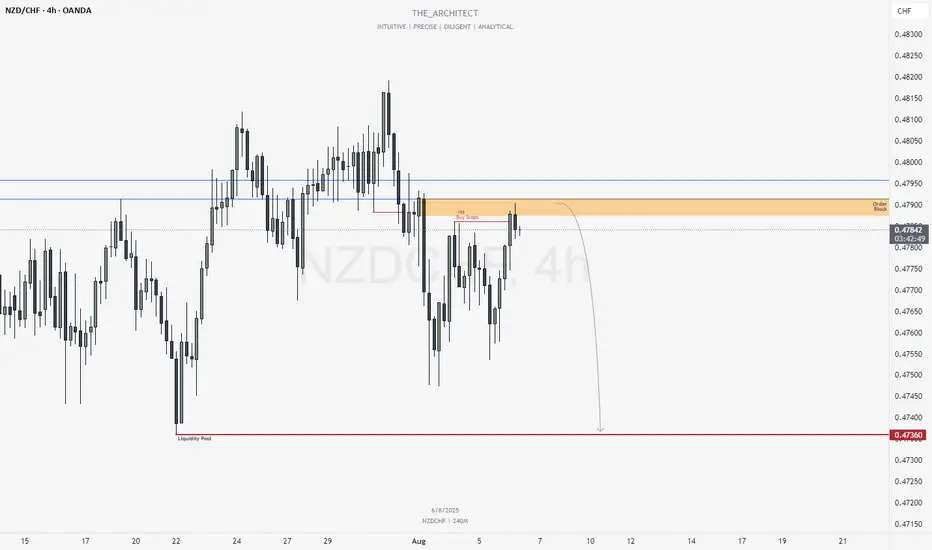
NZDCHF: Selling Within Bearish Order Flow & Order BlockGreetings Traders,
In today’s analysis of NZDCHF, recent price action confirms the presence of bearish institutional order flow. As a result, we aim to align ourselves with this directional bias by identifying strategic selling opportunities.
🔍 Key Observations on H4:
Bearish Market Structure Shift
The H4 timeframe has confirmed a bearish shift in market structure, giving us a solid framework to seek short setups aligned with institutional momentum.
Bearish Order Block
Price has recently reached a bearish order block, expected to act as a strong resistance zone for potential downside continuation.
Liquidity Engineering
Buy stops on H4 have been taken out—this sweep may be used to order the pair against liquidity, favoring bearish continuation.
📈 Trading Plan:
Entry Strategy
Monitor lower timeframes (e.g., M15 and below) for bearish confirmation setups within or near the bearish order block.
Target Objective
Our draw on liquidity remains the liquidity pool located at deeper discount levels, in alignment with the prevailing short bias.
For a detailed market walkthrough and in-depth execution zones, be sure to watch this week’s Forex Market Breakdown:
Stay disciplined, trust your confirmations, and manage your risk wisely.
Kind regards,
The Architect 🏛️📉
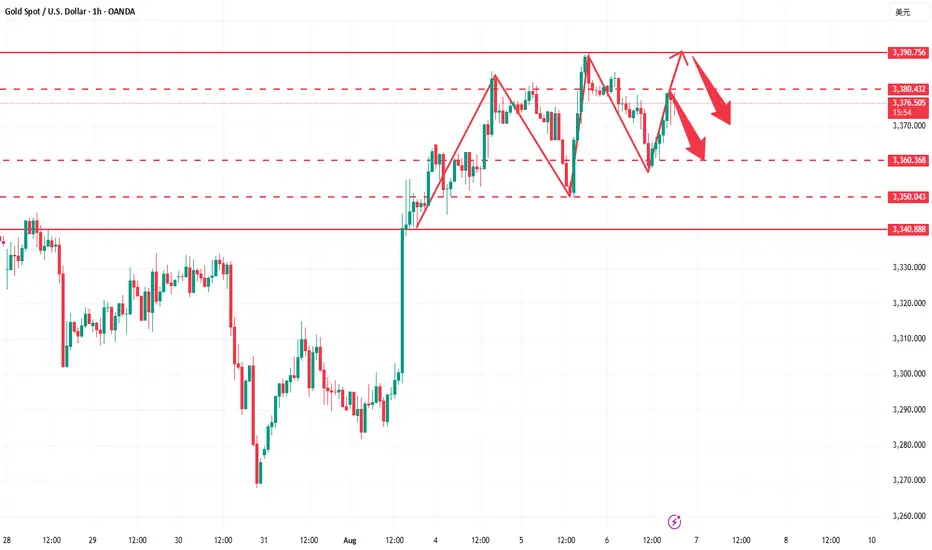
Gold fluctuates repeatedly. How can we avoid detours?Gold currently lacks sustained bullish momentum. The monthly chart has formed four consecutive upper shadows, indicating significant market pressure at high levels. Bulls are hesitant to take risks and lack the appetite for aggressive action, leading to a typical volatile pattern of rapid rises and equally rapid declines in gold prices. Yesterday's price action further confirmed this pattern. Although gold prices briefly reached a new high after bottoming out and rebounding, they were unable to consolidate above that level and subsequently retreated rapidly. Currently, the 3380-3390 area has become a key short-term resistance level, but repeated attempts to retest it have led to heavy selling pressure. Meanwhile, the 3370 area, a trading-intensive zone, poses significant downside risks for gold if it breaks below it, potentially extending the range to 3355-3340. Technically, resistance is concentrated in the 3380-3390 area, while support lies at 3355-3340. Short-term volatility is largely locked within this range. We recommend maintaining a volatile strategy of buying high and selling low.
Regarding trading strategies, we recommend placing short positions in batches within the 3375-3390 area, targeting 3360-3345. Pay attention to position control and stop-loss settings during this process. If the price rebounds to the support area and stabilizes, consider short-term long positions to flexibly respond to the intraday rhythm.
Bitcoin inverted HEAD & SHOULDERSIf this is an inverted HEAD & shoulders pattern for bitcoin, then the neckline is already broken and bitcoin is Back testing that now, well the target is $160k as well

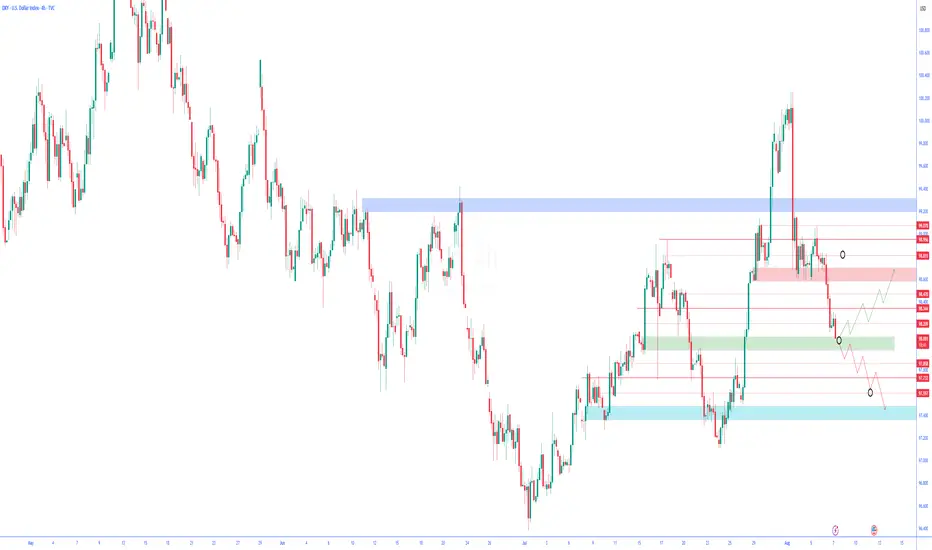
Technical Analysis of the US Dollar Index (DXY) | 4-Hour Timefr🟢 Technical Analysis of the US Dollar Index (DXY) | 4-Hour Timeframe
On the 4-hour chart, the US Dollar Index has recently formed a Drop-Base-Drop (DBD) structure and is now positioned on a significant support level. This area can play a critical role in traders' decision-making for the next move.
✅ Current Situation:
After the initial drop, the price entered a short-term base/consolidation phase, then continued its decline and is now testing a demand zone (support). In this structure, two potential scenarios are worth considering:
🔼 Bullish Scenario:
If the price reacts positively to this support zone:
A rebound toward previous supply areas is likely.
Holding above the first resistance could indicate a temporary or even long-term trend reversal.
This level may provide a low-risk entry opportunity for buyers targeting a reversal.
🔽 Bearish Scenario:
If selling pressure continues and the current support breaks:
A further drop as part of a third wave (impulse) may unfold.
Lower support zones would become the next target areas for sellers.
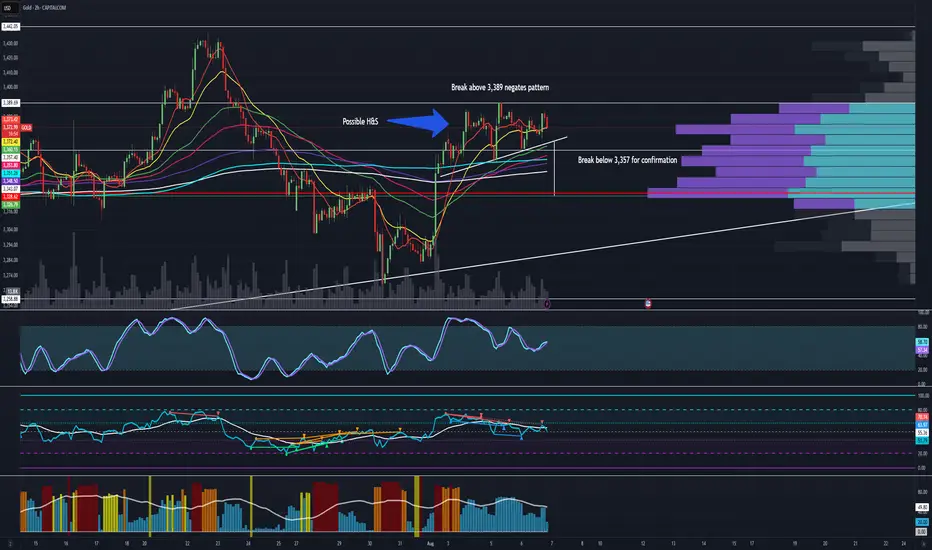
Possible Head and Shoulders Pattern - Analysis and TargetsWe have a possible head and shoulders formation on Gold. Upon a break below 3,358, we would have a target down to 3,327 which also would line up with our volume blocks on the VPVR. A break above 3,390 would negate this pattern. If we break down we are still in a macro ascending triangle formation which would be a bullish formation until proven otherwise.
Short Term : Bearish
Medium/Long Term : Bullish
Usdchf We hv gotten our entry so we are waiting for price to go bearish I posted the analysis few hours ago

AUD eyes yield advantage over USD UBS strategists view the Australian dollar as a compelling long opportunity at current levels, supported by expectations that the Reserve Bank of Australia will ease policy more gradually than the U.S. Federal Reserve.
The bank forecasts 75 basis points of rate cuts from the RBA through Q1 2026, compared to 100 basis points from the Fed—helping to preserve a relative yield advantage for the Aussie.
On the daily chart, AUD/USD remains within a well-defined ascending channel that began in late 2024. The pair recently bounced off the lower boundary of the channel near 0.6450, with long lower wicks potentially indicating dip-buying interest.
Immediate resistance could sit at 0.6600, followed by a major zone near 0.6670. A break above these levels could confirm bullish continuation.

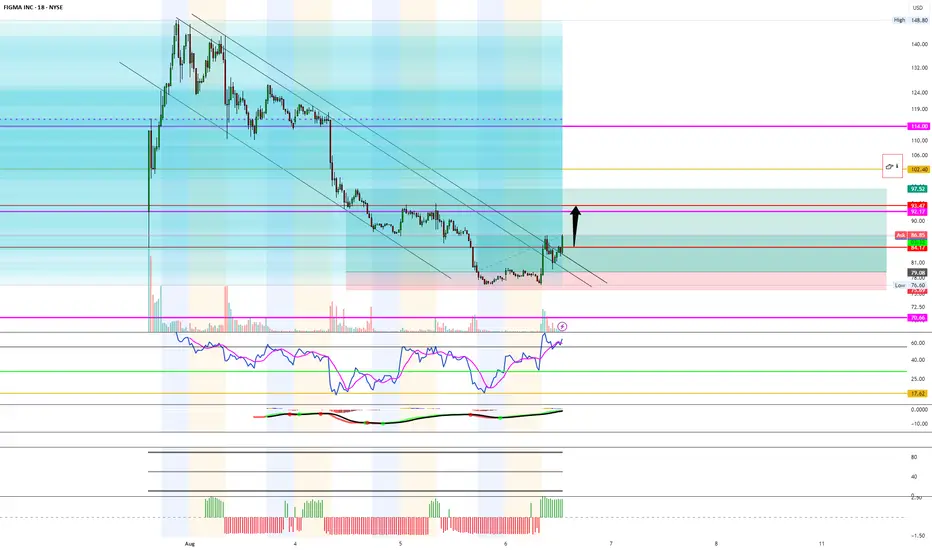
Just like WeBull... but more riskyAs we see from the chart we are breaking out of the downtrend and trying to find resistance.
The most important thing to watch is how the support is found when retesting, if any at all.
Key level for profit taking is at $96 and $102. Stay focused as it could lose support quick. But, from todays candle I think the odds are in my favor.
SHOP watch $126.79-127.28: Major Resistance may start a RetraceSHOP surged into a significant resistance at $126.79-127.28.
Zone of a Golden Genesis fib paired with a Covid Simulus fib.
Looking for a Break-n-Retest or Dip-to-Fib for long entries.
.

Cup and handle pattern observed in premier energies Cup and handle pattern observed in premier energies.
1150 neckline
Target 350 points after breakout of neckline.
So enter the trade after 1170
Target will be 1500

Gold Bulls Unshaken, 3400 in FocusGold prices retreated from a high of 3385 today, currently hitting a low near 3358. How far will gold fall? Are the bears back in control? I'm not worried about a gold pullback, but rather a lack of one, because only a pullback can provide a good entry opportunity. Clearly, I remain bullish on gold and optimistic about it reaching the 3400 mark.
Because gold fell all the way to around 3358, some voices in the market began to tout the strong return of the bears, but I remained unmoved. When many people were once in self-doubt, I was quietly taking advantage of the gold pullback to accumulate funds in batches and pick up bargains. We can clearly see that gold did not destroy the bullish structure during the decline, and as gold rebounded, the 3360-3350 area has become a dense trading area, indicating strong buying support. After the technical top and bottom conversion, it has become a relatively solid support area. It may be difficult for gold to fall below this support area in the short term.
So, why has gold repeatedly encountered resistance and retreated? I believe that gold has encountered resistance and retreated in the 3385-3390 area many times in order to repeatedly test the effectiveness of support and consolidate the strength of support. It is also to increase liquidity during the retreat period, thereby accumulating more upward momentum so that gold can rise further and break through the 3400 mark.
So I still hold a long position in gold, and I have not lost confidence in the gold bulls. On the contrary, I still expect that gold will be able to hit 3400 in one fell swoop after repeatedly testing the support, or even continue to rise to the 3420-3430 area.

PWAS/USDT BIG PUPMPBreak down trend in daily time frame & now probably Big pump for Paws this bad shit coin is coming!

BTCUSD LongThe broader market structure on BTCUSD remains bullish following a clean Change of Character (CHoCH) at 119,839, which signaled the end of the previous downtrend. This was later confirmed by a Break of Structure (BOS) to the upside. After forming a higher low near $111,903.68, price has steadily climbed, creating a sequence of higher highs and higher lows. This structure suggests the market is in a bullish continuation phase.
A strong demand zone is evident between $113,800 and $114,400, where buyers previously stepped in aggressively, leading to a sharp rally. The price barely consolidated in this area before moving upward, confirming it as a solid zone of interest. Above current price, there's a large supply zone between $118,400 and $119,600, where price last dropped sharply—indicating strong selling pressure.
Currently, price is trading around $115,300, just below the 0.5 retracement level at $115,871, and has printed bullish momentum candles into this resistance area. The most likely price action is a pullback into the green demand zone ($114,400–$114,000) before resuming upward toward the supply zone around $118,400–$119,600.
Trade bias: Bullish
Expected direction: Upward after a possible pullback
Invalidation level: Break below $113,800 would invalidate short-term bullish bias
Momentum condition: Momentum currently favors buyers, with strong bullish candles and higher lows
Candle behavior: No signs of exhaustion yet, indicating strength in the move

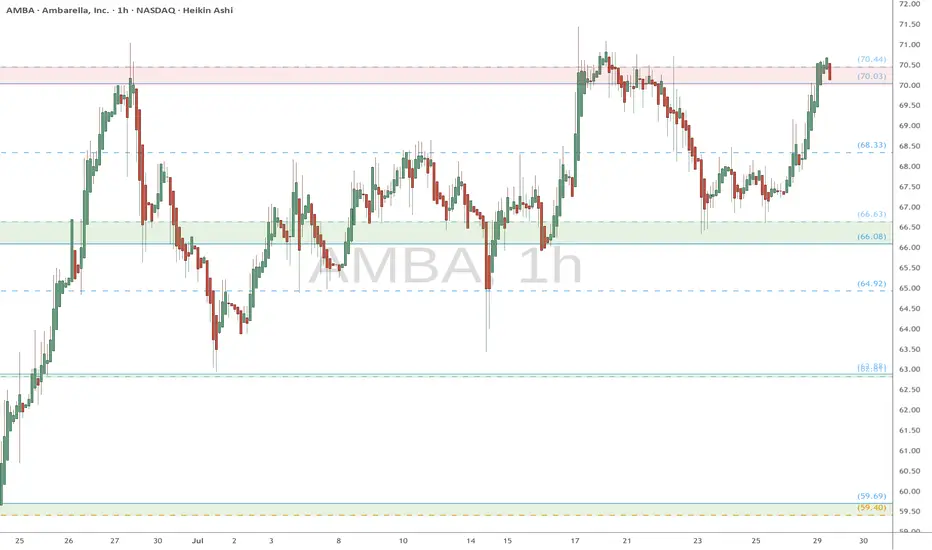
AMBA watch $70.03-70.44: Proven resistance holding up new highs AMBA has been trying to float upwards with the market tide.
Currently struggling against a proven resistance $70.03-70.44
Looking for a Break-n-Retest ideally or Dip-to-Fib for entries.