CADJPY SWING: SHORT OPPORTUNITYHi there,
Just like my short expectation on the GBPJPY analysis I shared, I would like to see CADJPY trade lower.
My reasons are well annotated on the chart. But I'd urge you to look at the 3M chart and see where we are in terms of support and resistance levels.
Anyways, I wish you good trading.
Cheers,
Jabari
Support and Resistance

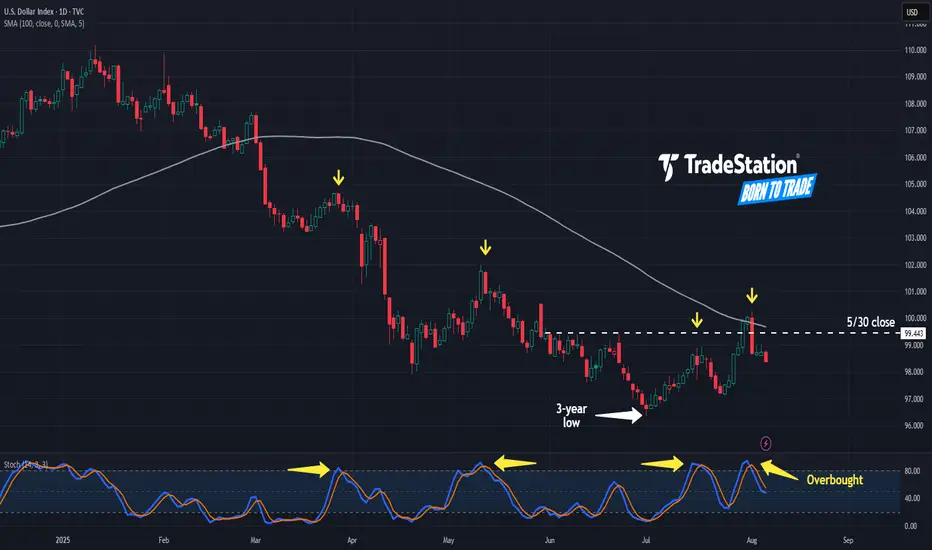
More Downside in the Greenback?The U.S. Dollar Index began 2025 with a dramatic slide. Now, after a period of consolidation, some traders may see further downside risk.
The first pattern on today’s chart is 99.443, the closing price for both a week and the entire month of May. DXY tested above the level between July 30 and August 1. It got rejected after the Labor Department revised payroll data lower. Has resistance been confirmed?
Second, the reversal occurred at the falling 100-day simple moving average. That may reflect bearishness over the longer term.
Third, stochastics have dropped from an overbought condition. Notice how those turns have occurred at other short-term peaks (marked in yellow).
Finally, traders may focus on news flow and catalysts with the White House expected to announce a replacement for Federal Reserve Governor Adriana Kugler this week.
TradeStation has, for decades, advanced the trading industry, providing access to stocks, options and futures. If you're born to trade, we could be for you. See our Overview for more.
Past performance, whether actual or indicated by historical tests of strategies, is no guarantee of future performance or success. There is a possibility that you may sustain a loss equal to or greater than your entire investment regardless of which asset class you trade (equities, options or futures); therefore, you should not invest or risk money that you cannot afford to lose. Online trading is not suitable for all investors. View the document titled Characteristics and Risks of Standardized Options at www.TradeStation.com . Before trading any asset class, customers must read the relevant risk disclosure statements on www.TradeStation.com . System access and trade placement and execution may be delayed or fail due to market volatility and volume, quote delays, system and software errors, Internet traffic, outages and other factors.
Securities and futures trading is offered to self-directed customers by TradeStation Securities, Inc., a broker-dealer registered with the Securities and Exchange Commission and a futures commission merchant licensed with the Commodity Futures Trading Commission). TradeStation Securities is a member of the Financial Industry Regulatory Authority, the National Futures Association, and a number of exchanges.
TradeStation Securities, Inc. and TradeStation Technologies, Inc. are each wholly owned subsidiaries of TradeStation Group, Inc., both operating, and providing products and services, under the TradeStation brand and trademark. When applying for, or purchasing, accounts, subscriptions, products and services, it is important that you know which company you will be dealing with. Visit www.TradeStation.com for further important information explaining what this means.
NZD_USD LOCAL SHORT|
✅NZD_USD is going up now
But a strong resistance level is ahead at 0.5950
Thus I am expecting a pullback
And a move down towards the target of 0.5920
SHORT🔥
✅Like and subscribe to never miss a new idea!✅

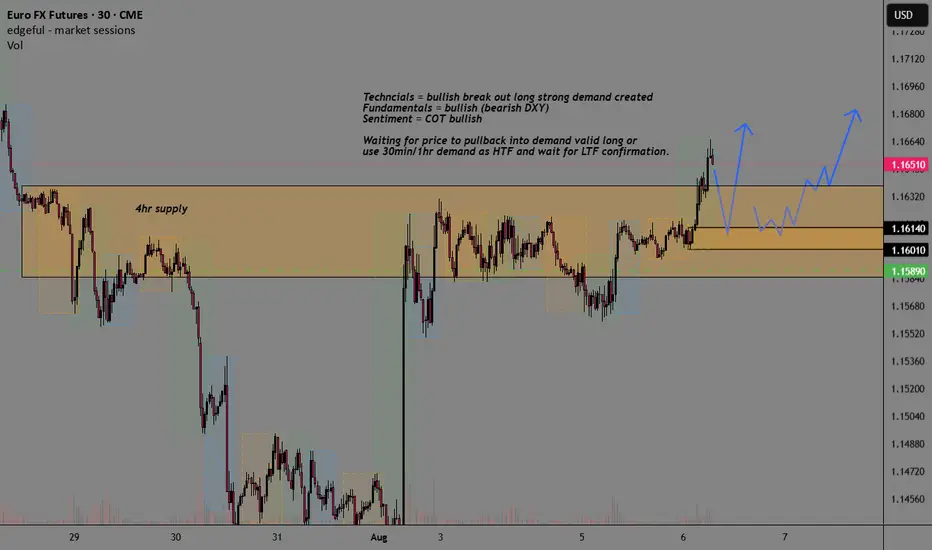
EUR EURUSD Supply-Demand Breakout Buy SetupSee chart for top-down analysis.
Looking at long if price pulls back into break-out level of demand with strong fundamentals, technicals, and sentiment COT reports.
Trade with me - my simple short term trading strategy - on BTCThis is a walk through of how I prepare and execute on one of my shorter-term and more simple trading strategies.
Unfortunately it's a longer video than I had hoped but feel free to watch sped up and skip around - most of the action happens towards the end but I offer a lot of great insights throughout for those with the time and patience to watch through.
Happy Trading :)

AMD eyes on $178: Serious Resistance zone that may give a DIPAMD bouncing back from market wide dump last week.
Approaching a significant resistance at $177.79-178.59
Look for a Dip-to-Fib ideally to green at $163.30-163.61

The bullish outlook remains unchanged, go long with the trend!Yesterday, the gold bulls refreshed the high point, and the daily line closed in the form of a medium-sized Yang line with a long lower shadow. The idea of continuing to be bullish in the short term remains unchanged, and what needs to be paid attention to is the strength of the retracement, which is similar to yesterday. The current support below is maintained at the 3355-3350 line of yesterday's rise. This position is also today's key support level, and the key suppression point above is maintained at the integer level of 3390-3400. This position may not be the end point. It was also mentioned yesterday that under the range of the previous large range of fluctuations, if either side does not break through, it will likely continue to fall into fluctuations. The current bullish trend is still relatively obvious, so we still maintain the idea of low-long operations. If your current operation is not ideal, I hope I can help your investment avoid detours. Welcome to communicate!
From the 4-hour analysis, the important support below is the 3355-3350 line. If the daily level stabilizes above this position, the bullish rhythm of falling back to lows and buying on the trend will remain unchanged. Before the daily level falls below the 3350 mark, you need to be cautious about shorting against the trend. I will provide you with the specific operation strategies at the bottom, please pay attention to them in time.
Gold operation strategy: Go long on gold when it retraces to around 3360-3350, target 3375-3385 area, and continue to hold if it breaks through.

EURUSD 60/15Current state is ranging before a huge green.
Game plan:
1. 15m is showing bullish, if 1h could BOS, then will go long.
2. If cannt BOS then will go for short. Make sure 15m has BOS too.

TMUS watch $227.03-227.69: Key support zone to end downtrend? TMUS has dropped a lot from its ATH a few months ago.
Currently testing a key support zone at $227.03-227.69
Look for a clean bounce to signal end of the downtrend.

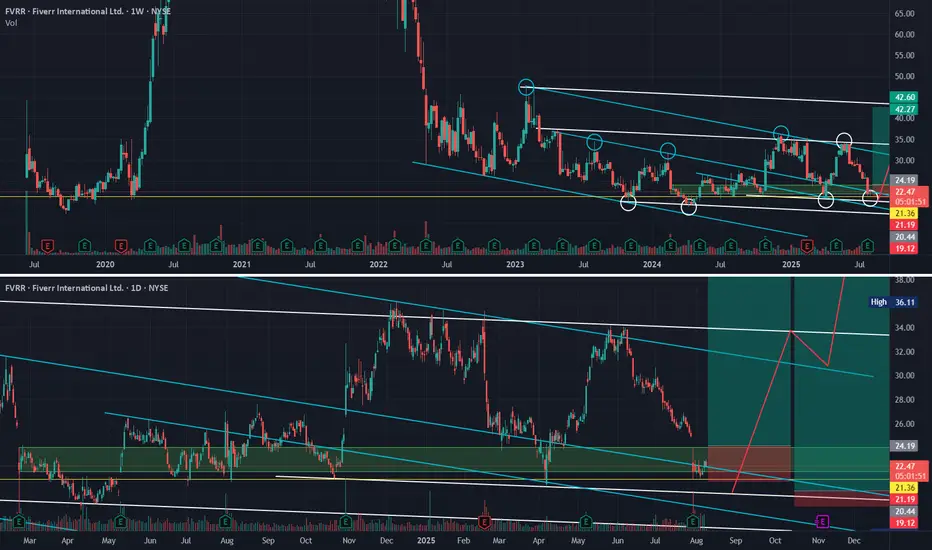
The stock that keeps on disappointing - Where & why I'm bullishFVRR. We all know the company. Many of us have probably waited patiently for a covid-like resemblance of the stock price. And yet here we are, sitting at $22, wondering if we'll ever reach $40 again.
I'm here to tell you, aside from the company being fundamentally strong and proving that with earnings and revenue growth YOY, the algorithms have got your back technically as well!
The overall reason I am technically bullish on this company and have been since April 2024 is the white algorithm as outlined by the white circles in the weekly chart above. Notice any time we are selling down and respecting teal/blue on the buy-side (blue circles), we hold and respect white taper (white circles) on the sell-side and allow for price to make it's way up back toward teal.
Once we prove the white algorithm on the buy-side as well, we will break out of this LTF consolidation and head toward HTF algorithms.
I want to prime you for three possible scenarios:
#1.
We are holding a very strong multi-year demand zone (green box). If we continue to hold this and close back above, as with every other time, it is a strong buy signal.
#2.
We are holding above a multi-year support zone at $21.70 (yellow line). This has held us (save for one or two liquidity grabs) since the company's IPO. Another attempt at this level will be a no-brainer scoop-up as far as R:R is concerned.
#3.
My prediction (and hope) is that we are trying, once again, to prove this white tapered algorithm on the sell-side. If we do that, we give price the ability/permission to break out of teal once and for all and head toward the fair-value pricing of this company (according to all the analysts - not me) in the $40+ range.
This is another one that may require a bit of patience to get the best case scenario - allowing for a push lower toward our HTF white algorithm.
In any case, I am still bullish on this chart - even with all the selling pressure and sideways movement.
Happy Trading :)
Ethereum breakoutEthereum monthly chart shows a clear breakout above the 3800 resistance, targeting 8k.

Gold is currently rising graduallyUp to now, the 1 long and 1 short position has earned a total profit of 400pips. First, I clearly positioned myself in the 3400 area for a short position. As expected, gold fell back under pressure, hitting a low near 3391. However, the decline lacked continuity, and after rebounding, it hit a stop-loss at 3395, exiting the position with a small profit-taking stop. I managed my risk and exited the position with a small profit-taking stop, earning 50 pips on each trade. I then re-introduced the long position strategy in the 3385-3380 area. As expected, gold fell to the target area and rebounded strongly, smoothly rising to the 3400 target. Both trades yielded a profit of 350 pips, a perfect execution of my plan. At a certain level in trading, technology is merely a tool; the true determinants of success or failure are mindset and execution. In this market where most people are destined to lose money, a reliable trading system is essential, but even more crucial is absolute execution. Ultimately, we trade not price, but conviction. We trade 2-5 trades daily, with a high win rate and high execution. We provide transparent profit reports daily. We maintain a steady pace and avoid blindly chasing orders. We share our strategies only occasionally, so please monitor the bottom of the market for specific entry tips and analysis of trading strategies. Choice is more important than effort. Only by identifying the direction can you make continuous profits.
In the short term, gold prices continued their upward trend in the previous trading day, relying on the support levels of 3370-3375. Gold prices finally broke through the 3400 mark, closing with a medium-sized bullish candlestick on the daily chart. Today's gold trend saw a rapid rise followed by a decline. This is particularly important to note: a surge often signals negative trends, a market principle we have repeatedly emphasized. Even if such a surge and decline doesn't directly trigger a decline, it will limit subsequent price gains. Therefore, it's not advisable to rush into the market. Even if considering a long position, wait for a sufficient correction before making a decision. The key support area below is 3385-3370, with 3370 being the intraday dividing line between long and short positions. If the upward trend continues, the correction should not fall below the previous low support level of 3370. If this support level is effectively broken, the upward trend structure will be disrupted, and a timely adjustment of the position is necessary.
The current market is still experiencing a large-scale, cyclical, and volatile pattern, rather than a completely unilateral trend. The reason for maintaining a long position this week is that after stabilizing at the 3268 support level, the market entered a period of relatively strong volatility. The mid-term bullish trend following the release of the non-farm payroll data failed to develop into a long-term bullish breakout. The upward trend was accompanied by periodic pullbacks, indicating an overall upward trend rather than a strong, one-sided market. Therefore, we maintain a bullish outlook, but we must not be blindly optimistic in our operations!
Gold Trading Strategy: We recommend buying gold in batches around 3385-3370, with a target of 3400-3410.

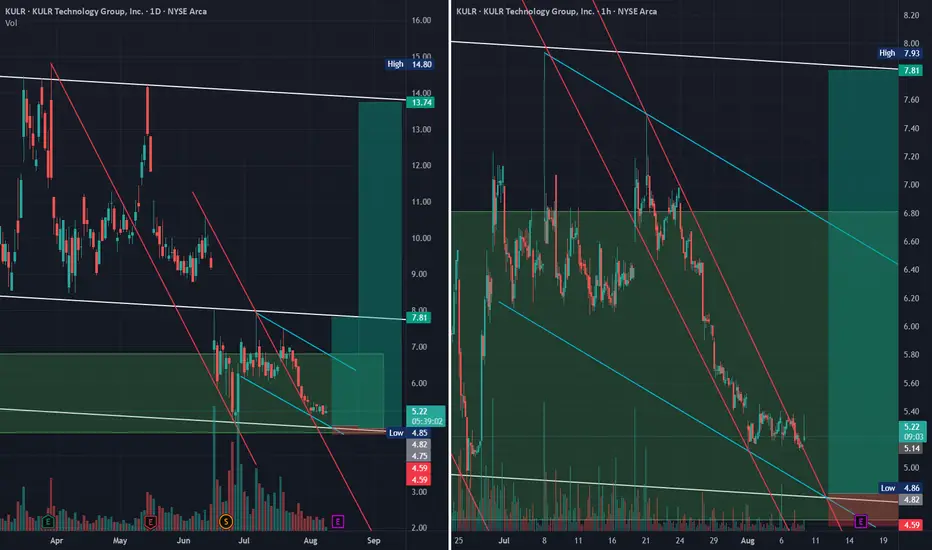
Once-a-year type of opportunity I believe KULR is going to offer us a long term opportunity that we rarely see.
I leave it up to the reader to do your own fundamental research, which I have done on my own and I have been convinced for quite some time - between both their core business receiving multiple large contracts and also their CEO's recent investments into bitcoin.
But I am a technical trader. And while I read a chart based on it's price action, it's even better when the stars align and I'm able to believe in the company too!
So here is my technical reasoning behind what I'm calling a "Once-a-year" opportunity - one that I believe can yield a 3-4x+ result if held confidently.
Background:
On a weekly chart you'll see that we've had many spikes and have toyed around in the teens multiple times. (You'll see moves higher but don't forget that this recently had a reverse stock split so keep that in mind when viewing this chart.)
Now prior to this stock split, since May, I was posting videos explaining why this will continue to drop until we reach our HTF target - to about .70 cents (pre-split. At the time, we were sitting around $1.30 and the bulls in the neighborhood were ready to blast off. So I was essentially just posting videos trying to warn everyone to wait.
At that time as well, we were selling down a strong red algorithm on the Daily - and you can see the massive gap down that happened when the reverse split was announced and continuously after it went into action.
Now enough with the background:
We have a beautiful tapered selling white algorithm that has been present over the course of this chart that allows for bullish liquidity to be built prior to breaking out. The bottom white algorithm that you see (that we are currently respecting and selling in) is a long-term algorithm that goes back over 3 years of price action.
You'll also notice the green demand box drawn that we have been playing around in since the split - that is a weekly demand dating back to a move that propelled us to $43 (post split price).
The buy that I've identified is sitting at around $4.70. I'm looking for this to be an area where both the white HTF algorithm is proven as well as the lower time frame teal algorithm (which you see is what is currently guiding us on the LTF and has allowed the breakout of red strong selling).
My Entry Plan:
Since we have the luxury of a LTF algorithm in teal, I am going to start averaging in smaller positions as we hold and prove the sell-side of teal. However, the bulk of my buy will be at around $4.70 wherein we prove and hold the white algorithm. I will have a tight stop-loss sitting below the large HTF demand zone (at around $4.50) which is why this trade can potentially yield a LTF R:R of 13 and HTF R:R of over 50!
I know this is not a trade we can take today or tomorrow like the BILL trade I posted about yesterday - BUT, this is one we can prepare for an expect to happen with continued price action heading directly toward our buy zone. Remember, I've been waiting patiently on this for over 3 months and I plan to continue holding out until we prove the HTF algorithms that are at play.
Happy Trading :)
USDJPY - on the way to somewhere...USDJPY has always had a reputation of a very "technical" instrument. Certainly it is not anymore.
Somewhat weird policy of the BOJ during pandemic changed a lot.
Now it creates something like THAS (two heads and shoulders :) or Modified Wyckoff Distribution pattern :)
Anyway, what I can see is the following:
- price respected the Support level at FR 61.8 of the uptrend impulse (Jan '23 - Jul '24) and reverted there three times
- Now is approaching the Resistance cluster in between 148.68 and 151.52. Perhaps it will respect it - but who knows?
Just my humble opinion

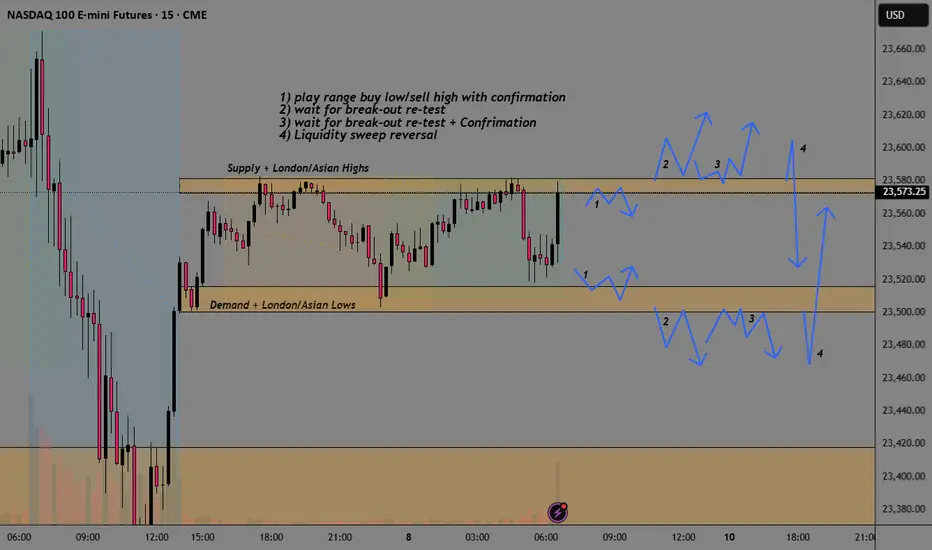
NQ Break-Out AnalysisSee chart from analysis of different options depending on the type of trader and what others are looking at.
1) play range buy low/sell high with confirmation
2) wait for break-out re-test
3) wait for break-out re-test + Confirmation
4) Liquidity sweep reversal
Bitcoin Go 140kAfter a strong break of the trend line, it is ready to launch to the targets of 125,000, 132,000, and 142,000. The MACD and RSI also gave a bullish signal.
125000
132000
142000
🤪🤪🤪

Gold in Tight Range – Breakout Above 3402 or Below 3383?GOLD – Market Overview
Gold is currently consolidating within the 3402 – 3384 range, awaiting a breakout for the next directional move.
Technical Outlook
Bullish Scenario:
A 1H close above 3402 would likely extend the bullish trend toward 3418 and 3436, with further potential toward 3447.
Bearish Scenario:
A 1H close below 3383 could trigger a move down to 3365, and possibly 3348.
🔹 Pivot Line: 3408
🔹 Resistance: 3418 – 3436 – 3447
🔹 Support: 3383 – 3365 – 3348

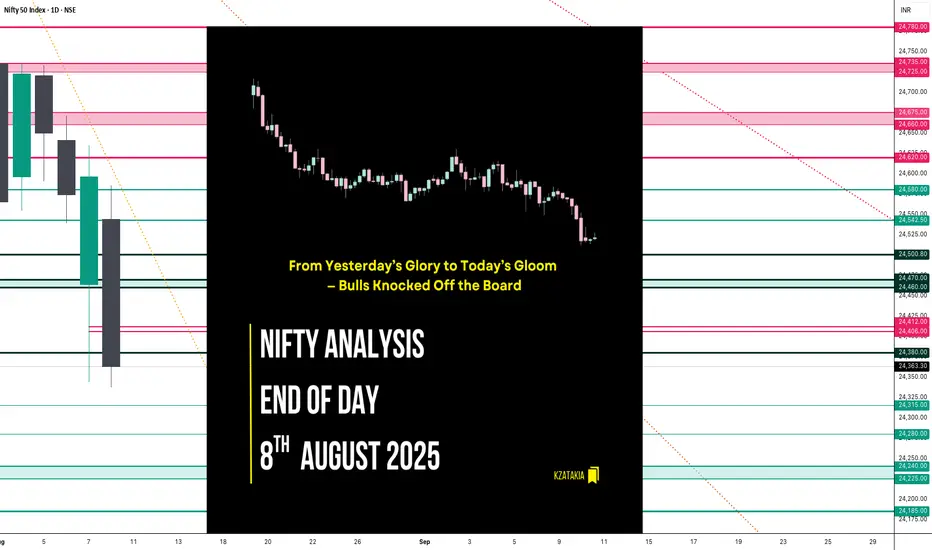
Nifty Analysis EOD – August 8, 2025 – Friday🟢 Nifty Analysis EOD – August 8, 2025 – Friday 🔴
From Yesterday’s Glory to Today’s Gloom — Bulls Knocked Off the Board
Today’s market was a textbook case of how quickly momentum can flip. Yesterday’s 289-point bullish surge was completely erased, with Nifty ending deep in the red and closing at the day’s low. Sellers clearly had the upper hand, leaving little room for bulls to breathe.
🗞 Nifty Summary
Friday opened with a 65-point gap-down — right below the crucial 24,580 support zone — and that level instantly showed rejection.
In the first 45 minutes, Nifty slipped 150 points from the day high and 200 points from the previous day high. The key Fibonacci retracement level from yesterday’s range — 24,406 ~ 24,412 — played the role of intraday savior multiple times, offering support and holding the market within a narrow zone for most of the day.
However, the bulls’ defense cracked after 3:00 PM. The support broke, triggering a sharp slide below 24,380 and even the Previous Day Low (PDL).
The upside was capped by 24,470 ~ 24,460, while 24,406 ~ 24,412 remained the battleground for most of the day until the breakdown.
In a single session, yesterday’s dramatic 289-point recovery rally was completely erased — with Nifty closing at the bottom of the PDL and CDL.
Today’s close is now below the low of 12th May, marking a 64-session (88-day) low.
Now the question for Monday: will bearish momentum extend, or will some positive news bring bulls back into play?
🛡 5 Min Intraday Chart with Levels
Intraday Walk
🔻 Gap-down open below major support at 24580.
⏳ First 45 minutes: Steep drop of 150 points from the day high.
🛡️ Fib support at 24406–24412 holds multiple times… until the late break.
🔻 Post 3 PM: Support collapse leads to fresh lows below PDL.
📉 Close near day’s low — erasing yesterday’s bullish rally.
📉 Daily Time Frame Chart with Intraday Levels
🕯 Daily Candle Breakdown
Open: 24,544.25
High: 24,585.50
Low: 24,337.50
Close: 24,363.30
Change: −232.85 (−0.95%)
Structure:
Real Body: 180.95 pts (Red Candle — Close < Open)
Upper Wick: 41.25 pts
Lower Wick: 25.80 pts
Interpretation:
Strong bearish sentiment — sellers maintained control from open to close.
Very small lower wick — indicates conviction from sellers in closing near the low.
Wiped out prior day’s gains — buyers have lost the short-term edge.
Candle Type:
Bearish Marubozu (near-full body) — signals decisive selling pressure, often a continuation pattern after weakness.
🛡 5 Min Intraday Chart
🥷 Gladiator Strategy Update
ATR: 210.45
IB Range: 134.05 → Medium
Market Structure: Balanced
Trade Summary:
10:35 AM – Short Entry → SL Hit
📌 What’s Next? / Bias Direction
Below 24,400: Bearish momentum likely to extend toward 24,250–24,200.
Above 24,470: Only a strong reclaim can shift bias back to neutral.
Gap-down/weak open on Monday may accelerate selling; bounce attempts will face resistance at 24,400–24,470.
🔍 Support & Resistance Levels
Resistance Zones:
24,406 ~ 24,412
24,460 ~ 24,470
24,500
24,580
Support Zones:
24,315
24,280
24,240 ~ 24,225
24,185
💬 Final Thoughts
"Markets don’t turn on hope — they turn on price. Respect the levels, and let price lead the story."
Bulls had the glory on Thursday, but Friday flipped the script completely. The market now sits at a multi-month low — momentum favors bears, but Monday’s open will decide if we see follow-through selling or a sharp dead-cat bounce.
✏️ Disclaimer
This is just my personal viewpoint. Always consult your financial advisor before taking any action.
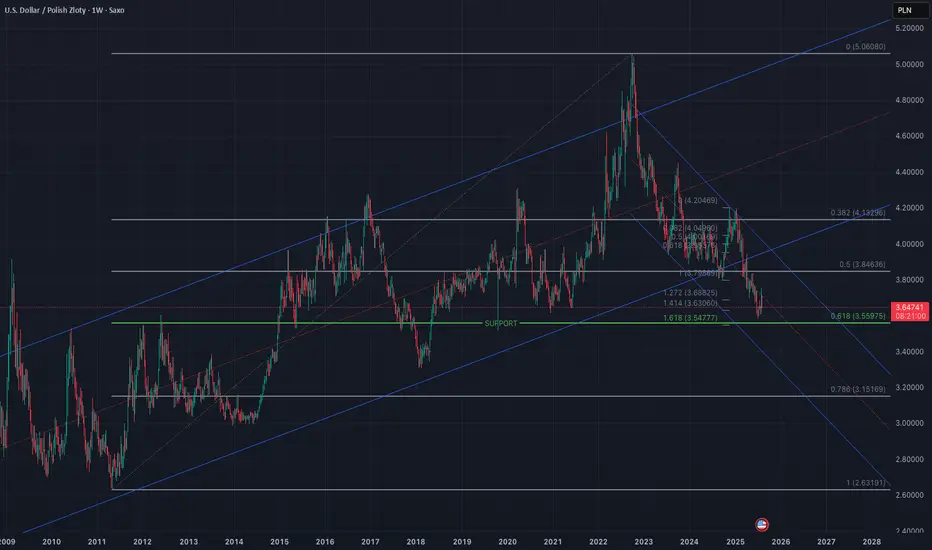
USDPLN - getting to the Support (W1)Polish zloty has recently been a very popular asset to invest.
Probably is has been so because of high Interest Rates and weakness of USD overall
Now, however, like EUR, it is coming to a significant technical support at 3.5597, where we have FR 61.8 of the multiyear uptrend move (starting in April 2011 - Yes) confirmed with FR 161.8 of the latest significant correction. This level has been respected by the market many time before.
I have no idea what US administration is going to invent yet and ho it will impact the markets. Yet, if technicals count, this is the level to watch.
Just my humble opinion.
GBPUSD Potential UpsidesHey Traders, in today's trading session we are monitoring GBPUSD for a buying opportunity around 1.33900 zone, GBPUSD is trading in an uptrend and currently is in a correction phase in which it is approaching the trend at 1.33900 support and resistance area.
Trade safe, Joe.

How to correctly plan gold trading opportunitiesExpectations for Federal Reserve policy remain dovish, providing bullish support for gold prices. Weak US non-farm payroll data for July, coupled with a second consecutive week of rising jobless claims, suggests a weakening labor market. According to data released by the US Department of Labor, initial jobless claims rose to 226,000 in the week ending August 2nd, the highest level since early July, reflecting a significant slowdown in employment momentum.
Technically, gold continued its upward trend, reaching an intraday high of 3409 before quickly retreating to around 3380, mirroring yesterday's trend. The market remains volatile, with the 3410-3420 range as the key resistance level. Avoid blindly chasing higher prices in the short term. Support is currently in the 3380-3365 range, with a potential dip buy opportunity if it stabilizes.

SHORT ON GOLD (XAU/USD)GOLD has a nice rising channel which is a (BEARISH) reversal pattern with plenty of sell side liquidity to be captured to the downside.
I sold GOLD at 3397 and expect Gold to fall over $80-$100 which is 800-1000 pips.

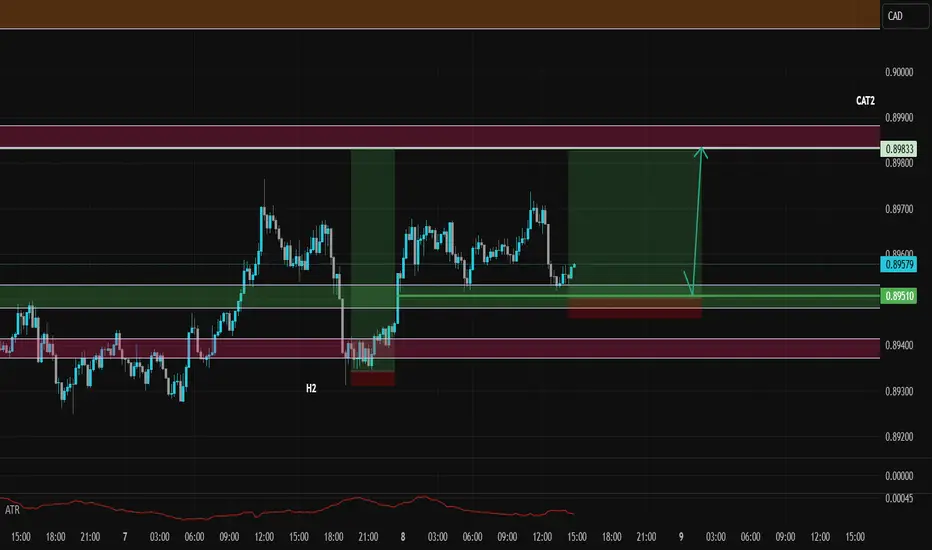
Sniper Entry on AUDCAD - SMC Concepts - Trade Code RevealedAlright snipers, here it is!
From today onwards, I will publish my live trades. My A+ setups.
In this one, I follow the H2 game ( Bullish) as there is no other game played at the moment on this pair contradicting my story.
Story says, H8 bullish, H2 bullish, BOS confirmed. Now market is mitigating towards an imbalance left behind and visible on m15/m8.
I am expecting this last point of true mitigation to be reached, inducing the last swing buyers who believe the market has to go up.
Also a very important info: market will break through the low of Asia and low of Europe sessions before taking off (0.89519)
No sign of reversal move either, H8 candles are closing above the H8 S/R. No sign of H2 or m30 reversal candlestick pattern (Rejection + Acceleration or Supply Zone). So we're good to go.
Enjoy this trade! See you on the one...