EURNZD new bearish expected
OANDA:EURNZD in last period price is have upside-downsides moves, price is make again bounce on strong zone (1.91000), yesterday we are have and RBNZ, how looks from here we wil lcan expect higher bearish trend.
SUP zone: 1.91000
RES zone: 1.85000, 1.83500
Supportandresistancezones

GBP/USD Breakout (28.05.2025)The GBP/USD Pair on the M30 timeframe presents a Potential Selling Opportunity due to a recent Formation of a Breakout Pattern. This suggests a shift in momentum towards the downside in the coming hours.
Possible Short Trade:
Entry: Consider Entering A Short Position around Trendline Of The Pattern.
Target Levels:
1st Support – 1.3424
2nd Support – 1.3380
🎁 Please hit the like button and
🎁 Leave a comment to support for My Post !
Your likes and comments are incredibly motivating and will encourage me to share more analysis with you.
Best Regards, KABHI_TA_TRADING
Thank you.
Disclosure: I am part of Trade Nation's Influencer program and receive a monthly fee for using their TradingView charts in my analysis.

PLUG 1H Long Swing Conservative Trend TradeConservative Trend Trade
+ long impulse
+ 1/2 correction
+ volume zone
- strong approach
+ ICE level
+ support level
+ volumed Sp
Calculated affordable stop limit
1 to 2 R/R take profit
Daily Trend
"- short impulse
+ volumed TE / T1 level
+ support level
+ biggest volume 2Sp-
+ weak test"
Monthly Trend
"+ long impulse
+ support level
+ T2 level
+ biggest volume reaction bar
= below 1/2 correction"
Yearly CounterTrend
- short impulse
Will add more after successful test on 1H and / or after test completes on 1D.

MAXHEALTHCARE - Could Breakout from DTHMAXHEALTHCARE has resistance weakening on the Daily charts and may give a breakout with good volume in coming days.
The target of this pattern signals an upside potential of 15% from the current price level in the medium term.
The stock is trading above its 50- and 100-day exponential moving averages (EMAS) recently. Look for the range to more than 1.5X, and the Volume 1.5X the average.
CMP- Rs. 1149
Entry Price- 1200
Target Price- Rs1380 (15% upside)
SL- 1142
Need to wait for the entry to get triggered.
Disclaimer: This is not a buy/sell
recommendation. For educational purpose only. Kindly consult your financial advisor before entering a trade.

DEEPAK FERTILIZER - Breaking Out in DTF, New ATHDEEPAKFERT has resistance weakening on the Daily charts and has given a breakout with good volume and making a new ATH.
The target of this pattern signals an upside potential of 20% from the current price level in the medium term.
The stock is trading above its 50- and 100-day exponential moving averages (EMAS). The range is more than 1.5X, and the Volume is also 1.5X the average.
CMP- Rs. 1449.80
Target Price- Rs. 1650 (~20% upside)
SL- 1356
Disclaimer: This is not a buy/sell
recommendation. For educational purpose only. Kindly consult your financial advisor before entering a trade.

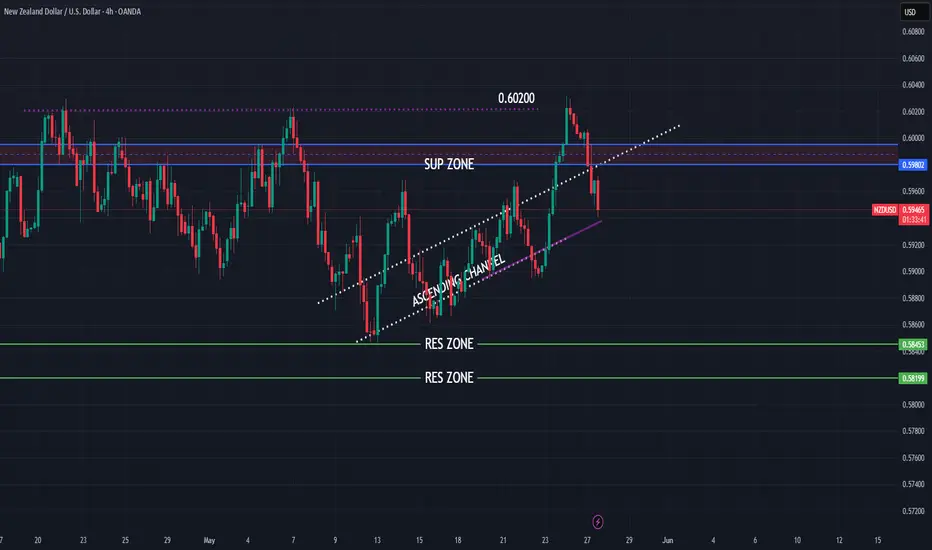
NZDUSD higher falls expecting
OANDA:NZDUSD ASCENDING CHANNEL visible, we are have break of same on 23.5, price is start pushing but on first res zone (0.60200), price is start making reverse.
Currently again in ASCENDING CHANNEL expectations for this week are to see break and bearish push.
SUP zone: 0.59800
RES zone: 0.58450, 0.58200
EURCHF both scenarios possibles
OANDA:EURCHF UPDATE from first analysis (attached) we are have upside - downside moves, new trend line is created, sup zone is created (violet line) and we can see also long zone.
If we see break of 0.94000 we will be higly possible in bullish move, break of sup zone (violet line) we will can see bearish move.
Currently still giving higher chances for bearish trend, but lets see some stronger moves.
SUP zone: 0.93850
RES zone: 0.92750, 0.92550

EURJPY still to expect bearish for new week
OANDA:EURJPY strong bearish bounce from top line of price action, currently price in rectangle and on bottom line of price action.
EUR with all showing self the weakest in last periods and expectations are still to see weaknes, here expecting break of rectangle and trend line of PA and higher bearish continuation till res zone.
SUP zone: 163.300
RES zone: 160.600

XAUUSD LONG AND SHORT Hi Guys,
Weekly VP prints out some important levels, which I have marked on the chart. Each of those levels acts as a support level therefore buyers showing up is expected. Break below 294 and confirmation would result in price further dropping to 272.
Also 316 and levels above it have been marked as resistance and seller showing up is expected.
Make sure add your own logic into this before taking any position.
Be honorable

NZDCHF - Bullish - BUYCALL BULLISH INDICATIONS:
1- Market currently in consolidation phase with in a down channel
2- market has bounced back from good support level
3- if the market break the last LH / neckline, we can enter into the market with
a TP of R:R of 1:1 and the Stoploss slightly below the LL or the Support level.

USD/JPY - H1 - Channel Breakout (17.05.2025) The Pair on the H1 timeframe presents a Potential Selling Opportunity due to a recent Formation of a Channel Breakout Pattern. This suggests a shift in momentum towards the downside in the coming hours.
Possible Short Trade:
Entry: Consider Entering A Short Position around Trendline Of The Pattern.
Target Levels:
1st Support – 142.40
2nd Support – 140.17
🎁 Please hit the like button and
🎁 Leave a comment to support for My Post !
Your likes and comments are incredibly motivating and will encourage me to share more analysis with you.
Best Regards, KABHI_TA_TRADING
Thank you.
Disclosure: I am part of Trade Nation's Influencer program and receive a monthly fee for using their TradingView charts in my analysis.

Though still in Uptrend, but BNL Closed at 37.39 (25-03-2025)
Though still in Uptrend, but
as mentioned earlier, bearish divergence
has started appearing on bigger tf, so
cautious approach should be taken.
It may re-test 35.20 - 36.20 & bounce as this
is an important Support level.
Otherwise next Support seems to be around
32.30 - 32.50

Play on LevelsGGL - Closed at 15.67 (23-05-2025)
Ideal Support levels:
S1 around 15.07 - 15.15
S2 around 13.86 - 14
S3 around 12.80 - 13
Upside targets can be around 17-18
if these supports are respected.

USD/CAD - Triangle Breakout (23.05.2025)The USD/CAD Pair on the M30 timeframe presents a Potential Selling Opportunity due to a recent Formation of a Triangle Breakout Pattern. This suggests a shift in momentum towards the downside in the coming hours.
Possible Short Trade:
Entry: Consider Entering A Short Position around Trendline Of The Pattern.
Target Levels:
1st Support – 1.3792
2nd Support – 1.3760
🎁 Please hit the like button and
🎁 Leave a comment to support for My Post !
Your likes and comments are incredibly motivating and will encourage me to share more analysis with you.
Best Regards, KABHI_TA_TRADING
Thank you.
Disclosure: I am part of Trade Nation's Influencer program and receive a monthly fee for using their TradingView charts in my analysis.

PEAQ — Fibonacci Meets Wyckoff Structure +100% SetupAfter more than 70 days of sideways action, PEAQ is finally showing signs of life — with a well-defined structure that suggests accumulation is giving way to a potential new trend.
What we’re seeing aligns closely with a classic Wyckoff Accumulation pattern. A local bottom formed around the psychological $0.10 level, followed by a clean breakout — marking a potential Sign of Strength (SOS).
Now comes the real opportunity.
Wyckoff Accumulation Structure
Following the long consolidation range:
🔹 Phase D: Breakout from range = Sign of Strength (SOS)
🔄 Current: Pullback = potential Last Point of Support (LPS)
The recent correction has now retraced into the 0.786 Fib zone of the impulse wave — a deeper but still healthy retracement for Wyckoff structure. Notably, this level also coincides with the previous highs that PEAQ broke out from, now flipping into support. A perfect test of demand.
🔍 Confluence Zone Breakdown
0.786 Fibonacci retracement: ~$0.1312
Previous highs: ~$0.14
Monthly open: $0.1289 (ideal invalidation level)
These overlapping signals create a tightly packed support zone that defines the next high-probability long setup.
🟢 Long Setup — 0.786 ($0.1312)
Entry: $0.1312
Same stop-loss: $0.125 (below mOpen)
Targets: $0.2589 and 1.618 Trend-Based Fib Extension target at $0.2694
R:R: ~16:1+
Potential upside: +100%+
📘 Educational Insight: Wyckoff Meets Fibonacci
This setup is a combination of Wyckoff theory and Fibonacci structure:
SOS breakout signals strength
LPS pullback into 0.786 Fib = high-probability continuation zone
Previous highs now acting as support
When structure, confluence, and psychology align — you don't chase. You wait.
📌 Summary
✅ 70+ days of accumulation
✅ SOS confirmed
🔁 Now retracing to LPS around $0.131
🔒 Monthly open provides clear invalidation
🎯 Targets: $0.2589 and $0.2694
💰 Potential R:R: 16:1+
Each chart is a lesson. Read it with patience, trade it with purpose.
___________________________________
If you found this helpful, leave a like and comment below! Got requests for the next technical analysis? Let me know.

GBP/USD - Triangle Breakout (23.05.2025)The GBP/USD pair on the M30 timeframe presents a Potential Buying Opportunity due to a recent Formation of a Triangle Pattern. This suggests a shift in momentum towards the upside and a higher likelihood of further advances in the coming hours.
Possible Long Trade:
Entry: Consider Entering A Long Position around Trendline Of The Pattern.
Target Levels:
1st Resistance – 1.3502
2nd Resistance – 1.3534
🎁 Please hit the like button and
🎁 Leave a comment to support for My Post !
Your likes and comments are incredibly motivating and will encourage me to share more analysis with you.
Best Regards, KABHI_TA_TRADING
Thank you.
Disclosure: I am part of Trade Nation's Influencer program and receive a monthly fee for using their TradingView charts in my analysis.

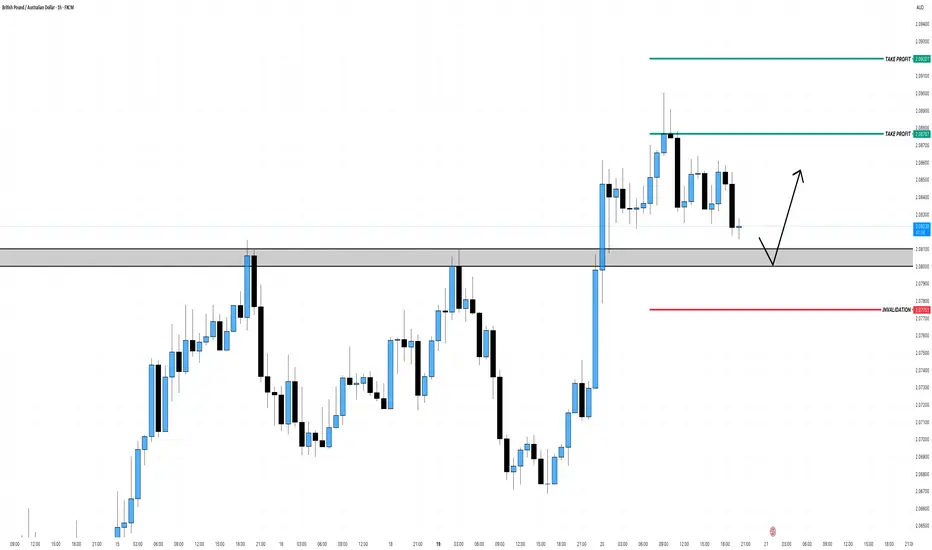
GBPAUD Bullish Break and RetestAfter weeks of consolidation, GBPAUD has broken out above key resistance at 2.0800–2.0830, flipping structure to bullish on the higher timeframes. Price is now retesting this zone.
Wait for bullish confirmation.
EURGBP new fall expecting
OANDA:EURGBP whats next, we are have break of DESCENDING TRIANGL, then its be created DESCENDING CHANNEL, which also is be breaked, now we have breaked and trend line.
Price currently is in zone. Expectations are to see break of zone and higher bearish fall.
SUP zone: 0.84600
RES zone: 0.83500, 0.83200

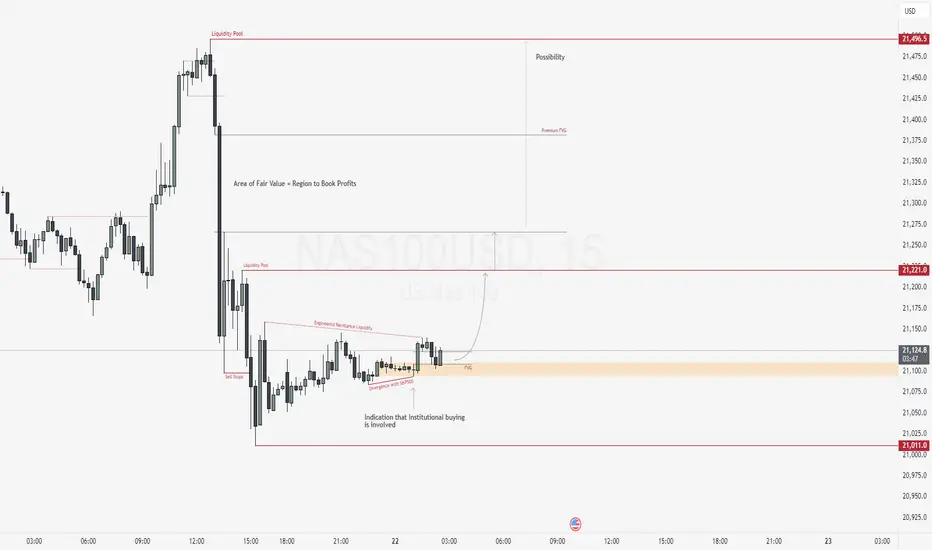
NAS100USD: SMT Divergence Signals Reversal from Discount PricingGreetings Traders,
In today’s analysis, we are closely monitoring NAS100USD for a potential reversal of bearish institutional order flow. While the broader trend has been bearish, current price action presents strong confluence for a bullish shift, suggesting an opportunity to align with a possible upside move.
Market Context:
NAS100USD is currently trading in deep discount territory, which historically presents favorable conditions for institutional accumulation. We’ve observed a liquidity sweep—price took out previous sell stops—suggesting institutions may have order-paired against willing sellers at these discounted levels.
Key Observations:
SMT Divergence with S&P500: While the S&P500 took out its previous low, NAS100USD remained above its corresponding low. This divergence signals underlying strength and institutional buying on NAS100USD, offering a strong indication of a reversal.
Bullish Structure Hints: Minor breaks in market structure to the upside are emerging, further validating the bullish narrative.
Institutional Support Zone: Price is currently trading inside a bullish order block that is also aligned with a Fair Value Gap (FVG)—a strong confluence zone that may act as support for continued upside movement.
Trading Strategy:
Await confirmation of support holding within the order block and FVG zone.
Target 1: Relatively equal highs just above current price action—an engineered liquidity pool where buy stops are likely resting.
Target 2: The premium FVG, a key area of institutional interest where longs accumulated at a discount will be offloaded for profit. The area of fair value is an region where the institutions start to book their profits.
By reading the divergence, price action, and institutional behavior, we can strategically position ourselves to capitalize on a high-probability reversal.
Happy Trading,
The Architect 🏛📊
AUDJPY higher bearish for expect
OANDA:AUDJPY interesting structure, trend line is breaked and we can see bearish flag also is breaked.
Currently here expecting to see higher fall.
SUP zone: 93.600
RES zone: 91.500, 90.600

EURGBP: Potential sell setup towards 0.8500?OANDA:EURGBP has reached a notable resistance level, an area that has been a clear turning point in the past, leading to some notable reversals. Given this, there is once again potential for a bearish reaction if price action confirms rejection, such as a bearish engulfing candle, long upper wicks or increased selling volume.
If the resistance level holds, I anticipate a downward move toward 0.8500 , which for me is quite an achievable target now.
But if the price breaks above this zone and sustains above it, the bearish outlook may be invalidated, leading to further upside.
Just my take on support and resistance zones, not financial advice. Always confirm your setups and trade with solid risk management.

NZDCAD bearish expectations after RBA
OANDA:NZDCAD price action visible, price currently in ascending channel, moving zig-zag last two weeks, here after yesterday RBA, having bearish expectations.
Break of violet doted line can be taked for confirm.
SUP zone: 0.82700
RES zone: 0.81500

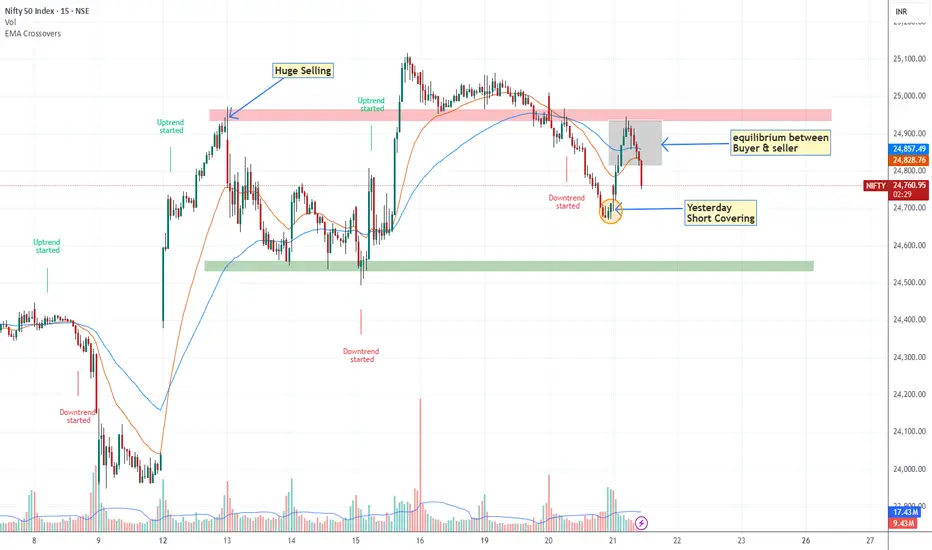
Nifty Might Range-Bound until it doesn't break 24950 levelToday 21/05/2025 around 11 O clock Nifty Tested 24950 the push was not above average volume driven that's why market was going to pullback although something absence of sellers comparatively had seen on 13 may u can see on chart but still it required to break 24950 level with good volume for being upward journey, until we expect market may range between 24500-25000.
strong Resistance- 24950-25000
Strong Support -24500