Hidden Bullish Divergence
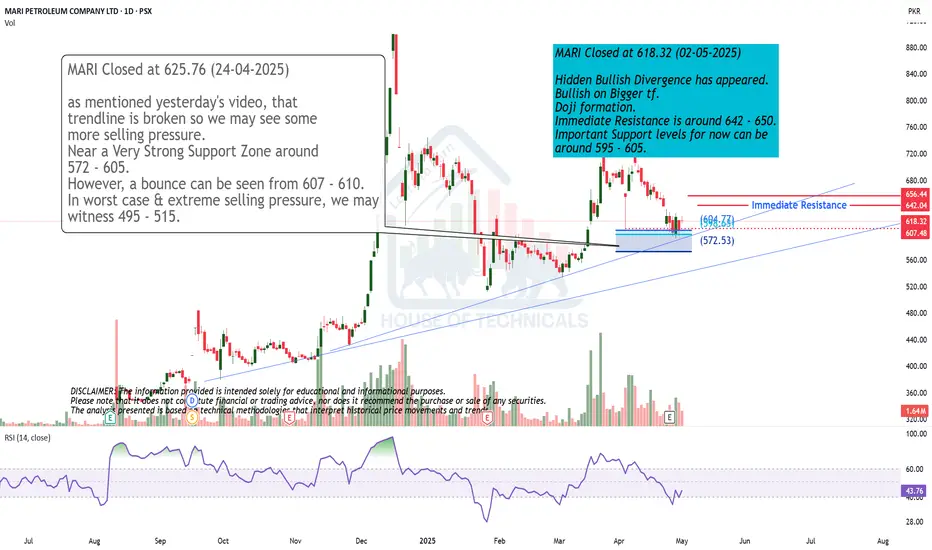
Hidden Bullish Divergence has appeared.
Bullish on Bigger tf.
Doji formation.
Immediate Resistance is around 642 - 650.
Important Support levels for now can be
around 595 - 605.
Supportandresistancezones
H&S Pattern
Though H&S Pattern has formed but
Currently at an Important Support around
200 - 202.
Next Support lies around 193 - 196.
Though there is Bullish Divergence on
shorter time frame but its resistance is
around 226 - 231

Bearish Divergence appeared.Bearish divergence appeared on Daily as well as
Weekly TF.
Strong resistance is there around 127 - 129.
Once this level is Crossed, we have open ways
towards 145 - 147
On the flip side, we have a good support around
120-122. However, breaking 116 this time will bring
more selling pressure towards 113 initially.

Bullish on bigger time frames.
Bullish on bigger time frames.
Took support from a very important
level around 36-37.
HL printed.
40.30 - 40.85 is a Resistance level as
of now.
If it gets rejected from this level, we may
witness 37.50 - 38.50 again.
Upside targets can be around 45 - 46 & then
50s.

Played exactly the same as predicted last week. KSE100 Closed at 114113.94 (02-05-2025)
Played exactly the same as predicted last week.
Now seems like Hidden Bullish Divergence is appearing.
Important Supports :
S1 around 113100 - 113400
S2 around 110500 - 110800
Important Resistances :
R1 around 114630 - 115120
R2 around 117000 - 117500

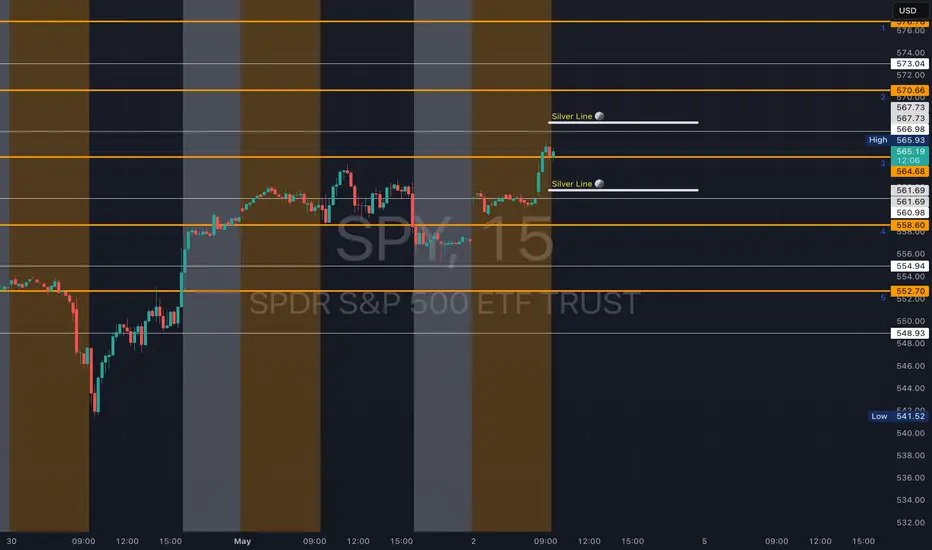
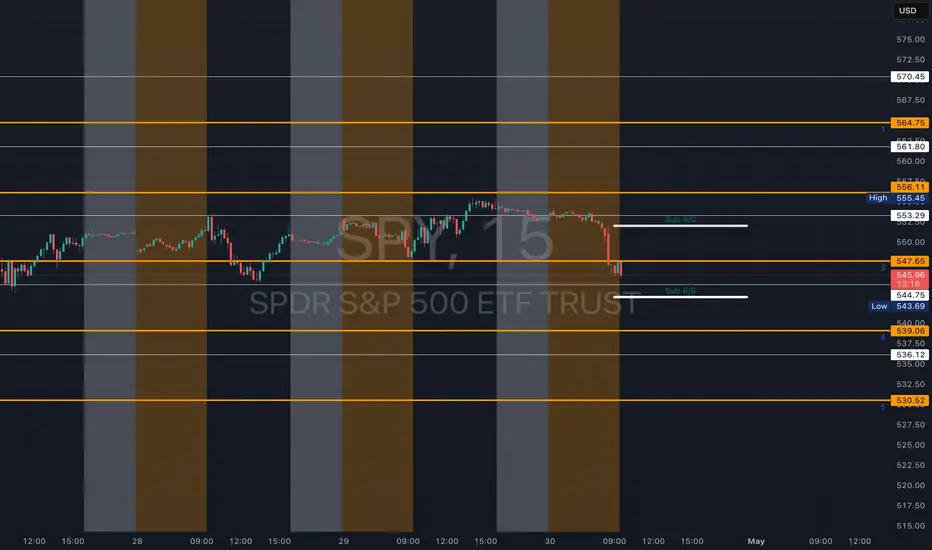
SPY - support & resistant areas for today May 2 2025These are Support and Resistance lines for today, May 2nd, 2025, and will not be valid for the next day. Mark these in your chart by clicking grab this below.
Yellow Lines: Heavily S/R areas, price action will start when closing in on these.
White Lines: Are SL, TP or Mid Level Support and Resistance Areas, these are traded if consolidation take place on them.
Silver Lines: An Area where price action could happen and do work on a choppy day.
NAS100USD: Price Respects Bearish Structure at 62% FibGreetings Traders,
In today’s analysis on NAS100USD, we observe sustained bearish institutional order flow, and we aim to align with this directional bias by identifying high-probability selling opportunities.
KEY OBSERVATIONS:
1. Retracement into Premium Resistance:
Price has recently retraced into premium pricing levels, reaching the 62% Fibonacci retracement zone—a level that often acts as dynamic resistance. This retracement also aligned with a bearish breaker block, confirming institutional resistance at that level. The market has since shown signs of rejection, reinforcing the bearish narrative.
2. Emergence of Fair Value Gap (FVG) as a Key Resistance Array:
Following the rejection, a new FVG has formed, acting as a potential short-term resistance zone. This area provides a refined point of interest where institutions may look to re-engage in selling activity. The alignment of the FVG with previous resistance adds further confluence to the bearish setup.
TRADING PLAN:
We will monitor the newly formed FVG zone for signs of bearish confirmation. Upon confirmation, the plan is to execute short positions targeting liquidity pools in discounted price zones, in line with institutional price delivery patterns.
Remain focused, wait for confirmation, and make sure this idea aligns with your overall trading plan.
Kind Regards,
The Architect

XAUUSD Potential for a drop in 15min chart!Hey Guys,
To keep this analysis short and being able to publish it fast, I've considered a good potential zone for sell and price reaches to this area.
So based on this analysis we can consider a drop soon.
This post will be updated based on recent market movements.
Good luck! :)

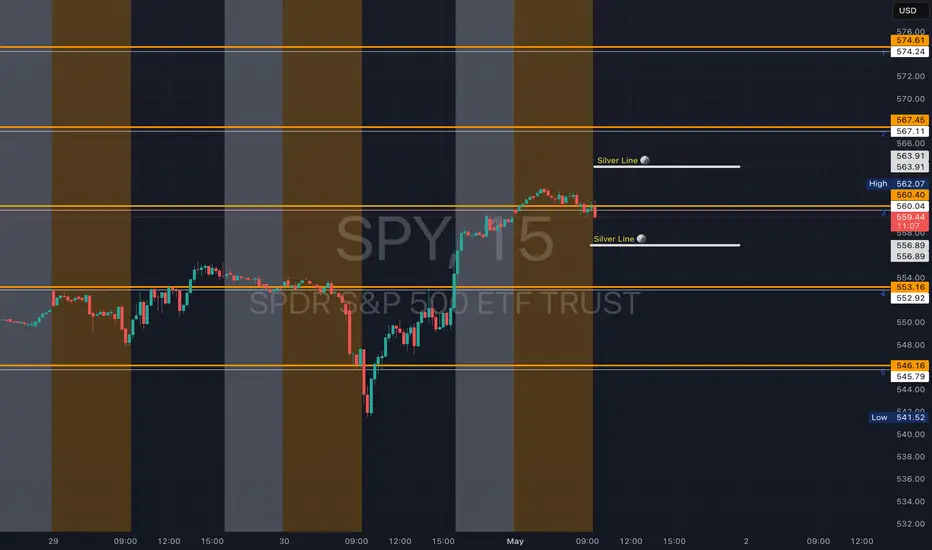
SPY - support & resistant areas for today May 1 2025These are Support and Resistance lines for today, May 1st, 2025, and will not be valid for the next day. Mark these in your chart by clicking grab this below.
Yellow Lines: Heavily S/R areas, price action will start when closing in on these.
White Lines: Are SL, TP or Mid Level Support and Resistance Areas, these are traded if consolidation take place on them.
Silver Lines: An Area where price action could happen and do work on a choppy day.
Bullish Divergence!
Good to Buy on dips with SL 97
TP1 around 100 - 101
TP2 around 102 - 102.50
Crossing & Sustaining 106 may
lead it towards 113 - 115.

Bulls and Bears zone for 05-01-2025S&P 500 is going to have a gap up Open and finally closing gap from early last month.
Also traders could be taking profit after yesterday's big UP move.
Level to watch: 5643 ---5645
Reports to watch:
US : PMI Manufacturing Final 945am
US : ISM Manufacturing Index 1000am
US : Construction Spending 1000am

AUDNZD long time berish,- time for changes?
OANDA:AUDNZD we are have fall last 2 months, price is break DESCENDING CHANNEL, based on technicals here expectations are strong bullish.
SUP zone: 1.07300
RES zone: 1.09200, 1.09700

No Bottom Yet: Gold’s Technical Targets Point LowerSince Monday, I’ve been saying that Gold hasn’t finished correcting, and the price action is now confirming that view. The drop continued with breaks below two key levels: the 3300 figure and the 3270 support, which was the recent low.
After some sideways action (a bit of a limbo), we finally got the clean breakdown. At the time of writing, price sits at 3248, having just bounced slightly from the 3240 support, which aligns with mid-April’s ATH.
Now comes the big question: Is Gold done correcting?
In my opinion, not yet – and here’s why:
Technical reasons for further downside:
1. The break below 3270 is significant and opens the door to deeper correction.
2. We now have two measured targets:
📉 Measured range target: ~1000 pips → puts price below 3200.
📉 First leg down: ~2500 pips → could push price closer to the 3000 zone.
Trading Plan:
The strategy remains unchanged: sell the rallies. As long as price stays below 3270-3290 zone, downside continuation is the base case.
A move towards at least 3200 looks very probable – and deeper levels can't be ruled out.
Don’t rush to call a bottom – let the market show when the correction is really done. Until then, the bias stays bearish. 🚀
P.S: Expect great volatility to remain
Disclosure: I am part of Trade Nation's Influencer program and receive a monthly fee for using their TradingView charts in my analyses and educational articles.

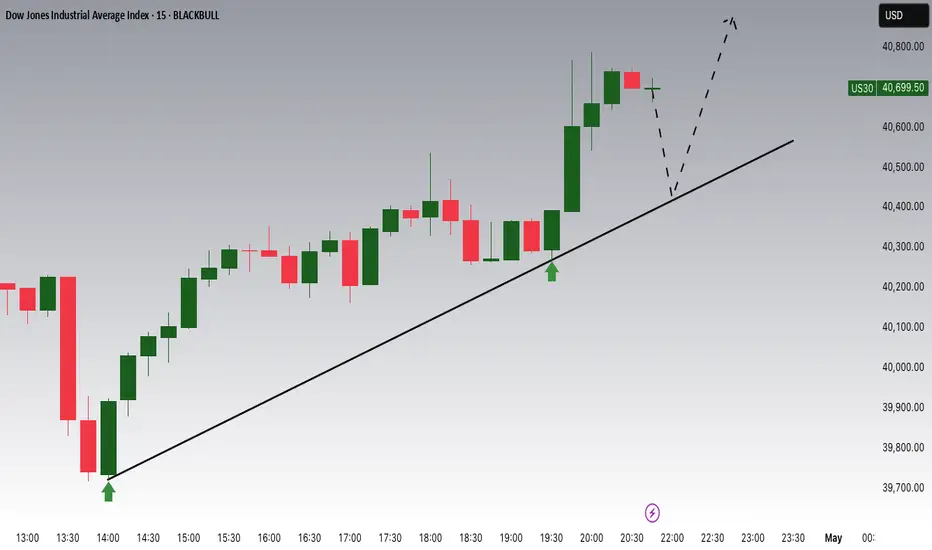
Dow Jones Potential UpsidesHey Traders, in today's trading session we are monitoring US30 for a buying opportunity around 40400 zone, Dow Jones is trading in an uptrend and currently is in a correction phase in which it is approaching the trend at 40400 support and resistance area.
Trade safe, Joe.
SPY - support & resistant areas for today April 30 2025These are Support and Resistance lines for today, April 30, 2025, and will not be valid for the next day. Mark these in your chart by clicking grab this below.
Yellow Lines: Heavily S/R areas, price action will start when closing in on these.
White Lines: Are SL, TP or Mid Level Support and Resistance Areas, these are traded if consolidation take place on them.
Sub R/S: An Area where price action could happen.
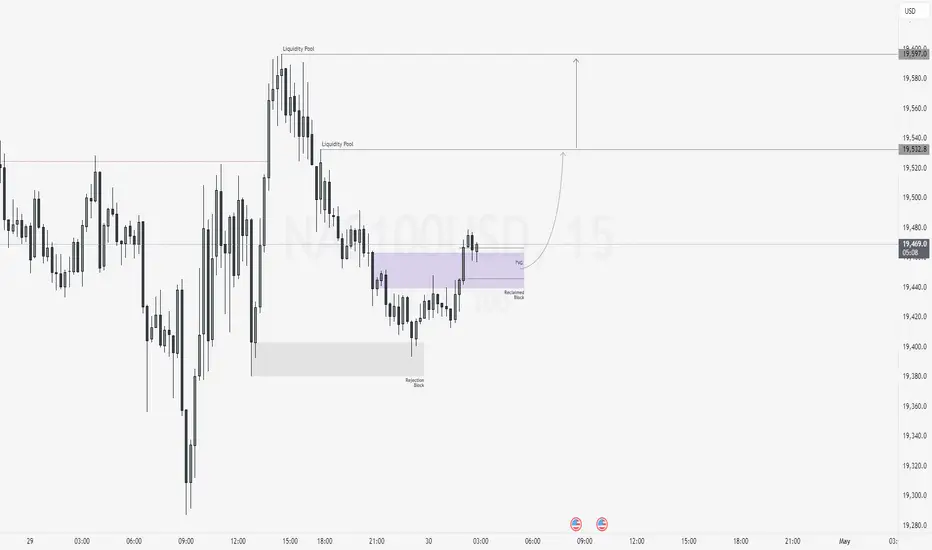
NAS100USD: Bullish Continuation from Reclaimed SupportGreetings Traders,
In today’s analysis on NAS100USD, we identify ongoing bullish institutional order flow, and as such, we aim to align our trading opportunities with this upward bias.
Key Observations:
1. Retracement and Institutional Support:
Recent price action shows a healthy retracement, with price finding institutional support at the rejection block. This was followed by strong displacement to the upside, resulting in a bullish market structure shift. This suggests the retracement may be complete, with further bullish continuation likely.
2. Reclaimed Order Block as Key Support Zone:
Currently, price is approaching a reclaimed order block—a zone where institutions previously initiated buying before price traded higher. When price returns to this area, institutions often reclaim the zone to initiate new long positions. This reclaimed block is further strengthened by the alignment with a fair value gap (FVG), enhancing the zone’s validity as institutional support.
Trading Plan:
We will monitor this reclaimed FVG zone for confirmation of bullish intent. Upon confirmation, we will look to enter long positions targeting liquidity pools in premium pricing zones, where buy-side liquidity is likely to reside.
Stay disciplined, wait for confirmation, and ensure the idea aligns with your broader strategy.
Kind Regards,
The Architect
Buy Fear, Not Euphoria: The Trader's EdgeWhen you look back at the greatest trading opportunities in history, they all seem to share a common element: fear. Yet, when you're in the moment, it feels almost impossible to pull the trigger. Why? Because fear paralyzes, while euphoria seduces. If you want to truly evolve as a trader, you need to master this fundamental shift: buy fear, not euphoria.
Let's break it down together.
________________________________________
What Fear and Euphoria Really Mean in Markets
In simple terms, fear shows up when prices are falling sharply, when bad news dominates the headlines, and when people around you are saying "it's all over."
Euphoria, on the other hand, is everywhere when prices are skyrocketing, when everyone on social media is celebrating, and when it feels like "this can only go higher."
In those moments:
• Fear tells you to run away.
• Euphoria tells you to throw caution to the wind.
Both emotions are signals. But they are inverted signals. When fear is extreme, value appears. When euphoria is extreme, danger hides.
________________________________________
Why Buying Fear Works
Markets are pricing machines. They constantly adjust prices based on emotions, news, and expectations. When fear hits, selling pressure often goes beyond what is rational. People dump assets for emotional reasons, not fundamental ones.
Here’s why buying fear works:
• Overreaction: Bad news usually causes exaggerated moves.
• Liquidity Vacuums: Everyone sells, no one buys, creating sharp discounts.
• Reversion to Mean: Extreme moves tend to revert once emotions stabilize.
Buying into fear is not about being reckless. It’s about recognizing that the best deals are available when others are too scared to see them.
________________________________________
Why Chasing Euphoria Fails
At the peak of euphoria, risks are often invisible to the crowd. Valuations are stretched. Expectations are unrealistic. Everyone "knows" it's going higher — which ironically means there's no one left to buy.
Chasing euphoria often leads to:
• Buying high, selling low.
• Getting trapped at tops.
• Emotional regret and revenge trading.
You’re not just buying an asset — you're buying into a mass illusion.
________________________________________
How to Train Yourself to Buy Fear
It's not enough to "know" this. In the heat of the moment, you will still feel the fear. Here's how you build the right habit:
1. Pre-plan your entries: Before panic strikes, have a plan. Know where you want to buy.
2. Focus on strong assets: Not everything that falls is worth buying. Choose assets with strong fundamentals or clear technical setups.
3. Scale in: Don’t try to catch the bottom perfectly. Build positions gradually as fear peaks.
4. Use alerts, not emotions: Set price alerts. When they trigger, act mechanically.
5. Remember past patterns: Study previous fear-driven crashes. See how they recovered over time.
Trading is a game of memory. The more you internalize past patterns, the easier it is to act when everyone else panics.
________________________________________
A Recent Example: April 2025 Tariff Panic
Very recently, at the start of April, Trump’s new tariff announcements sent shockwaves through the market. Panic took over. Headlines screamed. Social media was flooded with fear.
But if you looked beyond the noise, charts like SP500 and US30 told a different story: the drops took price right into strong support zones.
At the time, I even posted this : support zones were being tested under emotional pressure.
If you had price alerts set and reacted mechanically, not emotionally , you could have bought into that fear — and potentially benefited from the rebound that followed just days later.
This is the essence of buying fear.
________________________________________
Final Thoughts
In trading, you are paid for doing the hard things. Buying when it feels terrible. Selling when it feels amazing.
Remember:
Fear offers you discounts. Euphoria offers you traps.
The next time the market feels like it's crashing, ask yourself:
• Is this fear real, or exaggerated?
• Is this an opportunity hiding under an emotional fog?
If you can answer that with clarity, you're already ahead of 90% of traders.
Stay rational. Stay prepared. And above all: buy fear, not euphoria.
Disclosure: I am part of Trade Nation's Influencer program and receive a monthly fee for using their TradingView charts in my analyses and educational articles.
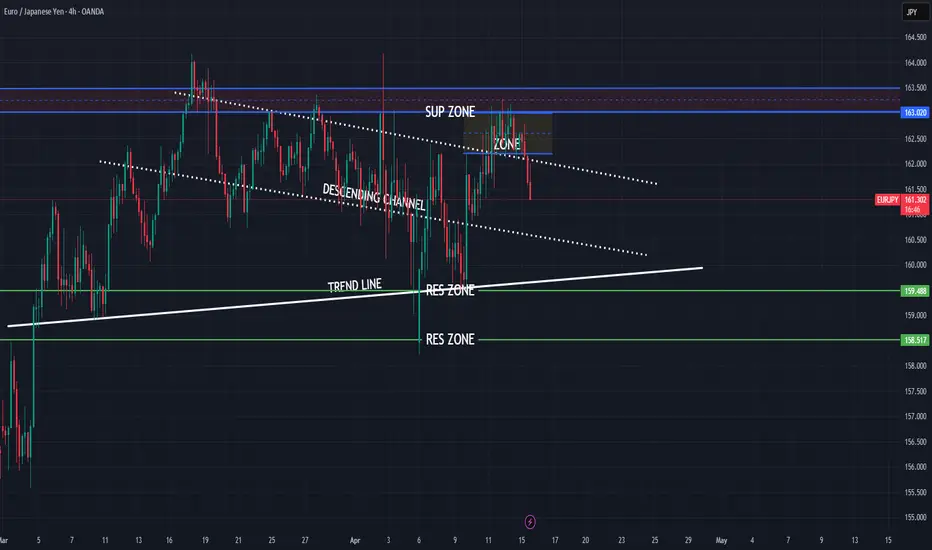
EURJPY strong bearish expectations
OANDA:EURJPY strong bullish expectations i am have, but things will not go like expected..
Currently price in DESCENDING CHANNEL, in moment we are have break of same, but price is make revers in zone and pushing now bearish.
Here now exepcting fall till trend line.
SUP zone: 163.000
RES ozne: 159.500, 158.500
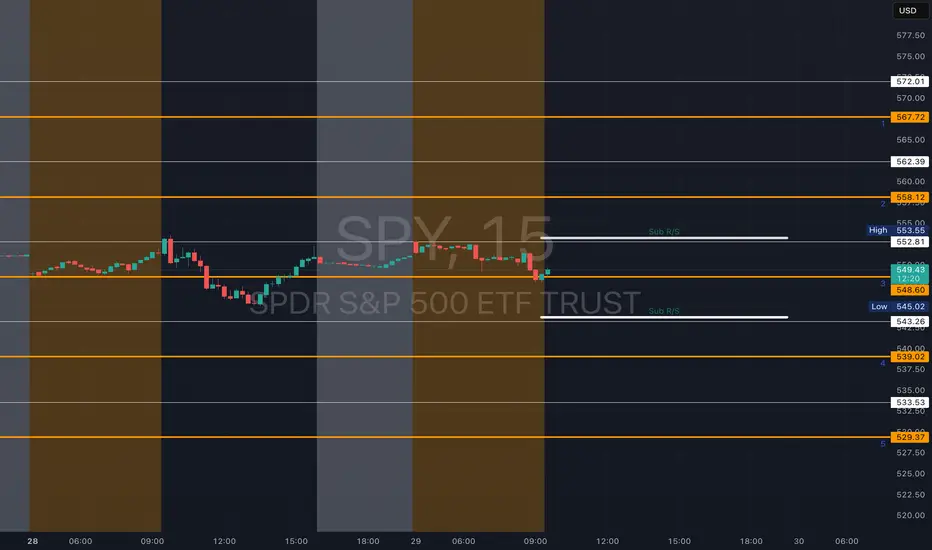
SPY - support & resistant areas for today April 29 2025These are Support and Resistance lines for today, April 29, 2025, and will not be valid for the next day. Mark these in your chart by clicking grab this below.
Yellow Lines: Heavily S/R areas, price action will start when closing in on these.
White Lines: Are SL, TP or Mid Level Support and Resistance Areas, these are traded if consolidation take place on them.
Sub R/S: An Area where price action could happen.
EURCAD bearish view
#EURCAD several times bounces on trend line, having view price is saturated on this point, currently we are in zone, from here expecting break of zone/trend line and bearish trend till RES zones.
SUP zone: 1.58500
RES zone: 1.55400, 1.54400

EURUSD short bearish push expecting
FX:EURUSD price few times testing zone 1.14000, few times bounce on bottom trend line of BEARISH FLAG, from 22.April we have signs for trend revers, trend structure looks good, from here expecting bearish trend till trend line.
SUP zone: 1.14500
RES zone: 1.11500

Approaching important Support Zone..Important to take Support from
this Level ( 21.30 - 22.50).
Otherwise more selling pressure
will be observed.

Channel bottom Support Taken...Important to Close above 40.84
on Monthly Basis for further
Upside.
Channel top is around 44 - 45
