NEAR the Bottom? - The Crash Ends HereBack in October 2023, NEAR embarked on an incredible bull run lasting 147 days, surging from a low of $0.971 to a high of $9.01—an astounding +828% gain. Following this euphoric phase, the market sentiment shifted dramatically. Over the subsequent 392 days, NEAR retraced to around $2, marking a -78% decline. Now, with the market at a critical juncture, the question remains: when does the madness of the crash end, and can we finally see a reversal?
Harmonic Patterns & Fibonacci Confluence
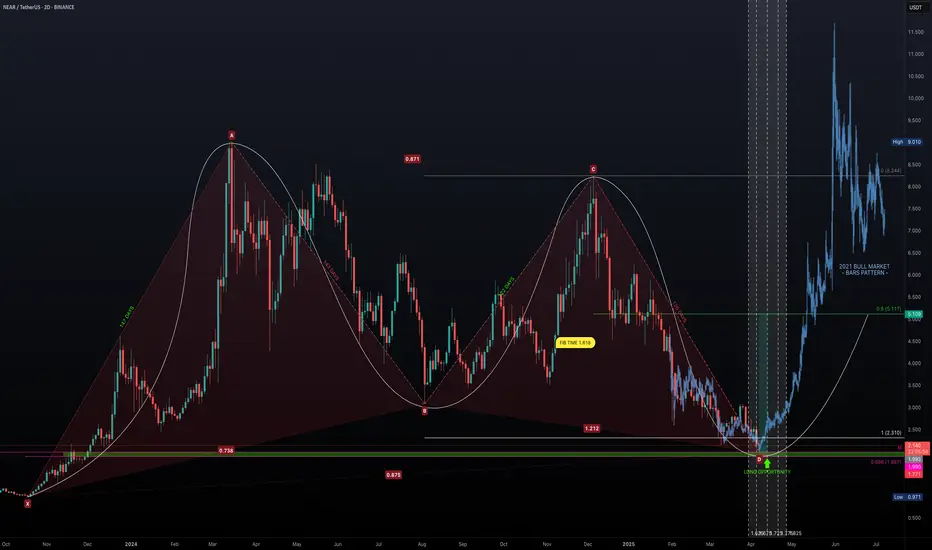
Chart Pattern Analysis: The XABCD Framework
Using the XABCD pattern tool, we identify the following key points:
Point X: $0.971
Point A: $9.01
Point B: $3.076
Point C: $8.244
Point D: $1.978
Durations:
X-A: 147 Days
A-B: 143 Days
B-C: 122 Days
C-D: 126 Days
These durations show remarkable symmetry—with the up-move phases (X-A and A-B) nearly matching in time, and similarly for the correction phases (B-C and C-D). This time symmetry supports the presence of a harmonic structure, and the retracement levels help validate the potential for a reversal.
Fibonacci Implications
Fib Retracement of XA: Point B is at 0.738
Fib Retracement of AB: Point C sits at 0.871
Fib Retracement of BC: Point D lands at 0.875
Fib Extension of BC: Point D is at 1.212
While Point D’s retracement at 0.875 is slightly deeper than the classic 0.786 level expected for a Gartley Harmonic, it remains close enough to validate a harmonic correction, especially considering market noise. Additionally, the expansion of BC at 1.212 is close to the 1.27 range, lending further credence to this being a Gartley-type pattern.
Time Factor: Fibonacci Time Extensions & Exhaustion
147-day Bull Run: NEAR rose from $0.971 to $9.01 in 147 days.
392-day Bearish Correction: Since hitting $9.01, the price has retraced for 392 days.
Fibonacci Time Extensions:
1.618 multiplier: 147 × 1.618 ≈ 238 days. A Classic "golden ratio" reversal target. This period coincided with a +135% surge in November.
2.618 multiplier: 147 × 2.618 ≈ 385 days. High-probability exhaustion point. This is nearly equal to the current 392 days, suggesting that time-based exhaustion may be imminent.
The alignment of these time-based measures with the price retracement (approximately 87.5% retracement of the original move) signals a critical juncture where the bearish phase could soon be over.
Identifying the Support Zone & Long Opportunity
Based on harmonic and Fibonacci analyses, the confluence of key support levels points to a potential bottom:
Harmonic Point D: Trading near $2.
Monthly Level: $1.99 acts as a strong support benchmark.
Fibonacci Retracement (0.886): at $1.887.
These levels create a long opportunity window between $1.99 and $1.887. This confluence offers a solid entry region for long positions.
Additionally, other confluence factors include:
Fibonacci time extension at the 2.618 level (around 385 days) aligning with the current duration of the bearish phase.
The symmetry of the XABCD pattern adds to the reliability of the support structure.
High-Probability Trade Setup
Long Entry:
Entry Zone: Accumulate positions in the $1.99 to $1.887 range.
Target: Aim for the 0.5 Fibonacci retracement level of the bull run, approximately $5.00, which represents a potential +150% gain from current levels.
Risk-to-Reward (R:R): With the setup targeting a substantial rebound, the risk-reward ratio is very attractive, particularly if entry is taken in the defined confluence zone.
Market Outlook:
Current Sentiment: NEAR is in a significant downtrend, evidenced by a dramatic -78% retracement after an explosive bull run.
Reversal Indicators: The harmonic pattern, Fibonacci retracements, and time exhaustion (392 days approaching the 2.618 extension) all point towards a possible bottom formation in the coming month, particularly during April.
Potential Reversal: If NEAR holds within the $1.99 to $1.887 window, a reversal back towards $5.00 appears plausible, echoing the conditions seen at previous market cycle reversals.
Key Takeaways
Historic Run & Severe Correction: NEAR surged over +828% in 147 days only to retrace -78% over the following 392 days.
Harmonic Confluence: The XABCD pattern and Fibonacci levels create a compelling argument for a turnaround.
Time & Price Alignment: Fibonacci time extension around 385 days combined with an 87.5% price retracement suggests market exhaustion.
Solid Long Entry Zone: The support between $1.99 and $1.887 offers an attractive risk entry point with the potential to target a move back up to $5.00.
After decades in the trading arena, one thing is clear—the market often cycles through periods of euphoria and despair before turning a corner. NEAR's confluence of harmonic symmetry, Fibonacci retracement, and time-based exhaustion is almost too aligned to ignore. With a defined long entry window between $1.99 and $1.887, this might be the moment to consider a high-probability long trade. As always, manage your risk diligently and wait for clear confirmation.
Wrapping it up here, happy trading =)
If you found this helpful, leave a like and comment below! Got requests for the next technical analysis? Let me know.
Supportandresistancezones
Tariff Pause = Crypto Pump?USDT Dominance is testing strong resistance (5.60%–5.80%) while holding a rising support line. A break below 5.40% could signal a shift to risk-on sentiment, triggering a move into Bitcoin and altcoins.
Trump’s 90-day tariff pause may further boost market confidence, reduce demand for stablecoins, and support crypto inflows. If dominance breaks down, it could spark an altcoin rally. If it holds above 5.80%, caution remains. This is a key turning point.

XAUUSD Outlook: Bull or Bear Move Ahead? Manage Risk📊 XAUUSD Market Insight 🌍
Gold is heating up once again, currently testing a tight range between 3080 and 3095. A breakout in either direction could set the tone for the next big move.
🔻 If price breaks below, we may see a slide toward 3060 and 3050—potential areas to watch for bearish momentum.
🔺 However, a strong push above 3095 could spark bullish energy, aiming for short-term targets at 3115 and 3127.
💡 Trade Smart
The market is full of opportunity, but don’t forget: risk management is key. Use proper position sizing, set clear stop-losses, and never overexpose your capital. Stay sharp, trade safe, and let the market come to you. 🧠💼

Will BTC emerge from the resistance zone on top?BTC bounced off an important support zone at $74,154 - $77,050 and we are currently seeing a very strong upward movement at the 10% level. It is also clear that the price drop created a higher low and the upward impulse gave a higher high, which is positive in the short term for continued growth.
However, you need to be careful here because the BTC price has entered a strong resistance zone from $81,900 to $83,900, only breaking out of this zone on top will open the way towards $89,000.
It is worth paying attention to the RSI indicator, which confirms the dynamic movement, but considering the 4H interval, there is still room for the price to overcome the zone on top.

EURNZD - at major Resistance: Will it drop to 1.9000?OANDA:EURNZD reached a major resistance level that has previously acted as a strong barrier, triggering some strong bearish momentum. This zone can be a potential point of interest for those looking for short opportunities. Given its historical significance, how price reacts here could set the tone for the next move.
If bearish signals emerge, such as rejection wicks, bearish candlestick patterns, or signs of weakening bullish pressure, I anticipate a move toward the 1.9000 level . However, a clear breakout above this resistance could challenge the bearish outlook and mean further upside. It's a pivotal area where price action will likely provide clearer clues on the next direction.
Just my take on support and resistance zones, not financial advice. Always confirm your setups and trade with a proper risk management.

NZDJPY - Potential bounce to 85.300 from SupportOANDA:NZDJPY has reached a major support level, an area where buyers have previously shown strong interest. This zone has acted as a key zone, increasing the likelihood of a bounce if buyers step in.
A bullish confirmation, such as a strong rejection pattern, bullish engulfing candles, or long lower wicks, would strengthen the case for a move higher. If buyers take control, the price could bounce toward the 85.300 target. However, a decisive breakdown below this support would invalidate the bullish scenario and could lead to further downside.
This isn’t financial advice, just my take on how I approach support and resistance zones. Best to wait for clear confirmation, like a strong rejection or a volume spike, before making a move.
Every trader has a unique perspective. Let’s discuss this setup within the TradingView community!

XAUUSD Update: Bullish or Bearish? Key Levels to Watch! 🚨 Attention Traders! 🚨
XAUUSD is making waves and breaking through key levels! 🔥 The price is currently battling between 2980 and 2989 — will we see a breakout soon?
Bearish Alert: A dip below this range could lead us to targets like 2860 and 2850. ⚠️
Bullish Opportunity: A move above 2989 could trigger buying opportunities, with targets around 3004 and 3027. 🚀
💬 Let’s Talk Strategy! What’s your take on this? Share your insights as we ride this golden wave together and unlock new opportunities! 💰

Will the support zone keep BTC falling?BTC has once again bounced off the upper border of the downtrend channel. Here, it is worth remembering the long-formed gap around $74,500, which was closed during the last decline.
Here, you can see how the price fell into a strong support zone from $77,742 to $73,980, but if this zone is broken, we can again see a strong decline around also very strong resistance and the lower border of the channel at $68,590.
Looking the other way, you can see that the increases were stopped by the resistance zone from $84,000 to $86,700, only breaking out of this zone at the top will give the possibility of growth towards strong resistance at $94,300.
The RSI is still in the lower part of the range and is again heading towards the lower borders, but here the price has formed a lower low, which can still give another reaction.

$ANET $65 target support from resistanceHi, got a bit of resistance here around the $73-$75 zone from previous times ago and currently and atop a bearish sentiment uncertain market environment. Will be looking to short to the $65 zone. $63 is a plausible target.
wsl

$AMD $75 support targetHi, NASDAQ:AMD short may be activated here looking at the daily and weekly. I personally think we are in a bearish trend market wide with the uncertainty and unknowing's of global economics and policies. I believe NASDAQ:AMD will tap into my support zone, in my opinion we have a local resistance of $88-$90.
WSL.

BTC Tightening Up – Key Support & Resistance in Focus!📝 🚀 BTC/USD – 4H Price Action Masterclass | Breakout Brewing Between $71.2K & $72K!
Bitcoin is currently consolidating in a high-tension zone on the 4-hour chart, forming a classic range-bound structure between two key levels:
🔹 Support at $71,200 – a previous resistance now acting as short-term demand
🔹 Resistance at $72,000 – a strong psychological barrier that price has failed to close above
This tightening range is setting the stage for a high-impact move, and the market is showing signs of compression. No indicators, no noise — just clean structure and price action clarity.
🔍 Detailed Technical Breakdown:
📌 $71,200 – Flip Zone:
Recently flipped from resistance to support after a breakout. Price is now retesting this level with precision, suggesting potential accumulation — but failure here may trigger strong selling pressure.
📌 $72,000 – Critical Resistance:
This level has held price down for multiple sessions. If bulls manage to close above it on strong volume, we could see a push towards FWB:73K +, where liquidity clusters await.
⚔️ Battle of the Zones – What to Expect Next?
Bullish Scenario: A breakout above $72,000 on strong bullish candles could ignite a move toward the next resistance at $73,500–$74,000.
Bearish Scenario: If $71,200 breaks down, expect a sharp drop toward $70,400, possibly extending to the $69K handle.
This setup offers a textbook example of how support/resistance zones act as battlegrounds for short-term market control.
🔥 Why This Chart Matters (No Indicators Used):
Clean price action = clean decision-making.
Ideal for breakout traders & range scalpers.
High probability setup with defined risk levels.
Easy to read & replicate — especially for beginners learning PA.
💬 What’s YOUR take?
Are we about to see a bullish explosion, or is this a trap before a deeper drop?
👇 Drop your analysis in the comments – let’s build a real traders’ conversation below!
📈 If you found this chart helpful, don’t forget to like & follow for more clean setups.

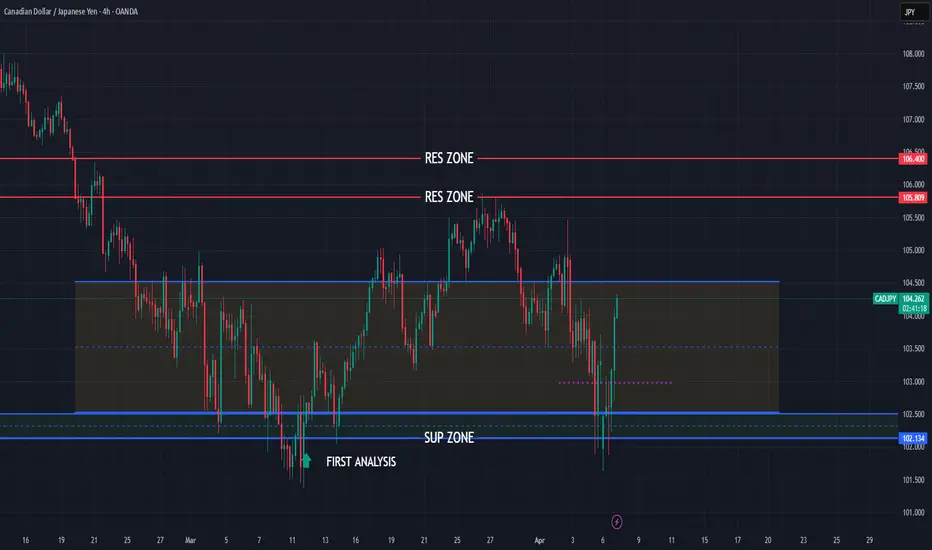
CADJPY still bullish expecting
OANDA:CADJPY first analysis highly accurate it's attached.
In first analysis i am share bullish view, having op we are not see some special big bullish move and based on PRICE ACTION analysis expecting here new bullish push.
SUP zone: 102.500
RES zone: 105.800, 106.400
Tesla: bounce expected at $200 Support?NASDAQ:TSLA is currently approaching an important support zone, an area where the price has previously shown bullish reactions. This level aligns closely with the psychological $200 mark, which tends to carry added weight in the market .
The recent momentum suggests that buyers could step in and drive the price higher. A bullish confirmation, such as a strong rejection pattern, bullish engulfing candles, or long lower wicks, would increase the probability of a bounce from this level. If I'm right and buyers regain control, the price could move toward the 260.00 level.
However, a breakout below this support would invalidate the bullish outlook, potentially leading to more downside.
This is not financial advice but rather how I approach support/resistance zones. Remember, always wait for confirmation, like a rejection candle or volume spike before jumping in.

Cup & Handle Formation in process but..Cup & Handle Formation in process but Yes, there is a Bearish Divergence
on Weekly Tf.
Resisted exactly from the mentioned level around 116-117.
Could not Sustain this level.
Now Weekly Closing above 104 - 105 is important.
Next Support lies around 96 - 97
If 118 is Crossed & Sustained, we may Target around 145 - 146.

ETH ANALYSIS🔮 #ETH Analysis :: Support & Resistance Trading
💲💲 #ETH is trading between support and resistance area. If #ETH sustains above major support area then we will a bullish move and if not then we will see more bearish move in #ETH then could expect a pullback.
💸Current Price -- $1564
⁉️ What to do?
- We have marked crucial levels in the chart . We can trade according to the chart and make some profits. 🚀💸
#ETH #Cryptocurrency #DYOR

LTC/USDT: at important resistance Until the price closes below 100, the current trend structure suggests a one more leg down toward the 76–70 macro support zone.
However, if the price successfully clears the 100 resistance level - rising and closing above it with strong volume - the odds will shift in favor of a correction ending and the potential start of a new uptrend toward the 210–270 macro resistance zone.
Macro-structure:
Thank you for your attention!

AUDUSD bullish continuation still to expect
FX:AUDUSD we are have break of CHANNEL, break of long trend line, price is make revers, now its on strong sup zone and from here new bullish push expecting.
USD showing self weak still, continuation expecting, +we are not see some special moves here.
SUP zone: 0.62500
RES zone: 0.64400, 0.64900, 0.65400

USDCAD bearish strong
OANDA:USDCAD trend based trade, after strong events in last periods here strong bearish expectations for this week.
SUP zone: 1.45500
RES zone: 1.40500, 1.39600

Stoploss of 109500 intact!Immediate Support 114200 - 114300
If 109000 is broken, we may witness heavy selling
pressure dragging the Index towards 105000 - 106000.

GBPCAD bearish view
OANDA:GBPCAD whats next?, we are have two times bounce on trend line,
currently on D is visible DESCENDING TRIANGL,
in triangl we have RECTANGLE PATTERN 4h which is breaked,
below rectangle pattern we have on lower TF better visible BEARISH FLAG pattern 1h (violet doted), which currently looks breaked,
here expecting bearish push now till next trend zone.
SUP zone: 1.85000
RES zone: 1.82250, 1.81600

GBPJPY still bullish view
OANDA:GBPJPY in first analysis RES zone reached, what's next here is still bullish for expect. First analysis attached, currently price is in ASCENDING CHANNEL. Technicals are still bullish to see.
SUP zone: 192.500
RES zone: 195.900, 196.900

SUPPORT AND RESISTANCE BREAKOUT ALERT!🚨 Attention Traders! 🚨
XAUUSD is on fire, breaking records with power! 🔥 Here's the latest:
Current Range: We're seeing a fierce battle between 3017 and 3043. Will we break out soon?
Bearish Scenario: Watch out for a possible dip below this range. If that happens, targets like 2988 and 2978 could be in play. ⚠️
Bullish Scenario: A breakout above 3043 opens up buying opportunities! Watch for movement above 3072, with targets at 3124 and 3150. 🚀
💬 Join the Discussion! What are your thoughts? Let’s ride this wave and make the most of the opportunities ahead! 💎

LTC Targets $70: A High-Probability Reversal SetupLitecoin (LTC) has just broken below the critical $80 low, signaling that bearish pressure is firmly in control. Currently trading at $79—just beneath the swing low at $80—LTC is also sitting below the monthly open at $82.98. With the bears flexing their dominance, traders are left wondering: Where does the price head next? What’s the target for the bears, and where can bulls find an opportunity to re-enter the market? Let’s dive into the charts, pinpoint the key levels, and craft a plan that could turn this downturn into a golden opportunity.
The Current Market Picture
LTC’s recent breach of $80 confirms the bearish momentum that’s been brewing since its peak at $147.06 on December 5, 2024. Litecoin enjoyed a stellar 122-day bullish run, soaring +195% from $49.80 to high at $147.06. Now, we’re on the 122nd day of a downtrend—a poetic symmetry that hints at a potential turning point. The question is: where will this descent find its floor, and how can we position ourselves for what’s next?
Support Zone: The $70 Fortress
To identify a robust support zone, we need confluence—multiple technical factors aligning to form a level that’s tough to crack. Here’s what the chart reveals:
Fibonacci Retracement: Using the Fib tool from the 2024 low at $49.80 to the high at $147.06, the 0.618 retracement at $86.95 has already been lost, turning our focus to the 0.786 level at $70.61. This deep retracement is a classic spot for reversals, making it a prime candidate for a support zone.
Yearly Level: At $70.14, this pivot is nearly identical to the 0.786 Fib level, adding significant weight to the area.
Volume Profile: The Point of Control (POC) from a 1.5-year trading range sits right around $70, just above the Fib level. This is the price with the highest traded volume over that period—a natural magnet for price action.
Yearly Order Block: Visualized as a green channel, this order block reinforces the $70 zone, suggesting past institutional buying interest or significant support.
Together, these factors create a $70 support zone that’s brimming with confluence. It’s not just a random level—it’s a fortress where bulls could mount a serious stand.
Long Trade Setup:
Entry Strategy: Use a Dollar-Cost Averaging (DCA) approach to build your position. Start with small buys around $75, laddering down to $70, and increase your position size as price nears the core of the support zone. Aim for an average entry of $73/72.
Stop Loss (SL): Set it below $68 to protect against a deeper breakdown while giving the trade room to breathe.
Take Profit (TP): First Target: $80 (the swing low and monthly open not far off). Main Target: $100 (a key psychological and resistance zone).
Risk-to-Reward (R:R): With an average entry at $73 and SL at $68, you’re risking $5 to gain $27 (to $100)—a stellar 5:1 R:R or better. This is a high-probability setup that rewards patience.
Execution Tip: Watch for bullish signals in the $70-$75 range—candlestick pattern, volume spikes, or RSI divergence. This isn’t about chasing; it’s about precision.
Resistance Zone: The $100 Battleground
If bulls reclaim control and push LTC higher, the $100 psychological level looms as a major resistance zone. Here’s why it’s a HOTSPOT:
Yearly Open: At $103.28, this level is close enough to $100 to bolster its significance.
Anchored VWAP: Drawn from the 2024 low at $49.80, the VWAP currently sits around $102.4, adding another layer of resistance.
Historical Context: The $100 mark has been a recurring battleground, with bulls and bears clashing repeatedly. It’s a price that carries weight.
A rally to $100 wouldn’t just be a recovery—it’d be a statement. A clean break above could hint at a broader trend reversal, but until then, it’s a ceiling to respect.
What’s Next? Bears vs. Bulls
For now, the bears are driving LTC lower, with the break below $80 opening the door to the $70 support zone. That’s their likely target—a level where selling pressure could exhaust itself. For bulls, $70 isn’t just a floor; it’s a launchpad. The DCA long setup offers a low-risk, high-reward entry.
Wrapping It Up
Litecoin’s drop from $147.06 to $79 has been brutal, but the chart is screaming opportunity. The $70 zone—backed by Fibonacci, levels, volume, and order blocks—is where bulls could turn the tide. With a DCA entry at around $73/72, SL below $68, and a main target at $100, you’ve got a trade setup that could deliver a 5:1 payoff. Meanwhile, $100 stands as the bears’ next big test if momentum shifts.
So, will you wait for LTC to hit $70 and strike, or watch the action unfold? The levels are clear—now it’s your move. Use this analysis to sharpen your edge, and let’s see where Litecoin takes us in the days, weeks, and months ahead.
________________________________________
If you found this helpful, leave a like and comment below! Got requests for the next technical analysis? Let me know, I’m here to break down the charts you want to see.
Happy trading =)
