Tesla: bounce expected at $200 Support?NASDAQ:TSLA is currently approaching an important support zone, an area where the price has previously shown bullish reactions. This level aligns closely with the psychological $200 mark, which tends to carry added weight in the market .
The recent momentum suggests that buyers could step in and drive the price higher. A bullish confirmation, such as a strong rejection pattern, bullish engulfing candles, or long lower wicks, would increase the probability of a bounce from this level. If I'm right and buyers regain control, the price could move toward the 260.00 level.
However, a breakout below this support would invalidate the bullish outlook, potentially leading to more downside.
This is not financial advice but rather how I approach support/resistance zones. Remember, always wait for confirmation, like a rejection candle or volume spike before jumping in.
Supportandresistancezones

Cup & Handle Formation in process but..Cup & Handle Formation in process but Yes, there is a Bearish Divergence
on Weekly Tf.
Resisted exactly from the mentioned level around 116-117.
Could not Sustain this level.
Now Weekly Closing above 104 - 105 is important.
Next Support lies around 96 - 97
If 118 is Crossed & Sustained, we may Target around 145 - 146.

ETH ANALYSIS🔮 #ETH Analysis :: Support & Resistance Trading
💲💲 #ETH is trading between support and resistance area. If #ETH sustains above major support area then we will a bullish move and if not then we will see more bearish move in #ETH then could expect a pullback.
💸Current Price -- $1564
⁉️ What to do?
- We have marked crucial levels in the chart . We can trade according to the chart and make some profits. 🚀💸
#ETH #Cryptocurrency #DYOR

LTC/USDT: at important resistance Until the price closes below 100, the current trend structure suggests a one more leg down toward the 76–70 macro support zone.
However, if the price successfully clears the 100 resistance level - rising and closing above it with strong volume - the odds will shift in favor of a correction ending and the potential start of a new uptrend toward the 210–270 macro resistance zone.
Macro-structure:
Thank you for your attention!

AUDUSD bullish continuation still to expect
FX:AUDUSD we are have break of CHANNEL, break of long trend line, price is make revers, now its on strong sup zone and from here new bullish push expecting.
USD showing self weak still, continuation expecting, +we are not see some special moves here.
SUP zone: 0.62500
RES zone: 0.64400, 0.64900, 0.65400

USDCAD bearish strong
OANDA:USDCAD trend based trade, after strong events in last periods here strong bearish expectations for this week.
SUP zone: 1.45500
RES zone: 1.40500, 1.39600

Stoploss of 109500 intact!Immediate Support 114200 - 114300
If 109000 is broken, we may witness heavy selling
pressure dragging the Index towards 105000 - 106000.

GBPCAD bearish view
OANDA:GBPCAD whats next?, we are have two times bounce on trend line,
currently on D is visible DESCENDING TRIANGL,
in triangl we have RECTANGLE PATTERN 4h which is breaked,
below rectangle pattern we have on lower TF better visible BEARISH FLAG pattern 1h (violet doted), which currently looks breaked,
here expecting bearish push now till next trend zone.
SUP zone: 1.85000
RES zone: 1.82250, 1.81600

GBPJPY still bullish view
OANDA:GBPJPY in first analysis RES zone reached, what's next here is still bullish for expect. First analysis attached, currently price is in ASCENDING CHANNEL. Technicals are still bullish to see.
SUP zone: 192.500
RES zone: 195.900, 196.900

SUPPORT AND RESISTANCE BREAKOUT ALERT!🚨 Attention Traders! 🚨
XAUUSD is on fire, breaking records with power! 🔥 Here's the latest:
Current Range: We're seeing a fierce battle between 3017 and 3043. Will we break out soon?
Bearish Scenario: Watch out for a possible dip below this range. If that happens, targets like 2988 and 2978 could be in play. ⚠️
Bullish Scenario: A breakout above 3043 opens up buying opportunities! Watch for movement above 3072, with targets at 3124 and 3150. 🚀
💬 Join the Discussion! What are your thoughts? Let’s ride this wave and make the most of the opportunities ahead! 💎

LTC Targets $70: A High-Probability Reversal SetupLitecoin (LTC) has just broken below the critical $80 low, signaling that bearish pressure is firmly in control. Currently trading at $79—just beneath the swing low at $80—LTC is also sitting below the monthly open at $82.98. With the bears flexing their dominance, traders are left wondering: Where does the price head next? What’s the target for the bears, and where can bulls find an opportunity to re-enter the market? Let’s dive into the charts, pinpoint the key levels, and craft a plan that could turn this downturn into a golden opportunity.
The Current Market Picture
LTC’s recent breach of $80 confirms the bearish momentum that’s been brewing since its peak at $147.06 on December 5, 2024. Litecoin enjoyed a stellar 122-day bullish run, soaring +195% from $49.80 to high at $147.06. Now, we’re on the 122nd day of a downtrend—a poetic symmetry that hints at a potential turning point. The question is: where will this descent find its floor, and how can we position ourselves for what’s next?
Support Zone: The $70 Fortress
To identify a robust support zone, we need confluence—multiple technical factors aligning to form a level that’s tough to crack. Here’s what the chart reveals:
Fibonacci Retracement: Using the Fib tool from the 2024 low at $49.80 to the high at $147.06, the 0.618 retracement at $86.95 has already been lost, turning our focus to the 0.786 level at $70.61. This deep retracement is a classic spot for reversals, making it a prime candidate for a support zone.
Yearly Level: At $70.14, this pivot is nearly identical to the 0.786 Fib level, adding significant weight to the area.
Volume Profile: The Point of Control (POC) from a 1.5-year trading range sits right around $70, just above the Fib level. This is the price with the highest traded volume over that period—a natural magnet for price action.
Yearly Order Block: Visualized as a green channel, this order block reinforces the $70 zone, suggesting past institutional buying interest or significant support.
Together, these factors create a $70 support zone that’s brimming with confluence. It’s not just a random level—it’s a fortress where bulls could mount a serious stand.
Long Trade Setup:
Entry Strategy: Use a Dollar-Cost Averaging (DCA) approach to build your position. Start with small buys around $75, laddering down to $70, and increase your position size as price nears the core of the support zone. Aim for an average entry of $73/72.
Stop Loss (SL): Set it below $68 to protect against a deeper breakdown while giving the trade room to breathe.
Take Profit (TP): First Target: $80 (the swing low and monthly open not far off). Main Target: $100 (a key psychological and resistance zone).
Risk-to-Reward (R:R): With an average entry at $73 and SL at $68, you’re risking $5 to gain $27 (to $100)—a stellar 5:1 R:R or better. This is a high-probability setup that rewards patience.
Execution Tip: Watch for bullish signals in the $70-$75 range—candlestick pattern, volume spikes, or RSI divergence. This isn’t about chasing; it’s about precision.
Resistance Zone: The $100 Battleground
If bulls reclaim control and push LTC higher, the $100 psychological level looms as a major resistance zone. Here’s why it’s a HOTSPOT:
Yearly Open: At $103.28, this level is close enough to $100 to bolster its significance.
Anchored VWAP: Drawn from the 2024 low at $49.80, the VWAP currently sits around $102.4, adding another layer of resistance.
Historical Context: The $100 mark has been a recurring battleground, with bulls and bears clashing repeatedly. It’s a price that carries weight.
A rally to $100 wouldn’t just be a recovery—it’d be a statement. A clean break above could hint at a broader trend reversal, but until then, it’s a ceiling to respect.
What’s Next? Bears vs. Bulls
For now, the bears are driving LTC lower, with the break below $80 opening the door to the $70 support zone. That’s their likely target—a level where selling pressure could exhaust itself. For bulls, $70 isn’t just a floor; it’s a launchpad. The DCA long setup offers a low-risk, high-reward entry.
Wrapping It Up
Litecoin’s drop from $147.06 to $79 has been brutal, but the chart is screaming opportunity. The $70 zone—backed by Fibonacci, levels, volume, and order blocks—is where bulls could turn the tide. With a DCA entry at around $73/72, SL below $68, and a main target at $100, you’ve got a trade setup that could deliver a 5:1 payoff. Meanwhile, $100 stands as the bears’ next big test if momentum shifts.
So, will you wait for LTC to hit $70 and strike, or watch the action unfold? The levels are clear—now it’s your move. Use this analysis to sharpen your edge, and let’s see where Litecoin takes us in the days, weeks, and months ahead.
________________________________________
If you found this helpful, leave a like and comment below! Got requests for the next technical analysis? Let me know, I’m here to break down the charts you want to see.
Happy trading =)

US100 Downtrend Analysis & Key LevelsAfter analysing the US100 chart, the index has been trading within a downtrend channel since Friday, February 21, 2025. After dropping to 19,131, it attempted a recovery but faced strong resistance at 19,957, leading to a decline. As the saying goes, “ Follow the trend—the trend is your friend. ” Given the ongoing downtrend, US100 may continue to decline toward the next strong support level at 18,489.
Ensure you adhere to proper risk management for long-term success.
Happy Trading

SOL ANALYSIS🔮 #SOL Analysis 🚀🚀
💲💲 #SOL is trading in a Ascending Broadening Wedge Pattern and there is a breakdown of the pattern. And we can expect more bearish move towards it's support zone and the a reversal
💸Current Price -- $119.10
⁉️ What to do?
- We have marked crucial levels in the chart . We can trade according to the chart and make some profits. 🚀💸
#SOL #Cryptocurrency #DYOR


MSTR: Mid-term and Macro Price Structure As price holds below $344, odds favor a continuation lower to retest February lows, with later potential bounce and one more push to macro-support levels: 160/150-120 (with a potential extension to 105)
(see. recent idea on BTC price structure)
If BTC and broad market indexes show signs of stabilization and short-term strength over the coming weeks with MSTR price rising above 344, the odds are shifting to a more pronounce bounce to 400-460 resistance levels.
Weekly chart:
From a macro perspective:
as long as price remains below the 460 level, I consider the bullish trend since 2008 lows to have topped in November 2024, with current price action unfolding as part of a larger corrective Wave c.4 structure. Otherwise, If price reclaims ATH the door opens for an extension to 780-1280 resistance levels.
Monthly chart
Recent idea on BTC:

LTC ANALYSIS (support & resistance)🔮 #LTC Analysis 🚀🚀
💲💲 #LTC is trading between support and resistance area. There is a potential rejection again from its resistance zone and pullback from its major support area. If #LTC sustains above major support area then we will a bullish move till its major resistance area
💸Current Price -- $82.20
⁉️ What to do?
- We have marked crucial levels in the chart . We can trade according to the chart and make some profits. 🚀💸
#LTC #Cryptocurrency #DYOR

NKE: Macro structure [Monthly time frame]Price reached the top of the macro support: 56-27.
The correction from Nov'21 top has a picture perfect three-wave structure that has reached area of an ideal extension to finish itself (60-44 support).
Although, within the context of todays market uncertainty, recovery from this support zone, might still be a larger bounce before one more leg-down deeper into macro support
Best of trading and investing decision and thank you for you attention!

Weekly Closing not Good but..Weekly Closing not Good but
the Stock is Still Bullish on Bigger
Time Frames.
Price dropped with Low Volumes.
Weekly Important Support seems to
be around 42.50 - 44.10
49-50 is an Important Resistance as
of now.

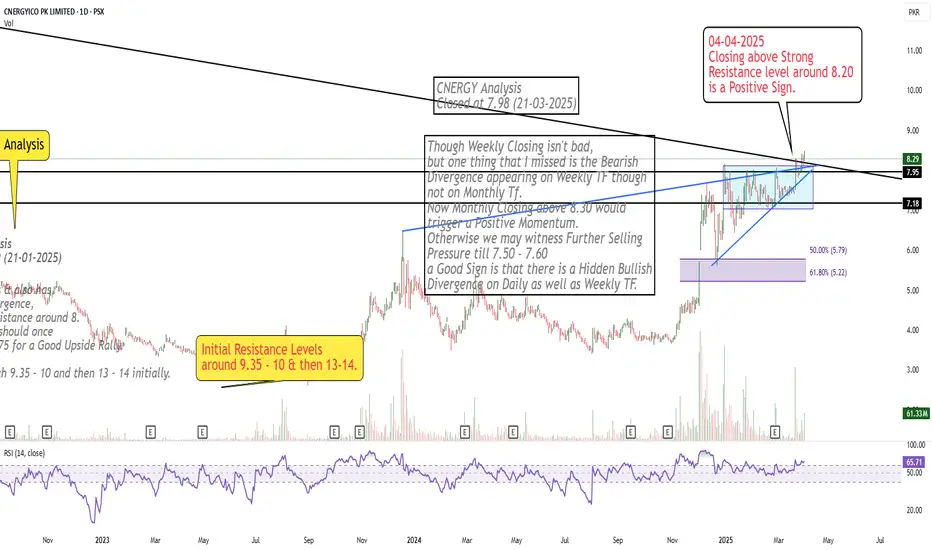
Play wisely!Currently at an Important Support level.
Bullish Divergence on Daily Tf.
Currently also at Channel Bottom.
Couple of Bullish Candles will confirm that
Channel Bottom is respected.

Crossed Important Resistance Area
Closing above Strong
Resistance level around 8.20
is a Positive Sign.
BTC ANALYSIS 🔮 #BTC Analysis 🚀🚀
💲💲 #BTC is trading between support and resistance area. There is a potential rejection again from its resistance zone and pullback from its major support area. If #BTC breaks resistance zone $88500 then there will a chance of bullish movement
💸Current Price -- $84470
⁉️ What to do?
- We have marked crucial levels in the chart . We can trade according to the chart and make some profits. 🚀💸
#BTC #Cryptocurrency #DYOR

NFP REPORT IMPACT ON XAUUSD ALERT!🚨 XAUUSD Market Alert 🚨
🔥 Current Action: XAUUSD is currently range-bound between 3101 and 3114—will it break out soon? The market’s at a critical point, and a sharp move could be on the horizon!
📉 Bearish Scenario: If price slips below this zone, keep an eye on potential support levels at 3070 and 3054. A downward shift could set up fresh opportunities for sellers.
📈 Bullish Scenario: On the flip side, a solid break above 3114 could trigger buying pressure, with targets at 3140 and 3170. A move like this could spark a new uptrend, especially with NFP data on the way, which could impact the gold market!
💬 Let’s Talk Strategy: What’s your take on the XAUUSD setup? Share your insights, and let’s navigate this golden opportunity together! 💰🚀

Warning Signs Flashing: Dow Jones Breaks Key SupportThe Dow Jones Index has officially broken its rising trendline support, signaling a possible shift in the medium-term trend. After losing this key ascending structure, price is now hovering near the psychological support zone of 40,000, which has historically acted as both resistance and support.
This level is crucial. If it holds, we could see a temporary bounce or consolidation. However, if the 40K zone fails to provide support, the index may head toward the next major support area around 38,000, aligned with the longer-term trendline support.
Do like and follow us
THANK YOU
