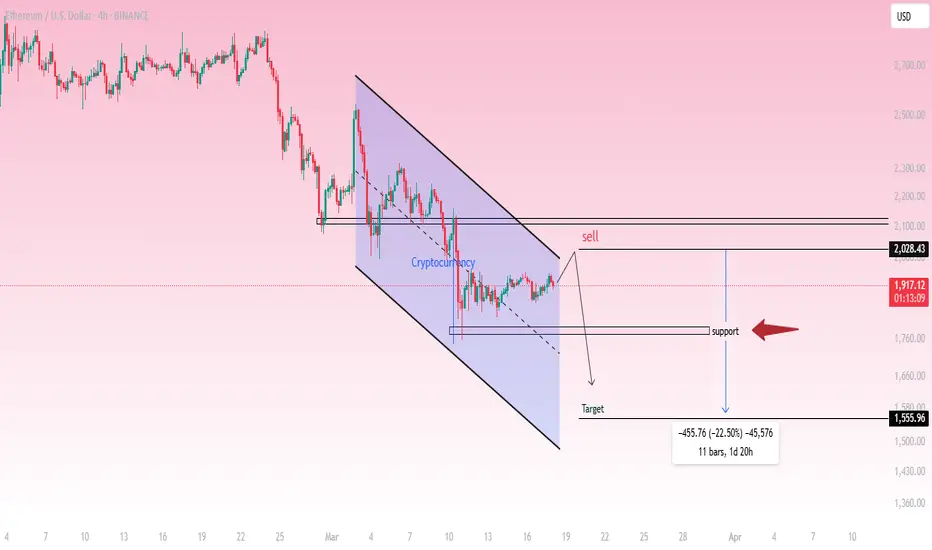
Ethereum (ETH/USD) - 4H Analysis & Trade Setup
Market Overview:
ETH/USD is in a downtrend, forming a descending channel.
Price is currently trading around $1,915.23, showing signs of consolidation near resistance.
Technical Analysis:
Trend: Bearish
Resistance Level: $2,028.43
Support Level: $1,760
Target: $1,555.96
Pattern: Descending Channel
Trade Idea (Short Setup):
🔴 Sell Zone: Around $2,028.43 (Resistance)
✅ Target: $1,555.96 (-22.50%)
⛔ Invalidation: A breakout above $2,028
Conclusion:
Ethereum is respecting the downward channel structure.
A rejection from resistance at $2,028 could confirm further downside.
Traders may consider short positions targeting $1,555.96, provided the trend remains bearish.
📉 Bearish bias remains intact unless price breaks above resistance.
Supportandresistancezones
SPY - support & resistant areas for today March 17, 2025The key support and resistance levels for SPY today are above.
Follow me to get this notified when I publish in the morning.
Understanding key levels in trading can provide valuable insights into potential market movements. These levels often indicate where prices might reverse or consolidate, serving as important signals for traders considering long (buy) or short (sell) positions.
Calculated using complex mathematical models, these levels are tailored for today's trading session and may evolve as market conditions change.
If you find this information beneficial and would like to receive these insights every morning at 9:30 AM, I invite you to support me by boosting this post and following me @OnePunchMan91. Your engagement is greatly valued! However, please note that if this post doesn’t receive more than 10 boosts, I will have to reconsider providing these daily updates. Thank you for your support!
Need any other charts daily, comment on this.
GOOGL ON SUPPORT: 23% BOUNCE IMMINENTNASDAQ:GOOGL GOOGL has consolidated significantly over the last few weeks and, like the NASDAQ, has also taken a beating. Due to the now attractive valuation, the continued stable growth and earnings growth, GOOGL is still a good investment.
Technically, we have reached a trend line and a weaker horizontal support with a further support area at around USD 150. We are already seeing the first RSI divergence. The Bollinger Bands (not shown in the chart, otherwise it would be confusing) are also far overstretched and make a bounce likely. There is also an open gap at $192 - $203.
I would open about 50% of the actual trading position now and the rest when the price falls into the green box, which I still consider to be a possible consolidation area. If the price turns immediately, we are still in with half.
Target Zones:
$192.00
$205.00
Support Zones:
$165.00
$150.00

Bitcoin’s Battlefield: Support, Resistance and Trade SetupsBitcoin’s price has been showing signs of a sustained downtrend after forming a double top pattern. The recent action, combined with low volume and failure to breach key resistance zones, points to a likely retest of lower levels. Over the weekend, the price couldn’t break past the 85K resistance, and the low trading volume around this level suggests that buyer interest is waning.
6H TF Chart:
Big Picture vs. Short-Term Action
On a higher timeframe (6H), my indicator neatly outlines the bear market of 2022 and the bull market that started in early 2023—when the “cloud” turned green, signaling a shift in momentum. The cloud's lower boundary is currently at $73,364, which is key. Imo, holding above 70K is critical for keeping that bullish vibe alive.
1H TF Chart:
Switching over to the 1H chart, the picture shows a bearish structure. The upper resistance around 95K (which aligns with the yearly open near $93,455.85) is proving a solid resistance. The anchored VWAP from the all-time high also sits right at this level, adding more weight to the resistance. Bulls need to clear this yearly open to signal a true recovery.
Key Levels & Confluence Zones
1.) Upper Resistance – 93K to 95K:
The 95K zone aligns closely with the yearly open ($93,455.85) and the anchored VWAP from the all-time high, both acting as resistance.
Daily moving averages (62 EMA at ~$91,316 and 62 SMA at ~$94,900) provide further confluence.
Additional resistance between 85K-86K.
2.) Critical Support – 73K to 70K Zone:
The lower edge of the cloud on the 6H timeframe sits around 73K.
The 0.382 Fibonacci retracement (from the low at $15,473.78 to the all-time high at $109,354) is at $73,492, while the 0.618 retracement (from $49,217 to the all-time high) is around $72,205.
Moving Averages on Weekly Chart: The weekly 62 EMA ($72,919) and 62 SMA ($71,590) align well with this support region.
Additional Support: A bullish monthly order block at $71,320 adds another layer of confluence.
Psychological Importance: A hold above 70K is critical to maintaining bullish momentum.
3.) Monthly Open – $83,385.74:
This level serves as a pivot: price is currently hovering below it. A reclaim by bulls would be a positive sign for higher price action, while a rejection reinforces the bearish setup.
Trade Setups
Long Trade Setup:
Entry: Consider laddering in between 75K and 70K as the price retests support.
Take Profit: Aim for the monthly open (~84K) initially, and if support holds and flips, a move toward 90K could be considered.
Stop Loss: Set below 70K to protect against a further downturn.
Short Trade Setup:
Entry: A short setup can start at the monthly open, using a laddering approach between 84K and about 86.9K.
Take Profit: Target the previous low or 74K.
Stop Loss: Place just above 87K to keep risk in check.
Thank you for taking the time to read through this technical analysis. I hope it provides valuable insights for your trading decisions. Happy trading!

EURGBP nearing resistance – Drop toward 0.8370 next?OANDA:EURGBP is getting close to a key resistance level that has previously acted as a strong barrier, triggering bearish momentum in the past -
This zone is once again a potential point of interest for those looking for short opportunities. Given this, how price reacts here could set the tone for the next move.
If signs of rejection appear: such as long upper wicks, bearish candlestick formations, or a slowdown in bullish momentum, a move toward the 0.83700 is highly possible . However, a decisive breakout above this resistance may invalidate the bearish bias and lead to further upside. Price action at this level will be critical in determining the next move.
Just my perspective on key levels, always confirm setups and maintain solid risk management.

JPY/USD - Bearish Breakdown from Ascending Channel
📉 Market Structure:
The pair has been trending upwards inside a well-defined ascending channel. However, price is now testing the lower boundary of the channel, indicating a potential breakdown. A confirmed break below this support could trigger a bearish move.
🔍Key Levels:
Support Zone: 0.0068122 (Channel Support)
Current Price: 0.0067279
First Target: 0.0065703
Second Target: 0.0064390
📊 Trade Idea:
A confirmed break below the channel support could signal further downside.
If price rejects from this level and starts falling, a short opportunity may be considered targeting 0.0065703 and then 0.0064390.
Traders may look for bearish confirmation before entering short positions.
🚨Confirmation & Risk Management:
Bearish Confirmation: A strong break below 0.0068122 with volume.
Invalidation: A strong bounce from support and a move back inside the channel.
Risk Management: Stop-loss can be placed above 0.0068122 to protect against false breakouts.
This setup suggests a potential trend reversal if price fails to hold the channel support. Traders should watch for confirmation before executing trades.

#REDUSDT continues its downtrend📉 Short BYBIT:REDUSDT.P from $0,7814
🛡 Stop loss $0,8061
🕒 1H Timeframe
⚡️ Overview:
➡️ The main POC (Point of Control) is 0,5802
🎯 TP Targets:
💎 TP 1: $0,7600
💎 TP 2: $0,7330
💎 TP 3: $0,7112
📢 Monitor key levels before entering the trade!
BYBIT:REDUSDT.P continues its downtrend — watching for further movement!

DOGE Holding Trendline Support – Another Rally Incoming?$DOGE/USDT is currently holding support at the rising trendline, which has historically led to strong upward moves. Every time the Stochastic RSI formed a bullish crossover near this trendline, the price experienced a significant bullish rally.
The Stoch RSI is currently in the oversold zone, similar to previous points where major uptrends started. If history repeats, DOGE could be gearing up for another strong move.
DYOR, NFA

SOL Trading Plan: Stacking Entries Like a ProSolana (SOL) has been in a slow uptrend over the past five days, after hitting the low at $112. The current price action looks like an ABC corrective pattern, which could mean we’re setting up for lower prices.
To get the best trade execution, we'll use a laddered entry approach, meaning we’ll scale into positions gradually instead of going all in at once. This helps us get a better average entry price while managing risk effectively. By placing orders at key levels, we increase our chances of catching the right move without overcommitting too early.
Resistance Zone ($136 - $143.80)
A major resistance zone has formed between $136 - $143.80, where price is likely to struggle. This area contains multiple technical confluences that suggest a potential reversal or strong reaction:
$136 – 0.618 Fibonacci Retracement
$140.09 – 1:1 Trend-Based Fibonacci Extension
$141.40 – Anchored VWAP from the $179.85 swing high
$143.80 – Point of Control (POC) from the 19-day Fixed Range Volume Profile
This makes $136 - $143.80 a prime area to consider short positions, especially if price starts showing weakness.
Support Zone ($102.1 - $98.50)
On the downside, a major demand zone is forming between $102.1 - $98.50, where buyers are likely to step in aggressively. This zone has multiple technical confluences, making it a high-probability long entry area:
$102.1 – 2024 Yearly Open & Monthly Support
$100 – Bullish Monthly Order Block & Anchored VWAP Support
$98.50 – Final key demand zone
This zone presents a solid long opportunity, allowing for gradual scaling into positions as price moves deeper into support.
Short Trade Setup – Laddered Entry Approach
Instead of entering all at once, we’ll ladder into the short position gradually, starting small and increasing size as price moves deeper into resistance.
Short Entry Levels & Position Sizing
Trade Details
Average Entry Price: $140.12
Take Profit Target: slightly above $102.10 (Monthly Level)
Stop Loss: slightly above $146.70 (Above POC)
Risk-Reward Ratio (R:R): ~6:1
Long Trade Setup – Laddered Entry Approach
For the long setup, we start with small entries at higher prices and increase size as price moves deeper into support, ensuring a better average entry in a key demand zone.
Long Entry Levels & Position Sizing
Trade Details
Average Entry Price: $102.72
Take Profit Target: slightly below $120.00
Stop Loss: slightly below $95.00
Risk-Reward Ratio (R:R): ~2.45:1
Market Outlook
Short Bias: Until price reclaims $143.80, this remains a strong resistance zone for potential short trades.
Short Setup: Laddering into resistance ensures better risk management and higher average entry efficiency.
Long Setup: Starting small at $112 and increasing position size down to $98.50 ensures strong positioning in a high-confluence demand zone.
By scaling into trades rather than committing at a single price, we increase flexibility, improve trade execution, and adapt better to price movements. 🚀
Weekly Timeframe - 200 EMA Support
$100 coincides with the 200 EMA on the weekly timeframe, adding confluence to this area as strong support.
If Solana decisively breaks above $144, it would invalidate the short thesis and suggest a potential move higher toward $150. Conversely, a strong rejection from the resistance zone would likely accelerate the move toward $112 to test demand at swing low.

Short setup on SPX (x2)After the most recent upward move, the SPX shows clear signs of weakness, suggesting a potential short setup.
Since mid-July, the SPX has been moving upward and it's now near its all-time high. However, the RSI Exhaustion at the bottom of the chart has significantly declined and hasn't recovered much, establishing a downtrend.
This divergence between the price and the RSI Exhaustion is the first major signal of a possible short configuration.
Three additional signs support this setup:
The RSI Exhaustion shows recent bullish exhaustion (indicated in green), signaling that further price increases are unlikely.
The price has formed a top just shy of its all-time high, as identified by the Bottoms Tops Signal indicator.
A major level has formed, as indicated by the Levels and Zones indicator. While this level turned into support, it originated as resistance and could well revert back to it should be price start to drop further.
Is the bull run over? Only time will tell, but for now, it's crucial to remain patient and always seek confirmation from the indicators.

#OIKUSDT continues its downtrend📉 Short BITGET:OIKUSDT.P from $0,0870
🛡 Stop loss $0,0909
🕒 1H Timeframe
⚡️ Overview:
➡️ The main POC (Point of Control) is N
🎯 TP Targets:
💎 TP 1: $0,0833
💎 TP 2: $0,0795
💎 TP 3: $0,0769
📢 Monitor key levels before entering the trade!
BITGET:OIKUSDT.P continues its downtrend — watching for further movement!

CADCHF - Bullish Signals - 99 Percent successful Hit chancesCADCHF Shows Bullish Weights More than Bears !!!!
Bullish Confluences:
1- Bullish Divergence
2- Major Support Level Testing and Breaking
3- LH Broken
4- Bearish Wedge Pattern
5- Sentiments of Long are > 90 percent
6- Completion of AB=CD pattern
TRADE PLAN :
Enter into the market at Current market price and take profit on defined FIB level as TP1 TP2 and TP3
STOP LOSS below LL

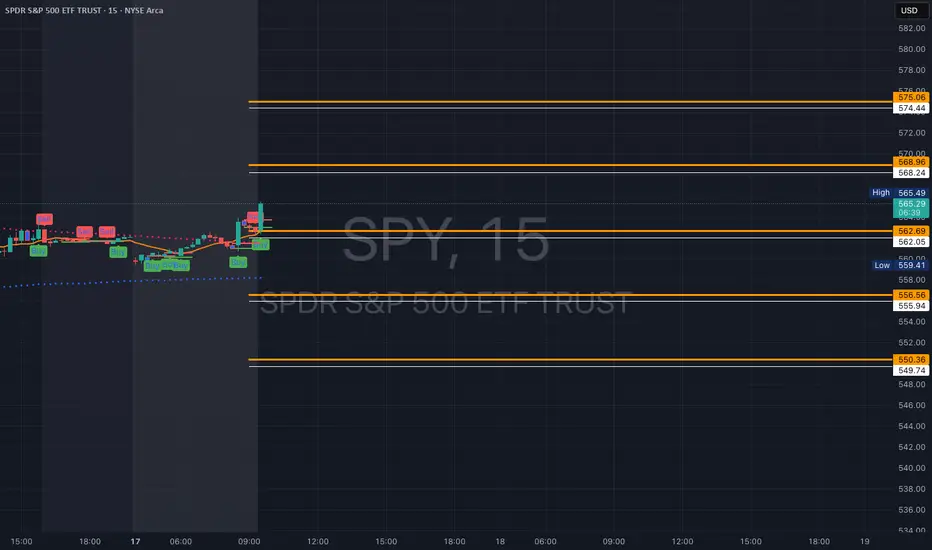
SPY - support & resistant areas for today March 14, 2025The key support and resistance levels for SPY today are above.
Follow me to get this notified when I publish in the morning.
Understanding key levels in trading can provide valuable insights into potential market movements. These levels often indicate where prices might reverse or consolidate, serving as important signals for traders considering long (buy) or short (sell) positions.
Calculated using complex mathematical models, these levels are tailored for today's trading session and may evolve as market conditions change.
If you find this information beneficial and would like to receive these insights every morning at 9:30 AM, I invite you to support me by boosting this post and following me @OnePunchMan91. Your engagement is greatly valued! However, please note that if this post doesn’t receive more than 10 boosts, I will have to reconsider providing these daily updates. Thank you for your support!
Need any other charts daily, comment on this.

Gold (XAU/USD) Trade Update**Gold (XAU/USD).
### **Key Observations:**
✔ **Uptrend Strength:** Gold had a strong bullish move earlier, with a notable spike in volume.
✔ **Support & Resistance:**
- **Immediate support:** Around **$2,932 - $2,928** (black moving average line).
- **Resistance:** Around **$2,936 - $2,940**, where price struggled to break higher.
✔ **Moving Averages:**
- The **short-term (red & blue)** moving averages are trending upwards, signaling ongoing bullish momentum.
- The **long-term (black) moving average** remains below, supporting the uptrend.
### **Potential Scenarios:**
📈 **Bullish Case:** If Gold breaks above **$2,936 - $2,940**, it could re-test **$2,950** and move toward higher highs.
📉 **Bearish Case:** A break below **$2,928** could trigger a retest of lower supports near **$2,920 - $2,912**.

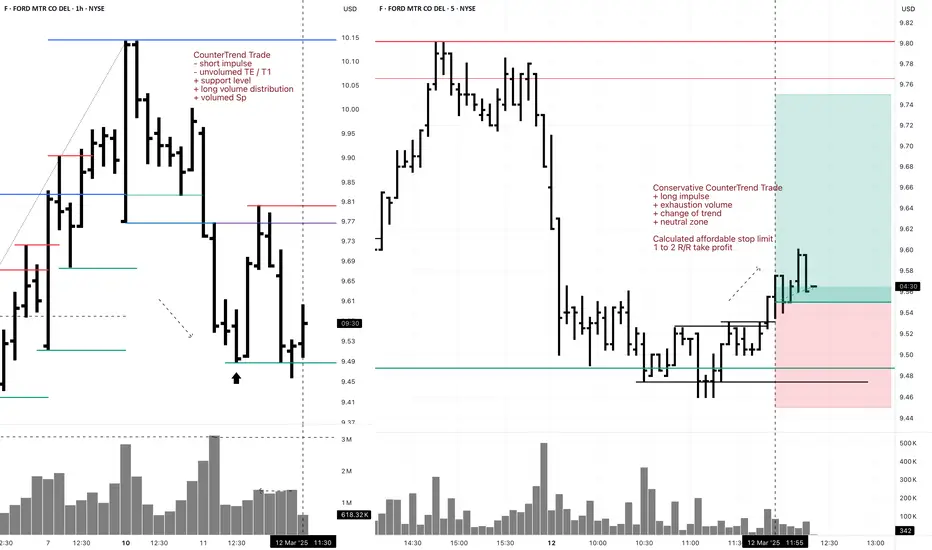
F 5M DayTrade Long Conservative CounterTrend TradeConservative CounterTrend Trade
+ long impulse
+ exhaustion volume
+ change of trend
+ neutral zone
Calculated affordable stop limit
1 to 2 R/R take profit
1H CounterTrend
"- short impulse
- unvolumed TE / T1
+ support level
+ long volume distribution
+ volumed Sp"
1D CounterTrend
"+ long impulse
- biggest volume on correction
- below SOS test level
- below support level
+ 1/2 correction"
1M Trend
"- short impulse
+ 1/2 correction
- unvolumed T1
+ support level
+ reverse volume approach
+ volumed manipulation"
1Y Trend
"+ long impulse
+ volumed T2 level
+ volumed 2Sp+
+ weak test"
F 5M Daytrade Conservative CounterTrend TradeConservative CounterTrend Trade
+ long impulse
+ T1 level
+ support level
+ 1/2 correction
+ volumed 2Sp-
Calculated affordable stop limit
1 to 2 R/R take profit
1H Countertrend
"- short impulse
- unvolumed TE / T1
+ support level
+ long volume distribution
+ volumed Sp
+ test"
1D Trend
"+ long impulse
- biggest volume on correction
- below SOS test level
- below support level
+ 1/2 correction"
1M CounterTrend
"- short impulse
+ 1/2 correction
- unvolumed T1
+ support level
+ reverse volume approach
+ volumed manipulation"
1Y Trend
"+ long impulse
+ volumed T2 level
+ volumed 2Sp+
+ weak test"

Bulls and Bears zone for 03-13-2025Yesterday, even though it was a down day; S&P 500 closed above its mid point of the days trading range.
Any test of yesterday's Close could provide direction for the day.
Level to watch: 5602 --- 5600

PEAQ down 87% – Is it Time to Buy the Dip?PEAQ has been in a brutal downtrend, dropping 87% within 92 days and printing 9 straight weekly red candles, with the 10th currently red as it trades below the weekly open. Now, price is attempting to stabilise around the key $0.10 level, hinting at a potential high-probability long trade setup.
Key Levels to Watch:
Support: $0.10 (Price has been trying to hold this level for two days.)
Resistance: $0.11 (A reclaim of this level increases the probability of a move higher.)
Major Resistance: $0.1260 – $0.1280 (Weekly open + bearish order block.)
Technical Confluences Supporting the Trade:
The Fib retracement from $0.1337 to $0.0989 shows that the 0.786 Fib level ($0.1263) aligns with the bearish order block from the previous trading range.
The weekly open at $0.128 strengthens the take-profit zone, making it a logical exit point.
Price has failed to break below $0.10, signaling a possible accumulation phase.
Long Trade Setup
Entry: Around $0.10
Stop Loss: Below $0.0989 (Tight SL for minimal risk)
Take Profit Target: $0.1260 (Right before key resistance)
Risk-to-Reward (R:R): 17:1 🚀 (Risking only 1.5% to potentially gain 25%)
Additional Play:
If price reclaims $0.11 with strong volume, look for order flow confirmation to add to the position. The move towards $0.12+ could be quick, as there's little resistance in between.
This setup offers a strong risk-reward ratio, making it an attractive trade with minimal downside and high upside potential. Watch for bullish momentum above $0.11, as that could confirm a stronger push to the weekly open at $0.128.

#BANANAUSDT maintains bearish momentum📉 Short BYBIT:BANANAUSDT.P from $14.905
🛡 Stop loss $15.490
🕒 1H Timeframe
⚡️ Overview:
➡️ The main POC (Point of Control) is at 16.112, indicating the area with the highest trading volume.
➡️ The 15.490 level acts as a local resistance, as the price previously faced selling pressure there.
➡️ The volume and market profile highlight areas of high trader activity, especially in the 14.250 – 15.500 range.
➡️ The chart shows a potential decline after an impulse move and profit-taking.
🎯 TP Targets:
💎 TP 1: $14.580
💎 TP 2: $14.250
💎 TP 3: $13.920
📢 Monitor key levels before entering the trade!
📢 If 15.490 is broken upward, the trade may be invalidated.
📢 If the price continues to decline and breaks through TP 1, the downside potential remains.
BYBIT:BANANAUSDT.P maintains bearish momentum — expecting further downside movement!

Play on Levels124 - 124.50 Very Important Support on Monthly Basis.
Bearish Divergence on Weekly TF that is why it pushed the
price downwards.
Now Hidden Bullish Divergence & Bullish Divergence on Hourly
TF has triggered the price up. Bullish Momentum will resume
once 146 is Crossed & Sustained. Now it is Important to Sustain 134
on Monthly TF & if 165 is Crossed & Sustained, Next Target
can be around 190+
On Daily TF, 134 - 135 is a Resistance. Crossing it will
touch the price around 138-139

$ETSY hitting buy zonesLooking for a continuing downside on NASDAQ:ETSY to the $41-$42 area. Would look to add calls around there to a bounce of $45-$50.
WSL

AUDUSD 1hr Price ActionWait for the price leave the consolidation zone.
If it comes out in Long, wait for the retest in the support and look to enter in Long.
If it goes short, wait for the Retest at resistance and look to go short.

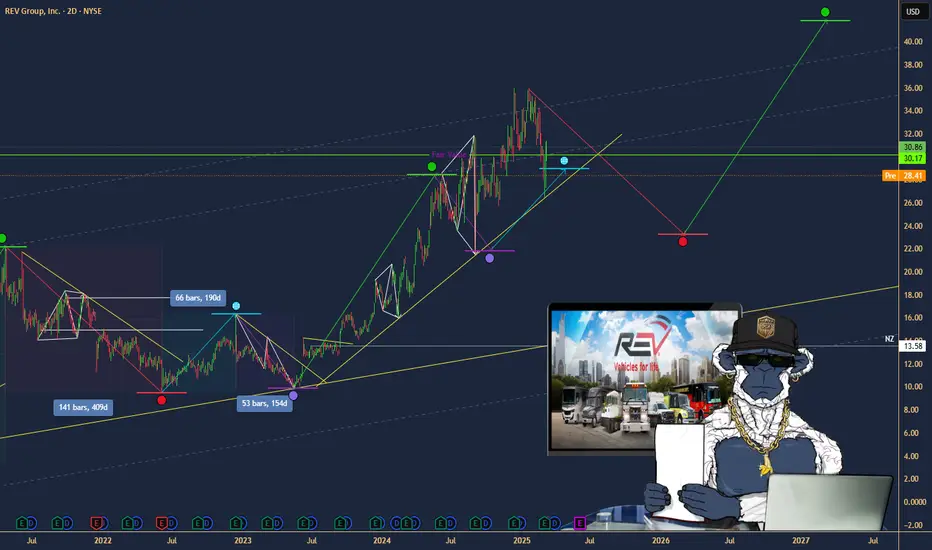
$REVG: REV Group – Riding the Specialty Vehicle Wave?(1/9)
Good morning, everyone! 😄
NYSE:REVG : REV Group – Riding the Specialty Vehicle Wave?
With NYSE:REVG at $31.00, is this stock revving up for growth or hitting a speed bump? Let’s dive into the details! 😎
(2/9) – PRICE PERFORMANCE 📊
• Current Price: $32.00 as of 12-03-2025 😊
• Recent Moves: Up from last month, showing steady growth. 📈
• Sector Vibe: Specialty vehicles sector is stable, with consistent demand from public services and commercial clients. 🚒🚜
Short commentary: REVG’s price is on an upward trajectory, reflecting positive market sentiment. Let’s see what’s driving this! 🚀
(3/9) – MARKET POSITION 📈
• Market Cap: Approximately $1.75B (based on 52.13M shares * $32.00) 💰
• Operations: Designs, manufactures, and distributes specialty vehicles like fire trucks, ambulances, and recreational vehicles. 🚓🏎️
• Trend: Increasing focus on customization and technology integration in vehicles. ⚙️
Short commentary: REVG is a key player in the niche market of specialty vehicles, with a diverse portfolio that caters to various sectors. Their market position seems solid. 🌟
(4/9) – KEY DEVELOPMENTS 🔑
• Exited bus manufacturing business by selling ElDorado National, focusing on core segments. 🚐
• Provided fiscal 2025 guidance, showing confidence in future performance. 📈
• Increased quarterly dividend by 20%, signaling strong cash flow and shareholder value focus. 💸
Market Reaction: Positive, with stock price reflecting these developments. Investors are optimistic about the company’s strategic moves. 😃
Short commentary: These developments suggest that REVG is streamlining its operations and focusing on more profitable areas, which should benefit shareholders. 👏
(5/9) – RISKS IN FOCUS ⚠️
• Economic slowdown could reduce demand for new vehicles, especially in the commercial sector. 🌦️
• Supply chain disruptions might affect production schedules and costs. 🚚
• Increased competition in the recreational vehicles segment. 🏕️
Short commentary: While there are risks, REVG’s diversified portfolio and focus on essential services might mitigate some of these challenges. It’s important to monitor these factors closely. 🕵️
(6/9) – SWOT: STRENGTHS 💪
• Strong brand portfolio with recognized names in the industry. 🏆
• Diverse customer base across public services and commercial clients. 🌐
• Recent strategic decisions to exit less profitable segments. 🚫
Short commentary: REVG’s strengths lie in its well-established brands and broad customer reach, which provide stability and growth opportunities. 💪
(7/9) – SWOT: WEAKNESSES & OPPORTUNITIES ⚖️
• Weaknesses: Dependence on economic conditions and potential regulatory changes. 📜
• Opportunities: Growth in the fire and emergency segment due to increased public safety spending. 🚒
Short commentary: While there are weaknesses tied to external factors, the opportunities in expanding sectors like fire and emergency services could drive future growth. It’s a balancing act! ⚖️
(8/9) – 📢REV Group at $32.00, with recent positive developments—your call?
• Bullish: $40+ soon, due to strategic focus and increased dividend. 🚀
• Neutral: Steady growth, maintaining current trends. 🛴
• Bearish: $25 drop, if economic conditions worsen. ⬇️
Drop your pick below! 😄
(9/9) – FINAL TAKEAWAY 🎯
REV Group’s $31.00 stance shows resilience and strategic planning, but economic risks linger. Volatility’s our ally—dips are DCA treasure. Snag low, soar high! Will it rev up or slow down?