CHFJPY at Key Support Level - Potential Buy SetupOANDA:CHFJPY is at a significant demand zone that has consistently triggered bullish reversals in the past. This zone has previously acted as a strong support level and now as price tests this area again, it creates a potential opportunity for buyers to regain control.
I expect the price to move toward 168.60. On the other hand, a break below this support could signal further downside.
Just my take on support and resistance zones—not financial advice. Always confirm your setups and trade with solid risk management.
Supportandresistancezones

EURGBP at major support zone: Bullish Rebound ExpectedOANDA:EURGBP is approaching a significant support zone, highlighted by previous price reactions and strong buying interest. This area has historically acted as a key demand zone, increasing the likelihood of a bounce if buyers step in.
The current market structure suggests that if the price confirms support within this zone, we could see a bullish reversal. A successful rebound could push the pair toward the 0.83350 level, a logical target based on past price behavior and structural confluence.
Just my take on support and resistance zones—not financial advice. Always confirm your setups and trade with solid risk management.
Best of luck!

AAVE Retests Key Support – Bullish Reversal Ahead?CRYPTOCAP:AAVE is currently retesting a rising support line after breaking through a key resistance zone, which has now turned into support.
This structure suggests that the uptrend remains intact, and the recent dip could be a healthy pullback before a continuation to the upside.
DYOR, NFA

AUDJPY bullish continuation to expect
OANDA:AUDJPY trend based analysis, we are can see price is make break of zone on 11.Feb, its make strong bullish push, price is also break and CHANNEL pattern, currently price is on valid sup zone, technicals are strong bullish also. Personally here strong bullish expectations.
SUP zone: 96.200
RES zone: 98.100, 98.600

GBPJPY strong bearish expectations
GBPJPY CHANNEL pattern visible, price is break zone and here now expecting to see bearish strong push.
SUP zone: 192.100
RES zone: 188.000, 187.100

EURGBP new bearish?
OANDA:EURGBP we are have strong bearish push, currently we can see BEARIS HFLAG patter and zone is in BF, bouth are breaked, +price is bounce few times on strong sup zone 0.83600, here still higher bearish expecting.
SUP zone: 0.83600
RES zone: 0.82500, 0.82300

USOIL BUY PositionChart and lines talk to you...
Manage your risk...
R/R4 or more...
Do you think does it worth to risk on this position??

EUR USD Trade Setup 4 hour timeframe EUR USD has formed a break and retest pattern on the 4 hour timeframe turning support into resistance.
So we will be looking for selling opportunities from the lower timeframe'
SWING IDEA - SAILSAIL Stock Technical Analysis
Steel Authority of India Limited ( NSE:SAIL ) has been consolidating around the 95 resistance level for over a year. After multiple attempts, the stock finally broke out above this level in January 2024, turning it into a strong support zone.
Following the breakout, SAIL surged to a peak of 175, marking an 85% gain. However, the stock then saw a sharp retracement, correcting by nearly 47% and revisiting the rising trendline support around the 100-105 range. This level, which previously acted as resistance, has now become a critical demand zone.
Currently, SAIL is showing signs of renewed bullish momentum, bouncing off its trendline support and forming a potential reversal. The weekly MACD crossover, observed in the chart, further reinforces a trend reversal signal. Additionally, a short-term upside target of 12% is indicated, while a long-term potential target of 76% upside is visible in the chart, aligning with the previous swing high.
The chart also highlights three take-profit targets:
Target 1: The first profit-taking zone, offering an initial opportunity to secure gains.
Target 2: A mid-level profit-taking zone, aligning with previous consolidation areas.
Target 3: The final take-profit level around 175, marking the prior high and a potential full exit point for long-term investors.
KEY OBSERVATIONS:
One-year resistance of 95 was decisively broken in January 2024
Stock surged 85% to a high of 175 before correcting 47%
100-105 level now acts as a strong rising trendline support
Weekly MACD crossover signals a bullish momentum shift
Three take-profit targets identified, with the final target at 175
Potential upside target of 76% from support levels, aligning with previous highs
RECOMMENDATION:
Based on this technical analysis, holding SAIL for the long term could be a strong strategy. The potential returns include:
12% upside in the short term
76% upside from current levels, targeting previous highs around 175
This analysis presents a compelling buying opportunity in SAIL, fueled by its breakout, support validation, and momentum reversal.
IMPORTANT NOTE:
Investors should be aware that there is a chance the stock may retest the 100-105 support level before resuming its upward trajectory. This potential pullback should be carefully monitored, and investment strategies should be adjusted accordingly.
DISCLAIMER: This analysis is for educational and informational purposes only and should not be considered as financial advice. Technical indicators and historical data are not guarantees of future performance. Investors should conduct thorough research, assess risk tolerance, and consult a financial advisor before making any investment decisions.

US DOLLAR: Sell Opportunity after support breakTVC:DXY has broken below a key support zone, indicating a potential shift in momentum. The price is now retesting this zone, which previously acted as support and could serve as resistance, aligning with a potential bearish continuation.
If sellers confirm resistance at this level, the price is likely to decline further toward the 105.800 target , which aligns with a major support level. Conversely, a breakout above the zone could signal further upside.
Before considering short positions, look for bearish confirmation signals such as bearish engulfing candles, strong wicks rejecting the resistance zone, or increased selling volume.
Just my take on support and resistance zones—not financial advice. Always confirm your setups and trade with solid risk management.
Best of luck!

Potential upside for EUR/JPYHello traders
The impulse wave for EUR/JPY is rising and there is an expanding pattern. I expect another impulse wave to rise.

USDJPY - at potential Buy SetupOANDA:USDJPY is nearing a significant support area that has reversed bearish trends into bullish momentum. This support level aligns with prior price reactions and represents a strong foundation for potential upward moves.
If buyers confirm their presence with bullish price action, such as long lower wicks or bullish engulfing candles, I expect the price to go toward 151,100. Also, a break below this support could signal further bearish continuation.
Just my take on support and resistance zones—not financial advice. Always confirm your setups and trade with solid risk management!

SPX500: Possible bounce from key support toward 5,980?FOREXCOM:SPX500 has reached a significant support zone, highlighted by previous price reactions and strong buying interest. This area has acted as a key demand zone, increasing the likelihood of a bullish bounce if buyers step in.
The current market structure suggests that if the price confirms support within this zone, we could see a bullish reversal. A successful rebound could push the price toward 5,980 . However, if the price breaks below this zone, the bullish outlook may be invalidated, opening the possibility for further downside.
Just my take on support and resistance zones—not financial advice. Always confirm your setups and trade with solid risk management.
Best of luck!

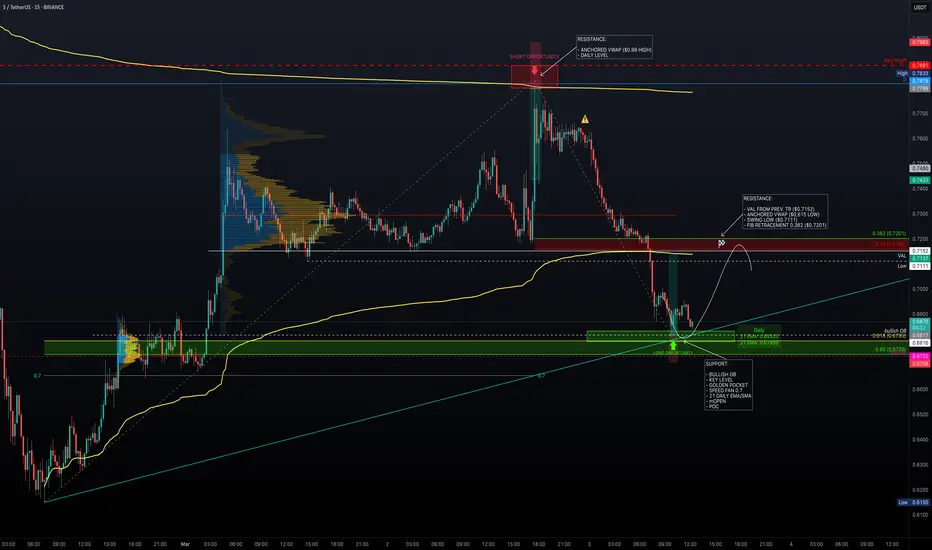
Major Levels – Is Sonic Ready to Pump?After reaching the daily resistance level ($0.7818), price faced strong rejection. The anchored VWAP, acting as dynamic resistance just below the daily level, provided additional confluence for a low-risk short opportunity.
Additionally, a key high at $0.7891 further reinforced this resistance zone. Following the rejection, price sharply declined -13%, retracing back into the previous trading range.
Support Confluence
Price is now approaching a well-defined support zone:
Bullish Order Block: $0.6816
Key Level Near Order Block: $0.6803
Golden Pocket (Fib 0.618 - 0.65): 0.618 at $0.6793 & 0.65 at $0.6739
Monthly Open: $0.6732
Point of Control (POC): $0.6732 (aligning with Monthly Open)
Daily 21 EMA/SMA: 21 EMA at $0.6835 & 21 SMA at $0.6790
Fib Speed Fan 0.7 (from $0.615 to $0.7818): Providing additional support in this zone
Long Trade Setup
Entry Zone: $0.6816 – $0.6732
Stop Loss: Below the Monthly Open ($0.6732)
Take Profit Zone: $0.7111 – $0.7201
Risk-to-Reward (R:R): 3:1 R:R setup, offering a high-probability trade
Take Profit Targets & Resistance Zones
Previous Swing Low: $0.7111 (untested)
Value Area Low (VAL): $0.7152
Anchored VWAP (from $0.615 low): $0.7137
Fib Retracement 0.382 (from $0.7818 high to current low): $0.7201
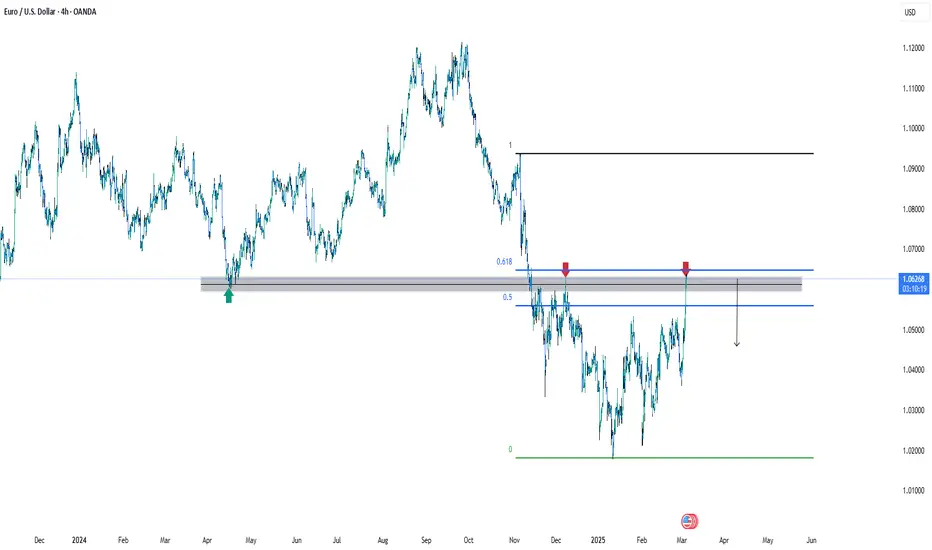
Price at a Crossroads: Will It Break or Drop?After a strong breakout from a falling wedge and handle pattern on Wednesday, Nov 6, 2024, price surged to an All-Time High of 109,358.01. However, a retracement followed, with the formation of a double top pattern leading to a breakdown below the neckline at 91,809.11, sending prices tumbling to 78,167.81, perfectly aligning with the golden ratio (50% Fibonacci level).
From there, buyers stepped in, pushing the price back up to the 38.2% Fibonacci level, but strong resistance led to two rejections and the formation of three consecutive doji candles, signalling market indecision.
What’s Next?
🔹 Bullish Scenario: A breakout above 38.2% could lead to a neckline retest 91,809.11.
🔹 Bearish Scenario: If rejection holds, the double top projection targets is 74,279.20, with further downside towards 61.8% or 66%, aligning with the daily trendline.
📢 Risk Management Reminder:
The market is at a critical level—manage your risk wisely! Set stop losses, use proper position sizing, and avoid over-leveraging. Patience and discipline are key!

BTC Scaling Strategy: Trade Like a Pro with Precision EntriesIf you’re new to trading, this guide will walk you through a scaling in and out strategy. We’ll cover:
Risk management – protecting your capital.
Entry points – how to build your position gradually.
Exit points – how to lock in profits while leaving room for further gains.
Maximising profit – using a small runner to capture additional upside.
By the end, you'll understand:
✅ How to enter trades at optimal levels
✅ How to take profits gradually
✅ How to manage risk so you don’t blow your account
BTC Market Analysis
Bitcoin has been trading in a tight range for over 100 days near the 100K mark. For 22 consecutive days, bulls have tried to break above 100K, but as the price nears this level, bears consistently rejected the move. Currently, BTC broke below our critical support level at 90K confirming a breakdown in market structure. Adding fuel to the bearish fire, Bitcoin has slipped below the weekly 21 EMA (89,503) and SMA (90,437). With the bears now in control, the critical question emerges: Where will Bitcoin find its next foothold? Let’s map the high-probability support zones and strategic entry points for the next potential long opportunity.
Using Fibonacci analysis:
Fib Speed Fan: With a low of 49K and an ATH of 109,588 (from March), the 0.618 trend line projects support between about 78K and 82K.
Anchored VWAP: When anchored from 49K, the VWAP support is around 81.7K.
Negative Fibonacci Retracement: From the ATH down to the current low at 91,231, the –0.618 level is at about 79,886.
Fib Extension & Retracement: Additional levels lie around 79,466 (1.618 extension) and 79,230 (0.5 retracement).
Moving Averages: The 233 EMA/SMA currently ranges between roughly 83K and 78.5K.
These indicators converge to form a robust support zone between approximately 83K and 78K. For a more detailed breakdown, please check my previous Bitcoin analysis, where I conducted a deeper examination.
Step 1: Understanding Risk Management (The Golden Rule)
Before placing a trade, you must decide:
📌 How much you’re willing to lose (risk per trade)
📌 Where you’ll enter and exit (never place a trade without a plan)
How Much Should You Risk?
Always risk no more than 1–2% of your total account on a single trade.
Example (for a $100K Account):
1% Risk = $1,000 max loss
2% Risk = $2,000 max loss
For this trade, we plan to risk about $1,366, which is approximately 1.37% of a $100K account. This disciplined approach protects your capital over the long run.
Step 2: Where Do We Enter the Trade? (Scaling In)
Instead of going all-in at one price, we break our $30,000 investment into 10 smaller entries and exits. This method reduces risk and often achieves a better average entry price.
💡 Why? Because no one can time the exact bottom! Spreading entries reduces risk and gets a better average entry price.
www.tradingview.com
BTC Buy (Entry) Levels
We will buy BTC as it falls from $83,050 down to $78,050 using the following allocation percentages:
Entry # Price (BTC) % of Position Amount Invested ($) BTC Acquired
1 83,050 5% $1,500 1,500 ÷ 83,050 = 0.018072
2 82,550 5% $1,500 1,500 ÷ 82,550 = 0.018181
3 82,050 5% $1,500 1,500 ÷ 82,050 = 0.018278
4 81,550 8% $2,400 2,400 ÷ 81,550 = 0.029430
5 81,050 8% $2,400 2,400 ÷ 81,050 = 0.029606
6 80,550 10% $3,000 3,000 ÷ 80,550 = 0.037234
7 80,050 12% $3,600 3,600 ÷ 80,050 = 0.044974
8 79,550 12% $3,600 3,600 ÷ 79,550 = 0.045275
9 79,050 15% $4,500 4,500 ÷ 79,050 = 0.056956
10 78,050 20% $6,000 6,000 ÷ 78,050 = 0.076352
Total Investment: $30,000
Total BTC Acquired:
0.018072 + 0.018181 + 0.018278 + 0.029430 + 0.029606 + 0.037234 + 0.044974 + 0.045275 + 0.056956 + 0.076352 ≈ 0.37436 BTC
Average Entry Price: $80,150
Stop Loss: Set at $76,500
Risk per BTC: $80,150 – $76,500 = $3,650
Total Risk: 0.37436 BTC × $3,650 ≈ $1,366 (~1.37% of $100K)
Step 3: Where Do We Exit the Trade? (Scaling Out)
We exit gradually as BTC rises between $86,950 and $91,450. The exit percentages are as follows:
Exit # Price (BTC) % of Position BTC Sold Proceeds ($)
1 86,950 5% 0.018718 0.018718 × 86,950 = $1,628.10
2 87,450 5% 0.018718 0.018718 × 87,450 = $1,637.03
3 87,950 8% 0.029949 0.029949 × 87,950 = $2,638.15
4 88,450 12% 0.044924 0.044924 × 88,450 = $3,976.39
5 88,950 14% 0.052420 0.052420 × 88,950 = $4,664.19
6 89,450 14% 0.052420 0.052420 × 89,450 = $4,691.19
7 89,950 12% 0.044924 0.044924 × 89,950 = $4,047.12
8 90,450 10% 0.037436 0.037436 × 90,450 = $3,388.20
9 90,950 5% 0.018718 0.018718 × 90,950 = $1,705.71
10 91,450 15% 0.056154 0.056154 × 91,450 = $5,137.68
Total BTC Sold: 0.018718×3 + 0.029949 + 0.044924×2 + 0.052420×2 + 0.037436 + 0.056154 = 0.374381 BTC (matches our total acquired ~0.37436 BTC)≈ $33,488.26
Profit on the Trade: Total Proceeds – Total Investment = $33,488.26 – $30,000 = +$3,488.26
Return on the Trade:
$3,488.26/$30,000×100≈11.63%
On Overall Account: For a $100K account, $3,488 represents a gain of about 3.49% if fully realised on this trade.
Risk-to-Reward Ratio: Risk = $1,366; Reward = $3,488; Ratio ≈ $3,488 / $1,366 ≈ 2.55:1
Step 4: Profit & Risk Summary
Metric – Per Trade - Based on $100K Account
Total Investment - $30,000 - $30,000 (30%)
Risk (Stop Loss) - $1,366 (4.6%) - $1,366(1.37%)
Profit (Closed) - $3,488 (11.63%) - $3,488 (3.49%)
Profit + Runner - $4,311.18 (14.37%) - $4,311.18 (4.31%)
Risk-to-Reward Ratio Calculation:
If Stop Loss Hits ($76,500):
Average Entry Price: $80,150
Loss per BTC: $80,150 – $76,500 = $3,650
Total Risk: 0.37436 BTC × $3,650 ≈ $1,366 (1.37% of a $100K account)
If BTC Reaches Our Exit Targets:
Total Proceeds: ≈ $33,488
Profit: $33,488 – $30,000 = $3,488
Profit Percentage on Trade: ~11.63%
Overall Account Impact: ~3.49% gain on a $100K account
Risk-to-Reward Ratio: ~2.55:1
Step 5: The Power of Scaling In & Out
Capital Protection: You risk only about $1,366 (1.37% of a $100K account), protecting your capital even during a series of losses.
Optimised Entry: Scaling in from $83,050 to $78,050 yields an average entry of about $80,150—significantly lower than the top price.
Profit Locking: Scaling out from $86,950 to $91,450 allows you to lock in profits at multiple levels, ensuring you capture gains along the way.
Healthy R:R: With a risk-to-reward ratio of approximately 2.55:1, your potential reward significantly outweighs your risk.
Discipline & Consistency: This structured approach minimises emotional trading and helps you stick to your plan.
Optional Note: While this guide fully closes the trade, leaving a small portion (15%) open (runner) is an option if BTC continues to rally.
Step 6: Final Pre-Trade Checklist
🔹 Support & Resistance: Is BTC trading near a strong support zone?
🔹 Technical Indicators: Is BTC holding above key moving averages (e.g., 21 EMA/SMA)?
🔹 Risk Management: Are you only risking 1–2% of your total account?
🔹 Trade Plan: Are you scaling in and out instead of going all-in? Are your entry levels and exit levels clearly defined?
🔹 Market Confirmation: Do volume, candlestick patterns, and order flow support your trade setup?
Conclusion
✅ We protect our money by limiting risk
✅ We enter trades gradually (scaling in)
✅ We take profits at multiple levels (scaling out)
✅ We fully close the trade or leave some BTC open to ride the trend higher
Final Tips:
Common Mistakes to Avoid
👉 Overleveraging – 10x leverage + 2% risk = 20% account risk!
👉 Ignoring Volatility – Tight stops on Bitcoin often trigger early exits.
👉 Never trade based on emotions. Stick to your plan, adhere strictly to your risk management rules, and let your disciplined strategy work in your favour.

#VRUSDT continues its uptrend📈 LONG BYBIT:VRUSDT.P from $0.011718
🛡 Stop Loss: $0.011470
⏱ 1H Timeframe
⚡ Action Plan:
✅ BYBIT:VRUSDT.P price broke the resistance level and is consolidating above it, confirming a bullish scenario.
✅ The asset is trading above the POC (Point of Control) at $0.00862, indicating buyer dominance.
✅ Increasing volume on the breakout confirms the strength of the upward movement.
🎯 Target TP Levels:
💎 TP 1: $0.012110
📢 A breakout above $0.011718 will confirm the continuation of the uptrend.
📢 POC $0.00862 remains a key support zone.
📢 Rising volume at the breakout suggests a high probability of reaching target levels.
📢 Partial take-profit at TP1 ($0.012110) helps minimize risks in case of a pullback.
🚀 BYBIT:VRUSDT.P continues its uptrend – watch for upward movement and secure profits at TP!

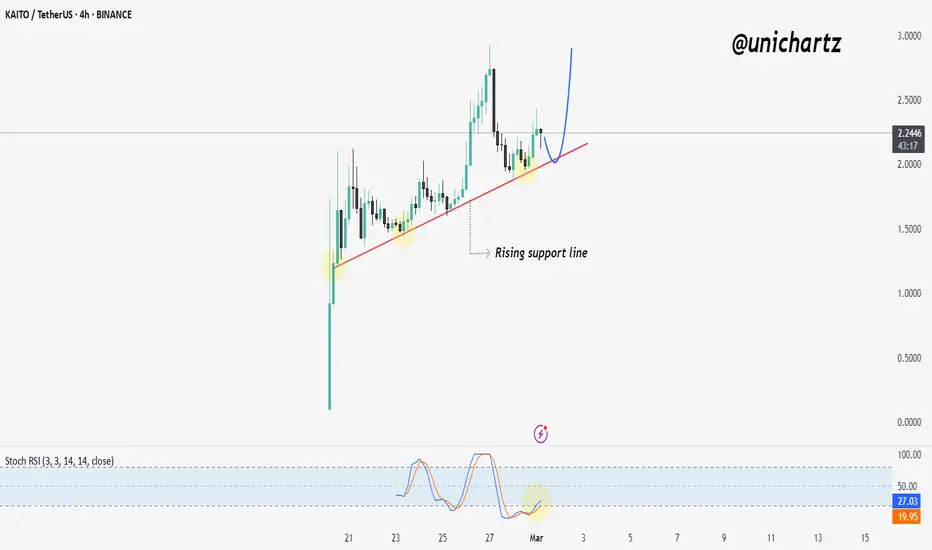
KAITO Holding Rising Support – Is a Big Move Coming?$KAITO/USDT is respecting a rising support line, with price bouncing multiple times from this level. The current retest suggests a potential bullish continuation, especially with the Stochastic RSI in the oversold zone, indicating a possible reversal.
If the trendline holds, we may see a strong upward move, targeting previous highs around $2.50 - $3.00. However, a break below the support could invalidate the bullish outlook.
DYOR, NFA
MGNT 1H Long Investment Conservative Trend TradeConservative Trend Trade
+ long impulse
+ SOS level
+ 1/2 correction
+ volumed 2Sp-
- day will close without test
Calculated affordable stop limit
1/2 1M take profit
Daily Trend
"+ long impulse
+ SOS test / T2 level
+ support level
- strong approach from volume zone
+ biggest volume manipulation"
Monthly Trend
+ long impulse
+ expanding biggest volume T2
+ support level
+ 1/2 correction
+ unvolumed 2Sp-
+ strong buying bars
+ weak selling bar / test
Yearly no context

USD/JPY Setup – Buy the Dip or Wait for Confirmation?The USD/JPY pair is testing a long-term trendline support, which has held multiple times in the past, signaling a critical decision point.
The price has bounced off this level before, suggesting strong buyer interest in this zone. Additionally, the Stochastic RSI is oversold, hinting at a potential reversal.
If the price holds above this trendline and key support zone, we could see a bullish continuation toward new highs.

Bulls and Bears zone for 02-28-2025We had six down days in a row which we have not seen in a while. S&P is probably testing January Lows.
Level to watch: 5888 --- 5886

Move toward the level of 73,000 unitsAccording to the January 21 analysis, after identifying the trading range and determining its highs and lows, we expected Bitcoin to complete this pattern at 92,303.
However, after reaching this level on the daily timeframe, the price made a strong spike, breaking the large trading range between 92,303 and 106,436, entering a new phase and movement.
After its adventure at 86,903, this asset continued its downward movement, breaking through this range as well. Currently, it has reached a new price level at 80,000, driven by the strong spike movement.
Now, we must wait to see whether this direct movement will continue or if it will proceed with some delay and consolidation.
It is important to note that if this level is lost, Bitcoin’s price on the daily timeframe could potentially extend its move down to 73,000, which is also the expected level. The reason is that such a strong spike movement requires a powerful support level for correction or a temporary halt in this dominant wave.

NZD/CAD -H1 Chart - Wedge Breakout (27.02.2025)The NZD/CAD Pair on the H1 timeframe presents a Potential Selling Opportunity due to a recent Formation of a Wedge Breakout Pattern. This suggests a shift in momentum towards the downside in the coming hours.
Possible Short Trade:
Entry: Consider Entering A Short Position around Trendline Of The Pattern.
Target Levels:
1st Support – 0.8101
2nd Support – 0.8068
🎁 Please hit the like button and
🎁 Leave a comment to support for My Post !
Your likes and comments are incredibly motivating and will encourage me to share more analysis with you.
Best Regards, KABHI_TA_TRADING
Thank you.
