#POPCATUSDT Expecting further bullish continuation📈 LONG BYBIT:POPCATUSDT.P from $0.2850
🛡 Stop Loss: $0.2760
⏱ 1H Timeframe
✅ Overview:
➡️ BYBIT:POPCATUSDT.P is showing strong bullish movement, breaking above key resistance at $0.2778, confirming buying interest.
➡️ The $0.2778 - $0.2850 zone now acts as a support, and if the price holds above it, further upside is likely.
➡️ The first major resistance level is at $0.2900, followed by $0.2989 and $0.3100 if the momentum continues.
➡️ Volume remains high, indicating strong liquidity and potential for further growth.
⚡ Plan:
➡️ Enter LONG after confirming a breakout above $0.2850, reinforcing bullish momentum.
➡️ Risk management with Stop-Loss at $0.2760, below key support.
➡️ Key upside targets:
🎯 TP Targets:
💎 TP1: $0.2900 — first take-profit level.
🔥 TP2: $0.2989 — potential resistance.
⚡ TP3: $0.3100 — major upside target.
🚀 BYBIT:POPCATUSDT.P - Expecting further bullish continuation!
━━━━━━━━━━━━━━━━━━━━━━
📢 BYBIT:POPCATUSDT.P is maintaining bullish momentum, and a breakout above $0.2850 could confirm further upside movement.
📢 Watch for price action at $0.2900, as this level might act as short-term resistance.
📢 If the price holds above $0.2989, a strong push towards $0.3100 is possible. However, a drop below $0.2760 would invalidate the bullish setup.
Supportandresistancezones

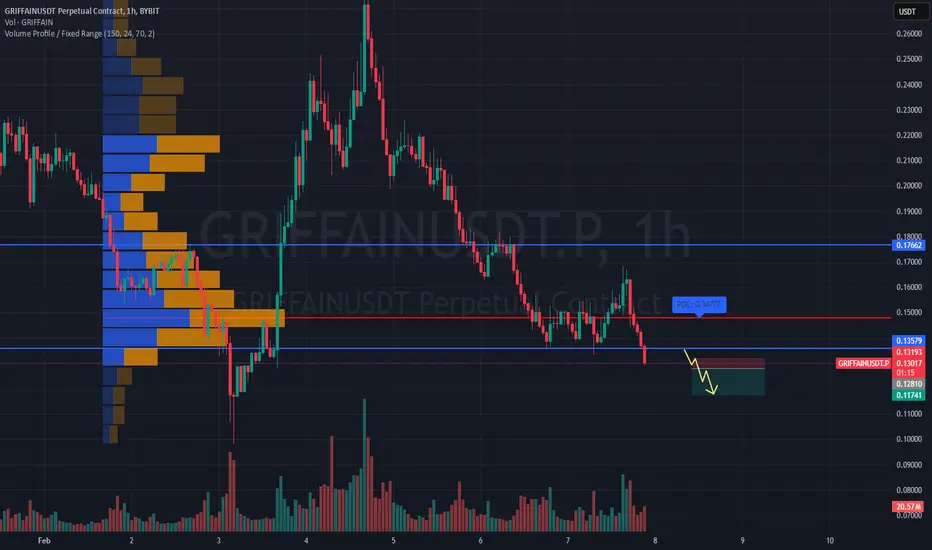
SHORT #GRIFFAINUSDT expecting further downside📉 SHORT BYBIT:GRIFFAINUSDT.P from $0.12810
🛡 Stop loss $0.13193
⏱ Timeframe: 1H
✅ Overview:
➡️ BYBIT:GRIFFAINUSDT.P is showing weakness after reaching a local high, rejecting from a resistance zone.
➡️ POC (Point of Control) at 0.13193 acts as a key volume area with significant trading activity.
➡️ Price action suggests seller dominance, indicating a potential continuation of the downtrend.
➡️ If the 0.12810 support level breaks, expect an increase in bearish momentum.
⚡ Plan:
➡️ Short entry upon confirmation of a breakdown below 0.12810.
➡️ Increased selling volume will confirm the continuation of the bearish trend.
➡️ Holding the position with dynamic monitoring until the first Take Profit level.
🎯 TP Targets:
💎 TP 1: 0.11741 – first target based on the nearest support level.
📢 BYBIT:GRIFFAINUSDT.P is showing bearish signs, but volume and pullback dynamics should be monitored.
📢 A break below 0.12810 could trigger a deeper decline.
📢 If buyers show strength, watch 0.13193 as a possible reversal point.
🚀 BYBIT:GRIFFAINUSDT.P maintains bearish momentum — expecting further downside!
#1000PEPEUSDT expecting further decline!📉 SHORT BYBIT:1000PEPEUSDT.P from $0.009650
🛡 Stop Loss: $0.009875
⏱ 1H Timeframe
📍 Overview :
➡️ BYBIT:1000PEPEUSDT.P remains under selling pressure after failing to sustain an upward move. The price is trading below the key POC $0.010072 , which previously served as a high-liquidity zone.
➡️ The recent breakdown of $0.009815 , followed by a retest as resistance, confirms the bearish scenario.
➡️ If the asset holds below $0.009650 , this could trigger a move toward $0.009242, where buying interest was previously observed.
➡️ Current price action shows weakness in buyers as volume does not support an upward breakout.
⚡ Plan :
➡️ Enter short once a firm breakdown below $0.009650 is confirmed.
➡️ Risk management through Stop-Loss at $0.009875 , positioned above the nearest resistance zone.
➡️ The main downside target is $0.009242 , where profit-taking and a possible bounce could occur.
🎯 TP Targets:
💎 TP 1: $0.009242
📢 BYBIT:1000PEPEUSDT.P is showing signs of further downside, with no strong buying reaction at the moment.
📢 The $0.009242 level should be closely monitored as a potential support zone. If weakness persists, breaking this level could accelerate downward pressure.
📢 For those holding long positions, caution is advised when facing repeated resistance retests.
🚀 BYBIT:1000PEPEUSDT.P continues to show weakness — expecting further decline!

RGTI: both ways potential Chart on the daily looks like being in no-mans is about to decide of its further direction.
I have two main alternatives:
1. If price moves above Jan 24th highs the road is opened to following resistance zone: 20-25, 28-33 and a push towards ideal macro-resistance target at 37-45 levels;
2. If price break down bellow Feb 3rd lows, odds are moving in favour of one potential leg down to potentially test 4-3 macro support levels.
Weekly macro view:
Thank you for your attention!

Bulls and Bears zone for 02-05-2025 All this week markets have been very volatile.
During ETH session traders are testing yesterday's Low.
Level to watch: 6046 ---6044

TOTAL DAILY The flash crash of Monday took TOTAL all the way down under the previous cycles high and tapped the 1D 200 EMA before reacting well to move price between the DAILY RESISTANCE & SUPPORT.
For me I still think crypto has space to grow, seasonality tells us the first quarter of a bullrun year is great in terms of returns with a tail off in Q2-3, coupled with the US administration being pro crypto and the looming strategic reserve getting closer, ETFs relentlessly buying Bitcoin, same with MicroStrategy.
The two entry options for me are when the wick gets filled and a reclaims the '21 ATH once again, that would sweep the demand zone and take out a lot of stop losses before targeting the DAILY RESISTANCE and the HIGHS.
Another entry would have to be a reclaim of the DAILY RESISTANCE, I would be worried that the wick still needs filling but maybe it would be during the bear market. For that reason a close SL would be useful.

GBPAUD new bearish expecting here
OANDA:GBPAUD strong bearish in last periods, currently price in zone, its bounce 4-5 times on SUP zone, looks like DIAMOND pattern here is created, based on past for me still here having enough bearish volumen gathered for one more push.
SUP zone:1.97800
RES zone: 1.95000, 1.94500, 1.93900

NAS100USD: Bearish Continuation Likely After Gap FillGreetings Traders,
In today’s analysis on NAS100USD, we observe that the market remains bearish overall, and our focus is on taking advantage of selling opportunities in line with this prevailing trend.
Market Context:
Gap Fill Complete:
The week began with a significant downside gap, creating a price inefficiency. The market has since retraced upward to fill this gap, signaling a potential continuation of the bearish trend.
Premium Price Zone:
Price is currently in a premium range, where smart money institutions are likely to initiate sell positions. We’ve taken out premium liquidity resting above an engineered resistance zone—a classic setup where smart money manipulates retail traders into entering positions, only to reverse the market and pair sell orders against their stop losses and pending orders.
Bearish Order Block:
Price is currently reacting at a bearish order block, a key institutional resistance zone. This provides a strong area to seek confirmation entries for short positions.
Trading Plan:
Entry Strategy : Look for confirmation within the bearish order block for short opportunities.
Targets: Focus on discount liquidity pools at the lows, where institutions are likely to scale out and book profits.
For a detailed explanation of my strategy, check out the first video of my 2025 ICT Mentorship lectures linked below:
Foundations of Mastery: 2025 Mentorship Begins!
Kind Regards,
The Architect

XAUUSD GOLD ⇒ Sellers interested in retesting gold.Hello, Traders!
As we all know, this week gold made ATH with a red candle and also did a retest to 2799, but this retest is not enough for the continuation of the bullish trend. Here I have presented my analysis regarding gold.
Currently, gold is trading at 2799 at the gold support level, as the new week begins in three hours, so gold can do a gap down opening with a strong volume candle, and we can see 2774 in gold because gold is in a strong bullish trend, so it should touch 2774, which is the golden zone of fib to continue its bullish trend.
Support Level: 2758 – 2767
Resistance Level: 2815 – 2819
Fib Golden Zone: 2773 – 2763.
Liquidity Zone: 2730 (strong low)
Because gold is trading in an ascending channel, our aim would be the ascending trendline, but our entry point should be the golden zone of fib.
Do not enter at ATH because it is the initial technical analysis, thus our buy entry is quite dangerous, so we will wait for a retest.
For now, we can take sell trades for scalping, but always utilize SL because SL is better than liquidation, thus I'm in for sell until 2763.
If you enjoy my analysis Please support my concept and follow me for more analysis.
Have a wonderful day, thank you!

Can Gold keep pushing up? 1H AnalysisWith new Tariffs in place, USD not doing all that great.. Gold has continued to be a "save" investment for many. explained on the chart, just have to wait for price action to make a move.
Important trading week.

GOLD → Sellers taking interest for retesting in goldHello Traders!
As we all know that last week gold has made ATH with red candle and also did a retest to 2799 but this retest is not enough for continuation of bullish trend here i have shared my analysis about gold
Currently gold is trading on 2799 at gold support level as next week is going to start in 3 hours so gold can do a gap down opening with strong volume candle and we can see 2774 in gold because gold is in strong bullish trend so it should touch 2774 which is golden zone of fib to continue its bullish trend.
Support Level: 2758-2767
Resistance Level: 2815-2819
Fib Golden Zone: 2773-2763
Liquidity Zone: 2730 (also strong low)
As gold is trading in a ascending channel so our target would be the trendline of ascending trendline but our entry should be at golden zone of fib.
Do not take entry at ATH that is the first of technical analysis so here our entry for buy would be very risky so we will wait for retest.
For Now we can take sell trade for scalping but always use SL because SL is better than liquidation so i am in for sell till 2763
If you like my analysis kindly boost my idea and follow me for more analysis
Analysis By: PIPsOptimizer
Have a nice day thank you!

Correction up to the target level.Following the previous analysis on January 24,
the price of Bitcoin has reached the bottom of the trading range channel.

GBPUSD Week 6 Swing Zone/LevelGreat trading last week.
Week 6 levels are set in.
Note:
Sl - Stoploss
dtp - dynamic takeprofit, means trade is closed if price bounces from level or left running if price breaks past level.

Platinum towards Key Resistance. Watch Closely for Confirmation OANDA:XPTUSD is approaching a significant resistance zone, an area where sellers have previously stepped in to drive prices lower. This area is a great zone to watch for potential rejection.
If price struggles to break above and we see bearish confirmation, I anticipate a pullback toward the $1,010 level at least. In this recording I will be explaining in more detail why I think this is a possibility and what to look for.
This is not financial advice but rather how I approach support/resistance zones. Remember, always wait for confirmation before jumping in.

15min - 1 hour short term Day trade Idea for MES15min - 1hr trading idea for short term gain. Thoughts.
After reviewing and studying the chart I found myself pondering on a short term gain for the upcoming trading session. Thoughts and critique welcome.
The use of FVG that has not been mitigated is in play
Oversold on an RSI
Momentum on slowing down on a bear trend
As always. Not offering financial advice. Just food for thought.

META: trend structure is approaching important resistance zoneMeta is approaching important resistance zone both in terms of macro (from 2022 lows) and mid-term (since Apr 2024 lows): 700-760 level.
Until price is bellow 760 level, my operative scenario is to prepare for at least mid-term topping action with following unfold of larger correction. Macro support levels for this potential correction are at 520-420.
From the long-term investing perspective it looks reasonable to consider hedging long-term holdings. From swing-trading perspective this resistance levels might present good risk-reward opportunity in coming weeks.
From macro-perspective, levels of 520-420 are important zone to watch for future supporting action if mid-term correction materializes.
Until price is holding above 420, macro uptrend since 2022 lows looks intact and assumes higher levels (at 1000-1300 macro resistance) in years to come.
As an alternative mid-term scenario, I might also consider price trying to reach higher resistance levels, around 800-810, before starting larger degree correction towards macro support zone.
If price moves beyond 810 level and will be able to sustain further advance afterwards, or in macro-perspective: fall below 420 level, suggested mid-term and macro structures needs to be revised.
Thank you for your attention and wishing the best to your investing and trading in 2025!

BTCUSD price is getting ready to drop to 100,000 to 97,000BTCUSDT is encountering significant opposition. In order to create a defense conglomerate, the price is being forced as far away from the 105–107K range as feasible. However, the worldwide bullish position cannot yet be overshadowed by this resistance.
On H1-H4, a symmetrical triangle and a descending channel are developing into a contentious scenario. Additionally, everything is dependent on which market segment views which figure. Although a rebound may accompany the initial reaction to the triangle support, given the resistance, we can presume that the price will attempt to decline and that the triangle's rebound will not be significant.
The price is prevented from falling by the support at 101.600 if we examine the descending channel.
Yes, technically, 101.600's support is now what matters most. Whether or not this level will hold the price is the key question.
At its core, the issue is controversial because it primarily hinges on America and how Trump and other politicians would employ rhetoric around cryptocurrency. It might be empty rhetoric, a bubble, or a sham to win an election. Or it might be a real tactic.
Resistance levels: 103453, 105765
Support levels: 100150, 98890
Focus on 101.6. I anticipate a short-term price consolidation and fall below the level, followed by a decline to 100–97K BUT! A false breakdown of 101.6 could result in a brief upward bounce before a further down to 100K because the chart shows a symmetrical triangle.
Analysis By: NexusTradesZone

Further FIb levels for nifty after budgetResistance sell opportunity 1st level 23673
Resistance sell opportunity 2nd level 24025
Support Buy on dip level 23124
📢 Disclaimer:
This post is for educational purposes only. Investments in the stock market are subject to market risks. Please consult a financial advisor before making any trading decisions.

BTC to new high...It seems that BTC to be at the beginning of wave c:B. price is supported in green zone that it includes fibonacci 1.618 of wave W and fibonacci 0.5 of wave a:B and fibonacci 1.272 wave X. I expect that price to rise to red zone that it includes fibonacci 1.38 and fibonacci 1.23 of wave A and fibonacci 1 of wave a:B.
after that price completes the extended flat pattern in red zone, I expect the price to decline below the end of wave A and probably below 80,000.

GOLD/XAUUSD Aiming for New Highs? While the US and BRICS (Brazil, Russia, India, China, and South Africa) aren’t in a formal trade war, tensions are rising. BRICS nations are working to reduce reliance on the US dollar, challenging its dominance in global trade. This “de-dollarization” effort and geopolitical shifts, like sanctions on Russia and US-China disputes, are fueling uncertainty. The USD surged by over 7.1% and was the only currency to see a positive growth in 2024.
What This Means for Gold?
Gold thrives during uncertainty. As BRICS push for alternatives to the dollar and tensions with the US escalate, demand for gold could rise:
Hedge Against Currency Risks: If BRICS reduce dollar usage, the dollar might weaken, boosting gold’s appeal.
Geopolitical Tensions: Gold is a safe-haven asset investors flock to during economic instability.
Global economic shifts are driving gold’s narrative. Trade wisely!
Apex out!

OKLO: mid-term topping potential in nuclear space The swing long set-up from Dec pullback is about to fully realize its potential
From my Dec chart archive:
pbs.twimg.com
And Jan update:
pbs.twimg.com
when I wrote: "It wouldn't not surprise me to see price pulling back bellow Oct's highs slightly and finding support on rising 8/21 emas before continuing its advance. Until price is above 21 ema, next important macro-resistance zone: 33-40"
As for now my operative scenario that price is preparing either to finish its upside momentum extending towards: 46-50 resistance zone or already have finished it and in the process of bouncing before a larger corrective way starts unfolding in the coming weeks.
If we have the mid-term top already in place, then 20-12 macro support zone might be a good place for the larger bottom to start forming before the new larger upside trend beginnes.
The same kind of pattern (bounce and new larger corrective way down) I expect to manifest itself in the coming weeks in other leading energy names (NNE, CLS, VST, GEV)
If price moves above the resistance zone mentioned, the proposed scenario needs to be re-assessed.
Thank you for your attention and wishing you the best trading and investing results in 2025!

NZDSGD - In a Clear Support Zone - Buying Opportunity Ahead?OANDA:NZDSGD is inside a key support zone that has previously acted as a strong demand level, leading to bullish momentum. The recent decline into this area suggests a potential opportunity for buyers to step in.
A bullish confirmation, such as a strong rejection pattern, bullish engulfing candle, or long lower wick, would increase the likelihood of an upward move. If buyers regain control, the price may head toward the 0.76630 level. This setup indicates a potential short-term rebound within the broader market structure
This is not financial advice but rather how I approach support/resistance zones. Remember, always wait for confirmation, like a rejection candle or volume spike before jumping in.
Please boost this post, every like and comment drives me to bring you more ideas! I’d love to hear your perspective in the comments.
Best of luck , TrendDiva

EURUSDHey Traders, what you think of this trade?
Price has broken the bearish channel.
Price retraced to yesterday low demand zone and bouncing to this week high to test or break.
Thank you
