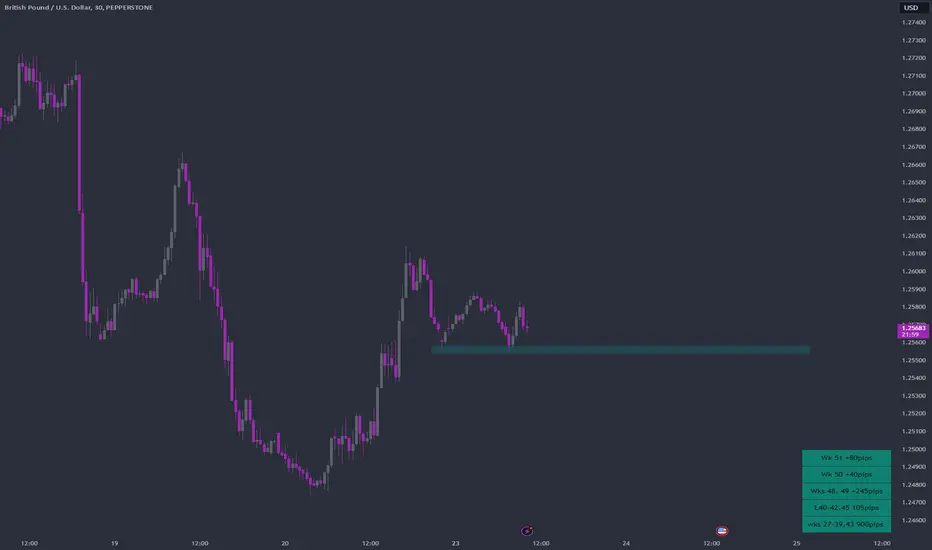
GBPUSD End of Year Swing ZonesLast trading week of the year.
SZ is calculated and set. Price already bouncing upward from SZ.
Entry @586
SL -10pips.
Supportandresistancezones
$SPY Trade Analysis DarkPoolsThis chart appears to be analyzing the SPY ETF (S&P 500 ETF Trust) on a 30-minute timeframe, with various levels marked for support, resistance, trendlines, and potential targets. Here’s a breakdown of the analysis based on what is visible in the chart:
Trend Analysis:
Downtrend Observed:
The red trendline indicates a clear lower highs (LH) pattern, suggesting a bearish structure.
The green trendline highlights a previous descending support line, which was broken, followed by a recovery.
Current Context:
SPY is below the red trendline, which is acting as resistance.
The price is hovering near the EMA cluster (moving averages such as 8 EMA and 21 EMA), indicating indecision or consolidation.
Key Levels:
Resistance Zones:
595.23 to 599.31: This range aligns with previous pivot points and overlaps with a lower high (LH), making it a significant resistance area.
604.37 (DP): A dark pool level from 12/18 indicates where institutional activity occurred. Breaking this level could signal bullish momentum.
Support Zones:
590.96 to 586.50: Price currently sits above this cluster, suggesting short-term support.
578.93 (90 SMA): The 90 SMA acts as a longer-term support level.
Potential Trade Ideas:
Bullish Scenario:
Entry: Above 595.23, ideally with a strong close above the red trendline.
Targets:
T1: 597.63
T2: 599.31
T3: 604.37
Stop Loss: Below 593.87, the most recent support level.
Bearish Scenario:
Entry: Below 586.50, confirming a breakdown below immediate support.
Targets:
T1: 585.00
T2: 580.00
T3: 578.93
Stop Loss: Above 588.00, invalidating the breakdown.
Indicators:
EMA Strategy: Watch for a cross of the shorter EMA (e.g., 8 EMA) below the longer EMA (e.g., 21 EMA) for bearish confirmation, or vice versa for bullish momentum.
Volume Confirmation: Increased volume at breakout levels strengthens the validity of the move.
Overall Outlook:
The current price action is consolidating between 595.23 (resistance) and 586.50 (support). This range-bound behavior may continue until a clear breakout or breakdown occurs.
A move above the red trend-line could suggest a bullish reversal, while a break below the lower support zone would confirm bearish continuation.
Why the 6:15 Candle is Key:
Liquidity Shift:
Around 6:15 a.m. EST, pre-market trading often experiences a shift in liquidity as larger institutional traders and automated systems begin positioning themselves ahead of the regular market open. This creates a noticeable increase in volume or volatility.
Reaction to Overnight News:
By this time, many traders have processed overnight news, including international market developments, economic data, or corporate announcements. The 6:15 candle often represents the market’s collective sentiment to these inputs.
Early Dark Pool & Futures Activity:
Institutional players and hedge funds might act on dark pool or futures activity signals around this time. For instance, the SPY chart you provided shows interest in identifying areas that coincide with pre-market setups for further price movement.
Key Levels for the Day:
The high and low of the 6:15 candle in pre-market trading are frequently used by day traders as pivot points. These levels often act as intraday support or resistance, with price reacting around these zones during the regular trading session.
Interpreting the 6:15 Candle in Your Chart:
Looking at your chart:
The 6:15 candle seems to be sitting just below key resistance at 591.14.
This candle’s high and low can serve as short-term levels:
High Break: A break above the 6:15 high signals bullish momentum.
Low Break: A move below the 6:15 low indicates bearish pressure.
For SPY, this candle is important because it often sets the tone for the first trading hour of the day.
How to Use the 6:15 Candle:
Range Breakout Strategy:
Mark the high and low of the 6:15 candle.
Use these as breakout or breakdown levels for the regular session.
Pre-Market High/Low Alignment:
If the 6:15 candle aligns with pre-market highs or lows, it reinforces the importance of those levels.
Volume Confirmation:
Check if the 6:15 candle has significant volume compared to previous candles. A spike in volume confirms institutional interest.
EMA Relationship:
Notice if the 6:15 candle is above or below key moving averages like the 8 EMA or 15 EMA. This gives insight into short-term sentiment.
In Summary:
The 6:15 pre-market candle acts as a pivotal reference point:
High and low levels often dictate intraday trading strategies.
It reflects liquidity shifts, news reactions, and institutional activity.
Use it alongside volume, EMAs, and resistance/support zones for more accurate predictions.

$TSLA Trade Analysis DarkPoolsOverview of Chart
The updated chart for TSLA shows additional volume information, key pivot levels (R1, R2, R3, P, and S1), and dark pool prints, which provide a clearer picture of institutional activity and support/resistance zones. The chart continues to reflect the stock's bullish trend but highlights a potential consolidation phase around critical resistance.
Key Observations
Trend Continuation with Consolidation:
TSLA remains in an uptrend, with the price still above the 8 EMA (white line), which acts as a short-term dynamic support.
However, the current candles indicate consolidation near the R2 pivot level ($443.60), where selling pressure is evident.
Dark Pool Prints and Institutional Activity:
The dark pool print at $436.17 (1.6M shares) remains a critical support level. This suggests institutional interest in this price area, likely acting as a floor for further pullbacks.
Holding above this level confirms bullish sentiment. A failure to hold this level could accelerate a bearish pullback toward lower pivot levels.
Volume Analysis:
The chart now shows elevated volume on recent red candles, which suggests increased selling pressure near resistance levels.
Notably, the volume spike is not overwhelmingly bearish, indicating potential profit-taking rather than a complete reversal of the trend.
Pivot Levels and Support/Resistance Zones:
Immediate Resistance: The R2 pivot ($443.60) is acting as a ceiling for TSLA's recent upward momentum. Breaking this level could result in a move toward R3 ($514.82).
Immediate Support: The dark pool level ($436.17) and the 8 EMA align as immediate support levels. Below this, the R1 pivot ($391.77) and 21 EMA ($393.86) represent the next significant supports.
Bearish Divergence Risk:
While the overall trend is bullish, the consolidation near R2 and elevated selling volume suggest a potential pullback if support levels fail to hold.
Trade Plan
Bullish Scenario:
Entry: A confirmed breakout above the R2 pivot ($443.60) with increasing volume. Ideally, a daily close above this level will confirm the breakout.
Targets:
First Target (T1): $456 (recent swing high).
Second Target (T2): $514.82 (R3 pivot).
Stop Loss: Below the dark pool level ($436.17).
Bearish Scenario:
Entry: If TSLA closes below $436.17 and the 8 EMA, indicating a loss of short-term bullish momentum.
Targets:
First Target (T1): $413 (pivot support).
Second Target (T2): $393.86 (21 EMA).
Stop Loss: Above the R2 pivot ($443.60).
Additional Considerations
Risk Management:
TSLA is volatile, and trades should consider position sizing and stop-loss placement to manage risk effectively.
Monitor the overall market sentiment (e.g., SPY, QQQ) for confirmation of broader trends.
Institutional Influence:
Keep an eye on how the price reacts to the dark pool print at $436.17. Institutional support or rejection here will guide the next move.
Broader Market Factors:
Tesla's price can be influenced by sector-wide news (e.g., EV market trends) and macroeconomic factors (e.g., interest rates or broader tech sentiment).

SMLT 1H Swing Long Aggressive CounterTrend TradeAggressive CounterTrend Trade
- short impulse
- unvolumed T1
+ support level
+ volumed 2Sp+
+ weak test
+ biggest volume first buying bar close entry
Calculated affordable stop limit
1 to 2 R/R take profit
Daily CounterTrend
"- short impulse
+ volumed T1
+ support level
+ volumed manipulation"
Monthly Trend
"+ long impulse
+ T2 level
+ support level
+ biggest volume manipulation"
Yearly trend
"+ T1 level
+ support level
+ biggest volume manipulation?"

Intraday Levels for Nasdaq 100 Futures - 12/20/2024This analysis focuses on the Nasdaq 100 Futures, aiming to identify potential support and resistance levels where the price could experience intraday bounces or trend reversals, as well as zones where the price might potentially break higher or move lower.
Considerations
The range used in this analysis serves only as a reference for broader-level insights.
For intraday operations, it is advisable to utilize a lower timeframe to refine entry and exit points more accurately.
To confirm the validity of these levels, it is essential to evaluate real-time conditions as the price approaches these zones. Factors such as pressure, trading volume, and Order Flow will play a critical role in determining whether these supports hold or are likely to be broken.

NVIDIA to ATH $153 until end of 2024 (16% ROI)With NASDAQ:NVDA , we are currently in a promising position to see a final exaggeration into the end of the year. The stock has risen over 180% percent in 2024 and I think we have a good chance to make 200% out of that. Looking at the chart we can see a clear uptrend trendline starting in August this year with multiple touchpoints along the line. Since October we're consolidating within the range from $131 to $153. After touching the trendline on thursday last week we're good to go higher (at least for now). Resistance will be the current ATH at $153. If we fail to hold the level at $131 on the daily chart the trade will be invalidated. That leaves us with 16.54% ROI in total.
Target Zone
$153.00
Support Zone
$131.00

UNH Selloff Unreasonable - Still 15% ROI Short-TermSince my first NYSE:UNH idea a couple of days ago the price of this stock dropped significantly. If you've been part of the first idea you should've been able to lock in around 1.x% of return when using a tight stop-loss. Otherwise you've been stopped out with break-even. Nevertheless, the sell-off was not helpful and is completely exaggerating the situation at UNH since the company is not really effected by the current PBM debate.
"Deutsche Bank sees a potential divestiture as not having a significant impact on earnings, estimating the risk at likely less than $200M of the company’s roughly $30B+ operating earnings. Deutsche Bank noted, however, that CVS (CVS), Cigna (CI) and UnitedHealth (NYSE:UNH) 'could face additional risk from losing the ability to vertically integrate the PBM, fulfillment and manufacturing functions of biosimilars through organizations like Cordavis and Quallent.' Despite concerns about the potential breakup of their pharmacy businesses, Deutsche Bank maintained it's buy rating on UnitedHealth (UNH)."
From a technical standpoint we can see a confluence of support:
Weekly SMA200
Strong Trendline from March 2020
Horizontal Support at $480
UNH managed to bounce from the trendline intraday today. This could mean we're going to see a turnaround from here. If we break below the trendline on the daily chart this trade will be invalidated. Otherwise our target sits at $550.

GBP/CAD - H4 - Strong BreakoutThe GBP/CAD pair on the H4 timeframe presents a potential selling opportunity due to a recent downward breakout from a well-defined Channel pattern. This suggests a shift in momentum towards the downside in the coming Hours.
Key Points:
Sell Entry: Consider entering a short position around close to the breakout level. This offers an entry point near the perceived shift in momentum.
Target Levels:
1st Support – 1.7761
2nd Support – 1.7570
Your likes and comments are incredibly motivating and will encourage me to share more analysis with you.
Best Regards, KABHI FOREX TRADING
Thank you.

Intraday Levels for Nasdaq 100 Futures - 12/19/2024This analysis focuses on the Nasdaq 100 Futures, aiming to identify potential support and resistance levels where the price could experience intraday bounces or trend reversals, as well as zones where the price might potentially break higher or move lower.
Considerations
The range used in this analysis serves only as a reference for broader-level insights.
For intraday operations, it is advisable to utilize a lower timeframe to refine entry and exit points more accurately.
To confirm the validity of these levels, it is essential to evaluate real-time conditions as the price approaches these zones. Factors such as pressure, trading volume, and Order Flow will play a critical role in determining whether these supports hold or are likely to be broken.

Bulls and Bears zone for 12-19-2024Yesterday's sell off gave back all of November's gain in one day. Could traders still put together a Christmas rally ?
Level to watch: 5985 --- 5983

These are my Support and Resistance drawings for UXLINKUSDTThese are my Support and Resistance drawings for UXLINKUSDT

[GEX] levels for QQQFirst, let’s examine what we see on our chart using options indicators:
Summarizing the GEX levels through December 26, we have a strong call wall at around 540. If price can break above and hold that level, it could easily pave the way toward 550. However, if we’re expecting a Christmas selloff after Friday’s close, this bearish assumption might prove worthwhile.
This brings up a point that often comes up:
“How do I interpret whether the optoins indicator is bullish or bearish?”
There’s no such definitive signal! The levels and options metrics show certain conditions, but no one can tell you exactly what will happen next. This is where you need to have a directional hypothesis. Once you have it, the indicators can help you fine-tune your positioning, identify realistic targets, and select viable legs—but they won’t decide your directional stance for you.
For example, while everything may look bullish, let’s say you have a contrarian bearish view. Then you can see where it makes sense to position yourself.
Test Case Chosen:
8x QQQ Dec 24th – Dec 26th 525 Calendar Put Spread
Max Loss: $216
Max Profit: $1,685
PoP: 45%
Why not?

LLY 1H Swing Long Aggressive Trend TradeAggressive Trend Trade
- short impulse
+ volumed TE / T1
+ support level
+ biggest volume Sp
+ weak test
+ first bullish bar close entry
Calculated affordable stop limit
1 to 2 R/R take profit
Daily Context
"+ long impulse
+ 1/2 correction
- expanding T2
+ support level
+ volumed manipulation"
Monthly Context
"+ long impulse
+ 1/2 correction
+ T2 level
+ support level
- biggest volume manipulation"
Yearly Context
"+ long impulse
- neutral zone"

EURNZD new bearis hexpectations
EURNZD we are have bearish trend in last periods, with many rejections, in my opinion we are not see to much here, currently price is make bounce on zone 1.79300 and from here expecting continuation.
SUP zone: 1.79500
RES zone: 1.77000, 1.76400

USDJPY new bullish for expect
FX:USDJPY trend based analysis, we having in period from 1.12 - 9.12 ROUNDED BOTTOM pattern visible, price is make break of same and confirmation of same (yellow line) and its make short bullish push, currently price in consolidation, its on strong ex. zone 151.800 (violet line).
What here expecting after todays and past events in this week, still looks like we will have strong USD and here exepcting to see new bullish push.
SUP zone:151.450
RES zone:154.550, 155.050

AFKS Swing 1H Long Conservative CounterTrend TradeConservative CounterTrend Trade
+ long balance
+ 1/2 correction
+ volumed ICE level
+ support level
+ biggest volume 2Sp-
+ weak test
- above first bullish bar close entry
Calculated affordable stop limit
1 to 2 R/R take profit
Daily Context
"- short impulse
+ volumed TE / T1 level
+ volumed manipulation
+ support level"
Monthly Context
"- short impulse
+ biggest volume T1 level
- below 1/2 correction
+ support level
- one bar reversal?!"
Yearly Context
"- short impulse
- neutral zone"

EUR/CHF Breaks Above Downtrend Line: What’s Next?The daily chart for the EUR/CHF pair has recently revealed a bullish movement, successfully breaking above its descending trend line. This development indicates a potential shift in market sentiment, occurring after the price touched a significant support level at 0.9250. The fact that the price has breached the downtrend line after reaching this support suggests a potential influx of buying pressure in the short term. Currently, the pair is trading near the horizontal resistance zone at 0.9400, which has been tested multiple times in the past.
Possible Scenarios
Buy Scenario:
With the price having broken above the downtrend line, sustained trading above 0.9400 could signal a bullish move in the coming days.
A stop loss could be placed around 0.9310 (approximately 90 pips below the current price).
For a more conservative approach, a stop loss could be set below 0.9240 (about 160 pips).
Take Profit Opportunities:
TP1 at 0.9490, near the recent high (about 90 pips).
TP2 at 0.9590, targeting the next resistance area (approximately 190 pips).
Alternative Scenario:
If the price fails to maintain itself above 0.9400 and retreats below the trend line, this could indicate a potential continuation of the downtrend. In such a case, a short entry could be evaluated around 0.9350:
Stop Loss: Above the high of the previous candle, at around 0.9420 (approximately 70 pips).
TP1: At 0.9250, which serves as significant support and a recent low (around 100 pips).
Important Technical Factors to Note:
Trend Line: The break of the descending trend line suggests a reduction in selling pressure.
Resistance Zone: The area between 0.9400 and 0.9450 will be a critical test for buying strength.
Strong Support: The 0.9257 level remains a crucial point that buyers have defended in prior downtrends.
Fundamental Considerations
Euro (EUR): The euro's strength is influenced by Eurozone economic data and the European Central Bank (ECB) decisions. The recent release of the Consumer Price Index (CPI), showing inflation at 2.2%, is close to the ECB’s target. This indicates that the ECB may adopt a dovish monetary policy in the short to medium term, which could negatively impact the euro's strength.
EUR/CHF is at a pivotal technical crossroads. The break of the descending trend line supports a bullish outlook in the short term, with initial targets set at 0.9490 and 0.9590. However, a failure to overcome the current resistance could see sellers regain control, with possible targets around 0.9300 and 0.9257. Traders should closely monitor price reactions to these critical levels before entering positions.
Disclaimer
74% of retail investor accounts lose money when trading CFDs with this provider. Consider whether you understand how CFDs work and if you can afford the high risk of losing your money. Past performance is not indicative of future results. Investment values may fluctuate, and you may not recover your initial investment. This content is not intended for residents of the UK.

Intraday Levels for Nasdaq 100 Futures - 12/18/2024This analysis focuses on the Nasdaq 100 Futures, aiming to identify potential support and resistance levels where the price could experience intraday bounces or trend reversals, as well as zones where the price might potentially break higher or move lower.
Considerations
The range used in this analysis serves only as a reference for broader-level insights.
For intraday operations, it is advisable to utilize a lower timeframe to refine entry and exit points more accurately.
To confirm the validity of these levels, it is essential to evaluate real-time conditions as the price approaches these zones. Factors such as pressure, trading volume, and Order Flow will play a critical role in determining whether these supports hold or are likely to be broken.

Exxon is oversold (the most since 2020)NYSE:XOM is inside it's sideways channel since March 2024 and trades within a price range of $108 - $123 with one failed breakout to the upper side in October.
The recent pulldown came from commodity prices (oil) and political drama about how much oil will be offered in Trump's term. Of course, it would be best if supply will not outpace demand too much since this would let oil prices drop. Trump will learn this soon enough. Because of that it's mostly noise what we have seen in this chart.
The level at $108 offered strong support twice and the sector (XLE) is also offering support itself. Also, the last time we've seen this stock so oversold was during the Covid crash in 2020.
From a fundamental perspective, Exxon Mobil's recent performance highlights its strong investment potential. The company's total shareholder yield, combining dividends and buybacks, now exceeds 7%, offering substantial returns to investors. In Q3 2024, Exxon reported $8.6 billion in net profit, with a 25% production increase, partly due to the acquisition of Pioneer Natural Resources. Despite a 5% earnings decline from lower commodity prices, Exxon's diversified operations and strategic investments in alternative energy position it well for long-term growth. The recent stock price dip presents an attractive entry point for investors seeking robust returns in the energy sector.
Target Zones
$114.00
$123.00
Support Zones
$108.00

Jindalworldwide: Support & resistance : will it break this time?
stock trading within a tight range
stock is good example to learn support and resistance

xauusd sell tradexauusd reacting good to the 1hr supply
and also has a break and retest setup to the downside.
let see how it goes.

USDCHF bullish continuation expecting
OANDA:USDCHF we are have H&S 4H pattern structure, which at end its not be completed, its start good, in moment confirmation we are have, but from 10.12 we are can see revers and bullish push, currently after todays events here expecting to see still bullishnes.
SUP zone: 0.88400
RES zone: 0.89600, 0,89850

GBPJPY bullish expectations for next periods
OANDA:GBPJPY price on zone bouncing, here having expectations to see stronger, higher bullish push in this week
SUP zone: 190.000
RES zone: 195.900, 197.200
