Gold is coiling for a breakout... All eyes on the next move!📉 Gold is currently moving within a minor descending channel.
In yesterday’s analysis, I pointed out the potential for a drop. Now, after a period of range-bound movement, I expect a breakout from this channel and a return to the main trend.
🎯 The first target on a reversal would be the top of the minor channel.
Keep a close eye on price action here — this zone could be key for the next move
OANDA:XAUUSD
Supportandresistancezones

Gold Short Term OutlookYesterday’s chart analysis played out well.
Price broke above the MA50 and tested the $3,346 resistance zone. However, this zone failed to hold, and gold dropped aggressively toward the $3,306 support.
Once again, price is trending below both the 50 and 200 moving averages, indicating continued bearish pressure.
For now, the $3,306 support is holding. Bulls need to break above $3,330-$3,346 for higher levels to open up.
🔑 Key Levels:
Resistance:
$3,346 • $3,361 • $3,375
Support:
$3,306 • $3,287 • $3,271 • $3,242

EURUSD - Potential buying opportunityLooking at EURUSD
We are still very bullish with no sign of it slowing.
I am aware of a potential weekly liquidity point to the left, however, until EURUSD shows its hand it's important that we still remain bullish.
We have set up a lovely liquidity point before a lovely demand area.
So I will be setting a pending order at the demand area after the New York close and the Asian session begins.

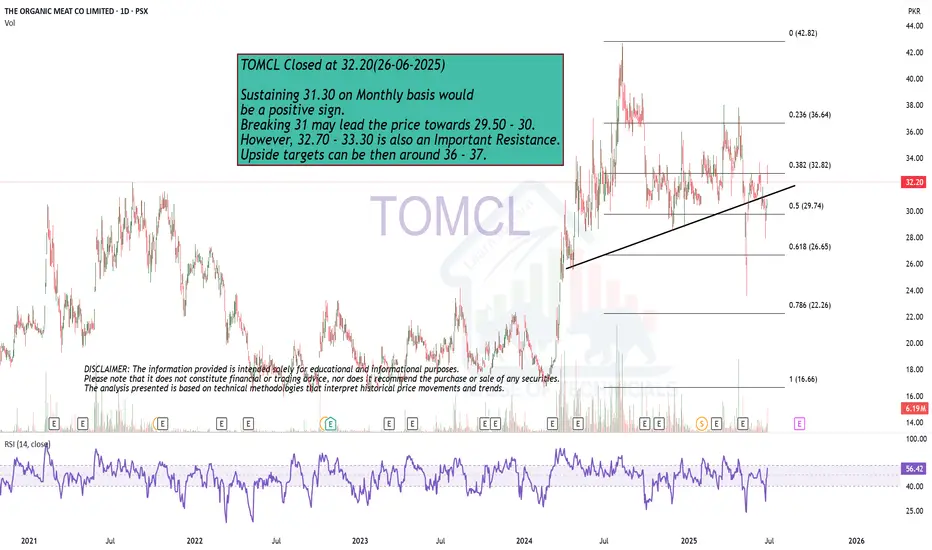
Play on Levels.26-06-2025
Sustaining 31.30 on Monthly basis would
be a positive sign.
Breaking 31 may lead the price towards 29.50 - 30.
However, 32.70 - 33.30 is also an Important Resistance.
Upside targets can be then around 36 - 37.
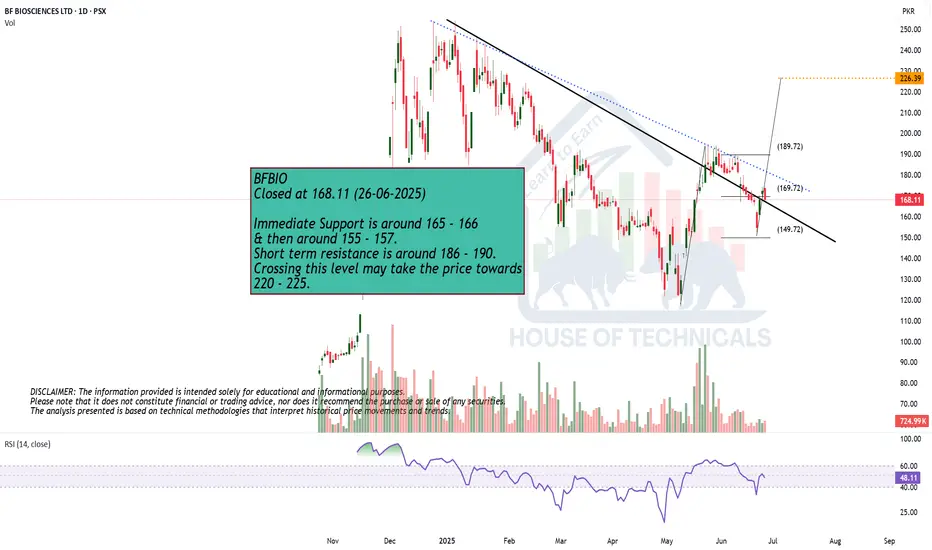
Play on LevelsBFBIO
Closed at 168.11 (26-06-2025)
Immediate Support is around 165 - 166
& then around 155 - 157.
Short term resistance is around 186 - 190.
Crossing this level may take the price towards
220 - 225.
USDCAD bearish continuation expected
OANDA:USDCAD still bearish expected after today's events. Price bouncing and on some good, strong zones.
SUP zone: 1.37300
RES zone: 1.36000, 1.35600

ETHUSD📊 ETH/USD 4H Trade Setup For Long
🔍 Watching an Inverse Head & Shoulders 🫱🫳👤
🔼 Entry: At Fib levels or marked zone
🛡️ Stop Loss: Below support / right shoulder
⏳ Time to Move: ~4 to 5 days from Support ➡️ Resistance
🚪 Tried to break major resistance 4 times
🌍 Geopolitical tensions 🌐 caused pullback
⚡ Now, resistance is weakening —
💥 Breakout likely
🎯 High Risk:Reward setup
📈 Get ready for the move!

Gold Short Term OutlookGold dipped into the Support Zone but failed to sustain the breakdown below it. After briefly breaking below the zone, price has rebounded and is now attempting a short-term recovery.
However, structure remains bearish, with price trading below both the 50MA and 200MA, signalling continued downside pressure unless momentum shifts.
For bullish momentum to continue, we need to see a clean break and hold above $3,330, which may open the path toward $3,346, then $3,361.
If the move up doesn’t hold, the next reaction is expected near key support.
🔑 Key Levels:
Resistance:
$3,330 • $3,346 • $3,361 • $3,375
Support:
$3,306 • $3,287 • $3,271 • $3,242
📌 Stay patient and wait for confirmation before committing to a direction.

F 5M Long Daytrade Aggressive CounterTrend TradeAggressive CounterTrend Trade
- long impulse
- unvolumed T1
+ resistance level
+ biggest volume 2Sp-
+ weak test
+ first bullish bar below close entry
Calculated affordable stop market
T2 5M take profit
1H CounterTrend
"- long impulse
- unvolumed T1
+ resistance level"
1D CounterTrend
"- long impulse
- unvolumed T1
+ resistance level"
1M CounterTrend
"+ short impulse
- exhaustion volume
+ T2 level
+ resistance level
- unvolumed interaction bar
- reaction bar looks to close bullish in 6 days"
1Y CounterTrend
"+ long impulse
+ volumed T2 level
+ volumed 2Sp+
+ 1/2 correction
+ weak test"

F Investment 1D Conservative CounterTrend TradeConservative CounterTrend Trade
+ long impulse
- before 1/2 correction
+ expanding T2
+ support level
+ biggest volume 2Sp-
+ weak test
+ first bullish bar close entry
Calculated affordable stop limit
1 to 2 R/R take profit
Monthly CounterTrend
"- short impulse
+ 1/2 correction
- unvolumed T2
- resistance level
+ unvolumed interaction bar"
Yearly Trend
"+ long impulse
+ volumed T2 level
+ volumed 2Sp+
+ 1/2 correction
+ weak test"

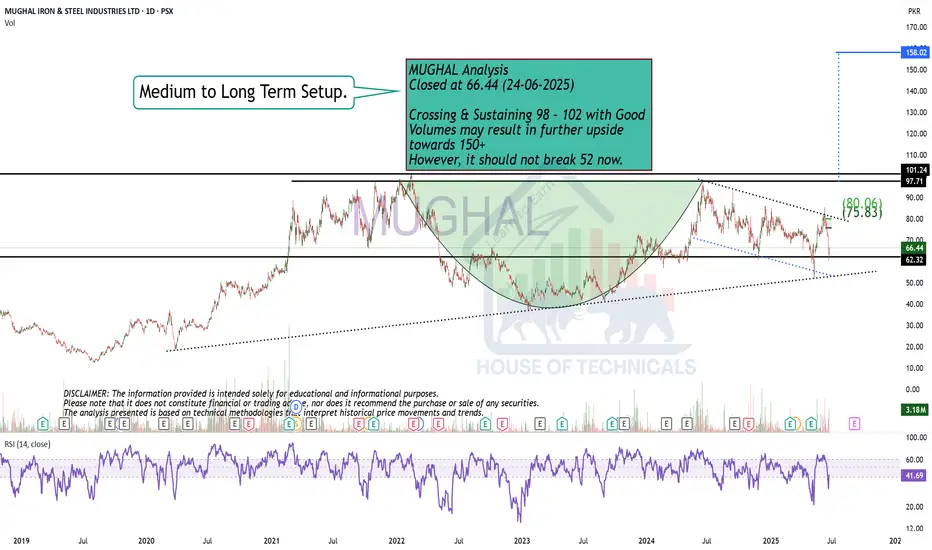
Cup & Handle FormationMUGHAL Analysis
Closed at 66.44 (24-06-2025)
Crossing & Sustaining 98 - 102 with Good
Volumes may result in further upside
towards 150+
However, it should not break 52 now.
Gold Short Term OutlookYesterday’s chart idea is playing out as analysed.
Gold failed to break above the $3,395 resistance and has now pulled back, currently testing the first support zone — aligned with the 4H 200MA and Daily 50MA.
If this area fails to hold, price is likely to head toward the next key support zone, where we expect a potential reaction.
To resume bullish momentum, we need to see a strong close above $3,346. Key bullish zones remain $3,375 and $3,395.
📌 Key Levels to Watch:
Resistance:
$3,375 • $3,395 • $3,418 • $3,439
Support:
$3,361 • $3,346 • $3,330 / $3,306
$3,287 – Critical demand zone
🧠 Fundamental Focus:
All eyes are on Fed Chair Powell’s testimony today, which may offer clues about the Fed’s rate outlook and inflation stance. Any hint of continued hawkishness could weigh on gold, while dovish commentary may trigger renewed upside interest.
Expect heightened intraday volatility around his remarks — stay cautious.

Bearish momentum to meet support on USDCAD: Looking for a bounceEvening, just wanted to share what I’m seeing on the USDCAD chart
Price on USDCAD has been in clear bearish momentum, but we’re now approaching a strong support zone, that’s held firm multiple times before, as I marked it on my chart. Price is approaching the zone again and I am taking it into account for a potential bounce.
I’ll be watching for bullish confirmation as usual requirement before entering. If that support holds, I’m targeting 1.38400 , totally achievable if momentum shifts.
BUT, if this zone breaks with momentum, I’ll reassess it and stay flexible.
💡 Reminder: Patience is power, no entry until price shows me something worth reacting to. This is not financial advice.

Gold Short Term OutlookGold is currently trading around $3,368, caught between dynamic moving average resistance and an intraday resistance zone.
Price must break and hold above the $3,378 resistance to open the path toward $3,395. A confirmed break above the key $3,395 level could signal the start of the next bullish leg.
However, repeated failure to break above $3,395 — or even $3,378 — may drag gold lower into key support zones.
📌 Key Levels to Watch:
Resistance:
$3,375 • $3,395 • $3,418 • $3,439
Support:
$3,361 • $3,346 • $3,330 / $3,306
$3,287 – Critical demand zone
🧠 Fundamental Insight:
Gold remains supported amid rising geopolitical tensions. Over the weekend, U.S. airstrikes targeted Iranian nuclear sites, escalating concerns over a broader conflict in the Middle East. This has reignited safe-haven demand, with gold catching a bid despite recent technical pullbacks.
Meanwhile, traders are weighing softer U.S. inflation signals against the Fed’s cautious stance. If tensions persist and economic data weakens, gold could benefit from both risk-off flows and increased speculation around potential rate cuts.

Gold Medium Term OutlookGold is currently trending within a rising channel after rejecting the $3,439 resistance zone, which marked a new Higher High (HH). Price is respecting the ascending channel support and is now testing the 50MA. The uptrend remains intact, with a sequence of Higher Lows (HL) and Higher Highs (HH) forming within the channel.
A break and hold above $3,378 could open the path for a re-test of $3,439 and potentially $3,501. However, failure to hold the rising channel support may shift momentum bearish, with $3,303 and $3,226 as the next major downside targets.
📌 Key Levels to Watch This Week:
Resistance: $3,378 • $3,439 • $3,501
Support: $3,303 • $3,226 • $3,171
🧠 Fundamental Insight:
Gold remains supported amid rising geopolitical tensions. Over the weekend, U.S. airstrikes targeted Iranian nuclear sites, escalating concerns over a broader conflict in the Middle East. This has reignited safe-haven demand, with gold catching a bid despite recent technical pullbacks.
Meanwhile, traders are weighing softer U.S. inflation signals against the Fed’s cautious stance. If tensions persist and economic data weakens, gold could benefit from both risk-off flows and increased speculation around potential rate cuts.

USDCHF H4 AnalysisUSDCHF Showing a Bearish Flag. If it breaks this zone above, Most probably can fly up to 0.82512 and higher to 0.83491. If no, Can rally between 0.80552 or even lower. Trading Analysis from 23-06-25 to 27-06-25. Take your risk under control and wait for market to break support or resistance on smaller time frame. Best of luck everyone and happy trading.🤗

ONDO — Reversal or more Pain ahead? After a strong rally back in 2024, ONDO topped at $2.15 — completing a clear 5-wave impulsive move. Since then, price has entered a prolonged downtrend, dropping over -70%, with no confirmed reversal signs yet.
We’re now trading around a critical zone near $0.70. So the question is: where’s the next potential bottom?
🔎 Technical Breakdown:
📍 VWAP Breakdown:
The yellow anchored VWAP (Volume Weighted Average Price) has been lost — a clear sign of market weakness. This VWAP was previously acting as support but has now flipped to resistance, which often precedes continued downside.
📌 Key Support Zone:
$0.80–$0.70 was a structural support area that has now been broken — another bearish sign.
📉 Fibonacci Confluence:
Taking the structure and applying a Fibonacci retracement, the 0.786 retracement lies at $0.4828 — let’s round that to a critical $0.50 zone. This level is important for several reasons:
Liquidity rests at a previous key low at $0.50128
Anchored VWAP Band (0.618 multiplier) aligns with the same area
The 8/1 Gann Fan also intersects around this zone
All roads lead to the $0.50 level as a potential high-probability reversal zone. A bounce from here — especially with volume confirmation or reversal candlesticks etc. — would be a signal worth watching.
💡 Educational Insight: Importance of 0.786–0.886 Fibonacci Zone + VWAP
While many focus on the 0.618 retracement, bear markets often go deeper.
The 0.786–0.886 zone is where emotional exhaustion kicks in — traders give up, liquidity pools build, and smart money steps in.
Combining this with Anchored VWAP adds precision:
VWAP reflects where the “average buyer” is positioned. When price reaches confluence with both deep fibs and VWAP fib bands, you have a statistically powerful setup for reversals.
🚨 Note: These zones are not automatic buy levels — watch for confirmation signs before entering.
🛎️ Set your alerts, stay patient, and as always let the trade come to you.
_________________________________
💬 If you found this helpful, drop a like and comment!
Want breakdowns of other charts? Leave your requests below.

USDCHF 15M ANALYSISThe analysis of my next trade works like this
Our entry is: BULLISH
(1) The 4H trendline broke
(2) We retested the 4H support
(3) We wait for a break and retest of our most recent 15 minute support
(4) We comfirm the bullish direction with our volume indicator (we want to see big volume that surprasses the 20 ema that is included in the volume indicator) and a bullish candlestick close.
IF YOU LIKED THE ANALYSIS PLEASE DROP A FOLLOW

EURUSD - 2nd potential entryEvening all
Here is a still screenshot of what I am looking for the market open on EURUSD come Sunday night after the spreads have died down on the pair.
My pending order will go directly on the FVG with my stops below the manipulation of the range.
If I get tagged in great. If I don't also great if we continue to move high I mill just manage the one position.
If I am tagged in I will give you and update with a new idea and then depending on how that idea plays out win or lose I will come back and re-visit it and break it down some more.
However I have high hopes for this trade to make it up to 1.16300
Have a great weekend
and I will speak to you all soon

EURUSD - BreakdownApologies video is a bit rushed.
Wanted to get it done before the weekend arrived.
There's so much more to this video and entry reason that I have left out unintentionally like the fact we swept the Asia lows before creating a BoS. There are also a few other things like I have left out but without looking at the chart right now I cannot remember off the top of my head.
I will post the idea of this trade below so you can see that I was taking it before it played out.
Hope you all have a great weekend and a better trading week than you had this week.
Enjoy
P.S if you have any questions please do message

TMGH Chart AnalysisTMG Holding trend has unfortunately reached a lower region than before. Despite its continuous projects' updates, it reached the mentioned support line 51.233, if it continued decreasing it might reach the support line 51.142 then 51. On the other side, this decrease isn't expected to be long. It is expected to rebound to reach the resistance line 51.386, then the resistance line at 51.631, then the resistance line 51.806

Play on levelsMonthly closing above 66 is actually
an important Support.
Retest of Trendline done.
Weekly Support is around 71 - 68.
Immediate Resistance is around 91 - 92.
If this level is sustained, we may witness 96 - 97

GBPJPY I Expect a Rally from the Buy Zone in the 1H Time FrameDescription:
I'm viewing the 195.116–194.845 range on GBPJPY as a strong buy zone. My target is 196.088. Once the trade setup becomes active or the target is reached, I’ll be sharing an update here. Stay tuned!
I meticulously prepare these analyses for you, and I sincerely appreciate your support through likes. Every like from you is my biggest motivation to continue sharing my analyses.
I’m truly grateful for each of you—love to all my followers💙💙💙
