GBPCAD new bearish push expecting
OANDA:GBPCAD price break zone, currently in BEARISH PENNANT, after todays BOC event here for expect bearish push
SUP zone: 1.85800
RES zone: 1.84200, 1.83800
Supportandresistancezones

EURJPY higher bearish expectations from here
OANDA:EURJPY analysis before this one, is be closed, i am note will share new analysis on EJ soon.
ASCENDING CHANNEL visible, price in zone currently, after ISM events today, we are not see break of res zone 164.250, which for me having positive imact on bearish expectations here.
Trend line is breaekd and soon exxpecting to see and break of ASCEDING CHANNEL and higher bearish fall continuation.
SUP zone: 164.250
RES zone: 161.750, 160.900

Bearish Divergence on Bigger tf
CMP 105228.47 (02-06-2025)
Bearish Divergence on Bigger tf (Cautious
approach should be taken).
However, if 109350 is Crossed, we may
witness 115000 & then 120000 - 121000.
and if 112000 is crossed & sustained, be ready
to get New Highs :-)
Lets be more cautious & dig out 3 Important
Support Levels.
S1 around 103000 - 102500
S2 around 97800
S3 around 93400 - 93500.

ETHUSD short-term🔍1. Technical situation
ETH/USD is in a consolidation phase — the price is moving in a rather narrow range, without a clear upward or downward trend.
📊
The upper limit of this consolidation is the resistance zone of USD 2,664–2,717 (green rectangle on the chart).
The lower limit is the support zone of USD 2,495–2,446 (red rectangle).
2. Potential formation
A potential double bottom formation can be seen on the chart, which is a classic trend reversal formation to an upward one.
The lows occurred around May 25–31 and at the end of May.
Confirmation of the formation would be a breakout of the resistance zone of USD 2,664–2,717.
3. Technical indicators
RSI:
Currently, the RSI has rebounded from zone 40 and is heading up. Exceeding the 50 level may be a signal of buyers' strength and support for the bullish scenario.
On the chart: "Potential rebound signal - watch break above 50"
MACD:
MACD is close to generating a momentum change signal (potential intersection of the MACD and signal lines).
On the chart: "MACD near signal - watch for momentum shift"
4. Scenarios for the coming hours/days
Bullish scenario (up):
✅
If the price breaks above USD 2,717 (exit from consolidation upwards), a dynamic move towards USD 2,800 can be expected.
Support for this scenario will be signals from RSI and MACD.
Bearish scenario (down):
🔻
If the price rejects the resistance zone and returns below USD 2,446, the risk of going down to the next support in the area of USD 2,300 increases.
🧠
Summary
Key Levels:
📌
Support: $2,495-$2,446
Resistance: $2,664-$2,717
Currently, the market is in consolidation with an attempt to break out to the top.
Watch for: Resistance breakout (potential bullish signal) and support reactions (potential bearish).
Pattern: Potential double bottom - needs confirmation.

Though stock is Bullish, but
Though stock is Bullish, but a Very Strong Resistance
is around 11.50 - 12.
Crossing & Sustaining this level may
lead it towards 14 initally.
8 should be the Stoploss as of now. Breaking this level
will drag the price towards 6.50 - 7.40

BTCUSD BUY IDEA-EASY CONFLUENCE PLAY??After reaching an all-time high (ATH) last week, Bitcoin is currently positioned at a pivotal $105,484 at the .23 level according to the Fibonacci trend. It has retraced to previous highs around $105,000 to $106,000. Recently, it bounced off the support level of approximately $102,740 on the 4-hour and daily charts and seems to be forming higher lows. I believe we could see a confluence play that aligns with the previous price action that led to the ATH.

EGX30 Current Region AnalysisEGX30 stock is currently in a neutral region. In case of falling, it's expected to break the support line 32,498.905 to reach then 2nd at 32,408.426 then the third at 32,376.503. In case of rising, it's expected to breach the resistance line 32,546.761, to reach then 2nd at 32,621.248 then the 3rd at 32,695.736

HBAR (Local) Elliot Wave ii UnderwayHBAR appears to have completed a leading diagonal for wave 1 after finding a bottom at the major support high volume node (HVN).
Wave 2 has retraced the expected 61.8% Fibonacci but alt coins have their own Golden Pocket at the 78.6% retracement which aligns with the S1 pivot and high volume node.
The descending resistance line has been tested as support leaving a doji but does not look strong enough to be the bottom yet.
Wave 3 should be a powerful move up.
This analysis is invalidated below macro wave 4 -$0.12556
Safe trading

BTC/USD 4h Char ReviewHello everyone, I invite you to review the current situation on BTC taking into account the 4-hour interval. We can see how the price is maintained just below the upward trend line, while a downward trend channel may be forming locally.
Here you can see how the price decline is maintained in a strong support zone from $ 105,000 to $ 103,150, however, if the support zone is broken, the price may quickly fall to the support area at $ 100,700
Looking the other way, you can see that when the trend reverses, we first have resistance at $ 106,560, the next is at $ 108,590, and then you can see very strong resistance at the level of the last ATH in the area of $ 112,000.
On the MACD indicator and the RSI indicator, you can see how we are maintaining in the lower part of the range, which indicates that the price bounce is still taking place to continue the growth.

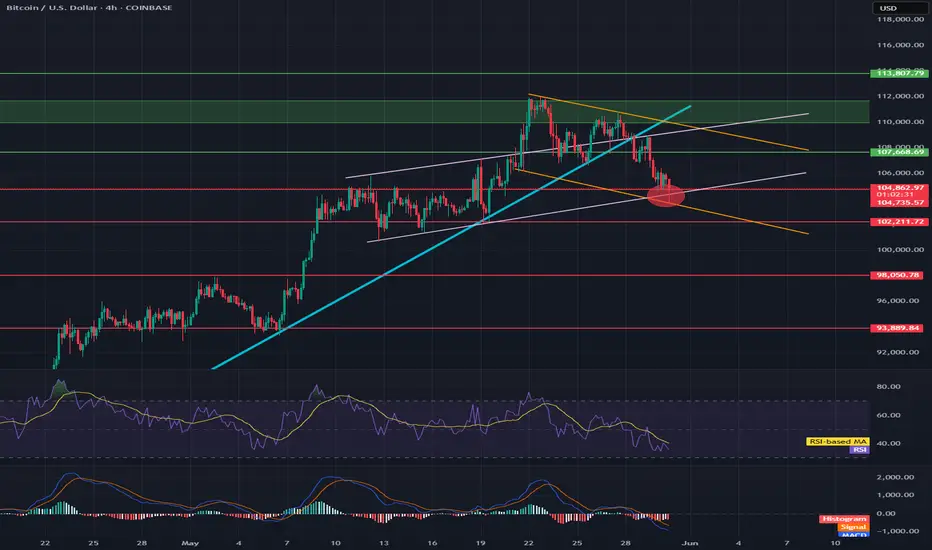
Will BTC hold its price?Hello everyone, I invite you to review the current situation on BTC. When we enter the four-hour interval, we can see how the BTC price has left the ongoing upward trend line at the bottom, and what's more, we can see how the current movement is creating a local downward trend channel in which the price is currently on the border of the previously created upward trend channel, which gives a strong support point.
Here we can see how the current downward movement has entered the support circle that starts around $ 104,800 and ends around $ 102,200, this is the place where two conflicting channels have converged. If these supports do not hold the price, we can see a quick recovery to around $ 98,000, and then to the level of $ 93,900.
Looking the other way, we can see that when the trend reverses, we first have resistance at $107,670, then a resistance zone from $110,000 to $111,700 is visible, at the border of two channels, and then resistance is visible around $113,800.
On the MACD indicator, we can see a return to the downtrend, while on the RSI we return to the lower part at the lower border, which could potentially provide energy for a future upward movement.
PLUG 1D Investment Long Aggressive Trend TradeAggressive Trend Trade
- short impulse
+ volumed TE / T1 level
+ support level
+ biggest volume 2Sp-
+ weak test
+ first buying bar close level
Calculated affordable stop limit
1 to 2 R/R take profit
Monthly Trend
"+ long impulse
+ support level
+ T2 level
+ biggest volume reaction bar
= below 1/2 correction"
Yearly CounterTrend
- short impulse

EURNZD new bearish expected
OANDA:EURNZD in last period price is have upside-downsides moves, price is make again bounce on strong zone (1.91000), yesterday we are have and RBNZ, how looks from here we wil lcan expect higher bearish trend.
SUP zone: 1.91000
RES zone: 1.85000, 1.83500

GBP/USD Breakout (28.05.2025)The GBP/USD Pair on the M30 timeframe presents a Potential Selling Opportunity due to a recent Formation of a Breakout Pattern. This suggests a shift in momentum towards the downside in the coming hours.
Possible Short Trade:
Entry: Consider Entering A Short Position around Trendline Of The Pattern.
Target Levels:
1st Support – 1.3424
2nd Support – 1.3380
🎁 Please hit the like button and
🎁 Leave a comment to support for My Post !
Your likes and comments are incredibly motivating and will encourage me to share more analysis with you.
Best Regards, KABHI_TA_TRADING
Thank you.
Disclosure: I am part of Trade Nation's Influencer program and receive a monthly fee for using their TradingView charts in my analysis.

PLUG 1H Long Swing Conservative Trend TradeConservative Trend Trade
+ long impulse
+ 1/2 correction
+ volume zone
- strong approach
+ ICE level
+ support level
+ volumed Sp
Calculated affordable stop limit
1 to 2 R/R take profit
Daily Trend
"- short impulse
+ volumed TE / T1 level
+ support level
+ biggest volume 2Sp-
+ weak test"
Monthly Trend
"+ long impulse
+ support level
+ T2 level
+ biggest volume reaction bar
= below 1/2 correction"
Yearly CounterTrend
- short impulse
Will add more after successful test on 1H and / or after test completes on 1D.

MAXHEALTHCARE - Could Breakout from DTHMAXHEALTHCARE has resistance weakening on the Daily charts and may give a breakout with good volume in coming days.
The target of this pattern signals an upside potential of 15% from the current price level in the medium term.
The stock is trading above its 50- and 100-day exponential moving averages (EMAS) recently. Look for the range to more than 1.5X, and the Volume 1.5X the average.
CMP- Rs. 1149
Entry Price- 1200
Target Price- Rs1380 (15% upside)
SL- 1142
Need to wait for the entry to get triggered.
Disclaimer: This is not a buy/sell
recommendation. For educational purpose only. Kindly consult your financial advisor before entering a trade.

DEEPAK FERTILIZER - Breaking Out in DTF, New ATHDEEPAKFERT has resistance weakening on the Daily charts and has given a breakout with good volume and making a new ATH.
The target of this pattern signals an upside potential of 20% from the current price level in the medium term.
The stock is trading above its 50- and 100-day exponential moving averages (EMAS). The range is more than 1.5X, and the Volume is also 1.5X the average.
CMP- Rs. 1449.80
Target Price- Rs. 1650 (~20% upside)
SL- 1356
Disclaimer: This is not a buy/sell
recommendation. For educational purpose only. Kindly consult your financial advisor before entering a trade.

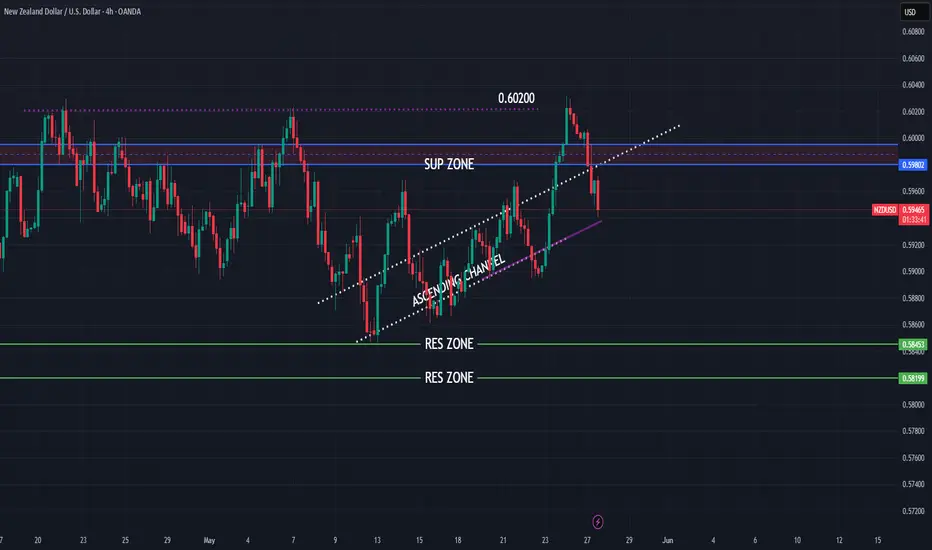
NZDUSD higher falls expecting
OANDA:NZDUSD ASCENDING CHANNEL visible, we are have break of same on 23.5, price is start pushing but on first res zone (0.60200), price is start making reverse.
Currently again in ASCENDING CHANNEL expectations for this week are to see break and bearish push.
SUP zone: 0.59800
RES zone: 0.58450, 0.58200
EURCHF both scenarios possibles
OANDA:EURCHF UPDATE from first analysis (attached) we are have upside - downside moves, new trend line is created, sup zone is created (violet line) and we can see also long zone.
If we see break of 0.94000 we will be higly possible in bullish move, break of sup zone (violet line) we will can see bearish move.
Currently still giving higher chances for bearish trend, but lets see some stronger moves.
SUP zone: 0.93850
RES zone: 0.92750, 0.92550

EURJPY still to expect bearish for new week
OANDA:EURJPY strong bearish bounce from top line of price action, currently price in rectangle and on bottom line of price action.
EUR with all showing self the weakest in last periods and expectations are still to see weaknes, here expecting break of rectangle and trend line of PA and higher bearish continuation till res zone.
SUP zone: 163.300
RES zone: 160.600

XAUUSD LONG AND SHORT Hi Guys,
Weekly VP prints out some important levels, which I have marked on the chart. Each of those levels acts as a support level therefore buyers showing up is expected. Break below 294 and confirmation would result in price further dropping to 272.
Also 316 and levels above it have been marked as resistance and seller showing up is expected.
Make sure add your own logic into this before taking any position.
Be honorable

NZDCHF - Bullish - BUYCALL BULLISH INDICATIONS:
1- Market currently in consolidation phase with in a down channel
2- market has bounced back from good support level
3- if the market break the last LH / neckline, we can enter into the market with
a TP of R:R of 1:1 and the Stoploss slightly below the LL or the Support level.

USD/JPY - H1 - Channel Breakout (17.05.2025) The Pair on the H1 timeframe presents a Potential Selling Opportunity due to a recent Formation of a Channel Breakout Pattern. This suggests a shift in momentum towards the downside in the coming hours.
Possible Short Trade:
Entry: Consider Entering A Short Position around Trendline Of The Pattern.
Target Levels:
1st Support – 142.40
2nd Support – 140.17
🎁 Please hit the like button and
🎁 Leave a comment to support for My Post !
Your likes and comments are incredibly motivating and will encourage me to share more analysis with you.
Best Regards, KABHI_TA_TRADING
Thank you.
Disclosure: I am part of Trade Nation's Influencer program and receive a monthly fee for using their TradingView charts in my analysis.

Though still in Uptrend, but BNL Closed at 37.39 (25-03-2025)
Though still in Uptrend, but
as mentioned earlier, bearish divergence
has started appearing on bigger tf, so
cautious approach should be taken.
It may re-test 35.20 - 36.20 & bounce as this
is an important Support level.
Otherwise next Support seems to be around
32.30 - 32.50
