at the verge of Breakout!
at the verge of Breakout!
Sustaining 136 - 137 would lead it towards
141 - 144 & then 148-150.
Otherwise, 120-121 seems to be a Good
Support level.
and this time if 108 is broken,we will see
heavy Selling.
Supportandresistancezones

Gold - $3160 before the next move up?Introduction
Gold is currently exhibiting interesting price behavior across multiple timeframes, reflecting a mix of short-term bullishness within a broader context of consolidation. On the one-hour chart, gold is trading within a well-defined rising channel, suggesting a controlled upward correction following a strong impulsive move downward. This upward movement appears to be a retracement rather than a full reversal, especially when analyzed in conjunction with the higher timeframes.
Daily tight range
Zooming out, gold remains range-bound between the key levels of $3,500 and $3,200. The market has been oscillating within this wide horizontal band, making relatively equal highs and lows. This type of price action typically signals indecision or accumulation, where neither buyers nor sellers are firmly in control. Such a range can often precede a more decisive move in either direction once a breakout occurs. Until then, the market remains reactive to both support and resistance zones within this range.
Latest Gold sell-off
Yesterday’s trading session introduced a notable shift in momentum, as gold posted a large bearish candle on the one-hour chart, marking a sudden and aggressive sell-off. This move established a short-term bearish impulse. Since that moment, however, the price has been gradually recovering, climbing back within the confines of the rising channel. This rebound appears corrective in nature and has yet to reclaim the previous levels before the sell-off. Above the current price action lies a one-hour Fair Value Gap (FVG), which could be an area of interest for liquidity hunters. Should gold manage to break out to the upside of the channel, it is quite possible that price action will aim to fill this FVG, which sits around the $3,300 level. This could represent a short-term bullish target before any potential continuation lower.
Bearish scenario
On the flip side, the more compelling scenario from a technical standpoint lies on the downside. If gold fails to sustain its upward trajectory and breaks below the lower boundary of the rising channel, the probability of a move toward the strong support level at $3,160 increases significantly. This level is particularly noteworthy because it aligns with multiple technical confluences. It represents a historical support area where price has previously reacted strongly, and it coincides with the so-called “golden pocket” of the Fibonacci retracement, typically considered a high-probability reversal zone by many traders. The presence of this confluence suggests that a breakdown could trigger a swift move toward this level, possibly attracting buyers once again if the support holds.
Bullish scenario
While the potential to move higher toward the $3,300 region and fill the FVG remains valid, especially if the current bullish momentum within the channel continues, it is, in my view, the less probable scenario. The recent sharp downward candle suggests that sellers have established control in the short term, and the current upward movement may simply be a retracement before a continuation lower.
Conclusion
In conclusion, the most likely and technically supported path for gold appears to be a breakdown from the rising channel, followed by a decline toward the $3,160 support level. This zone, bolstered by historical significance and Fibonacci confluence, presents a strong target for price if bearish momentum resumes. While a temporary push toward $3,300 is possible, especially to fill the FVG, it should be seen as a lower-probability scenario compared to the downside risk currently unfolding.
Thanks for your support.
- Make sure to follow me so you don't miss out on the next analysis!
- Drop a like and leave a comment!

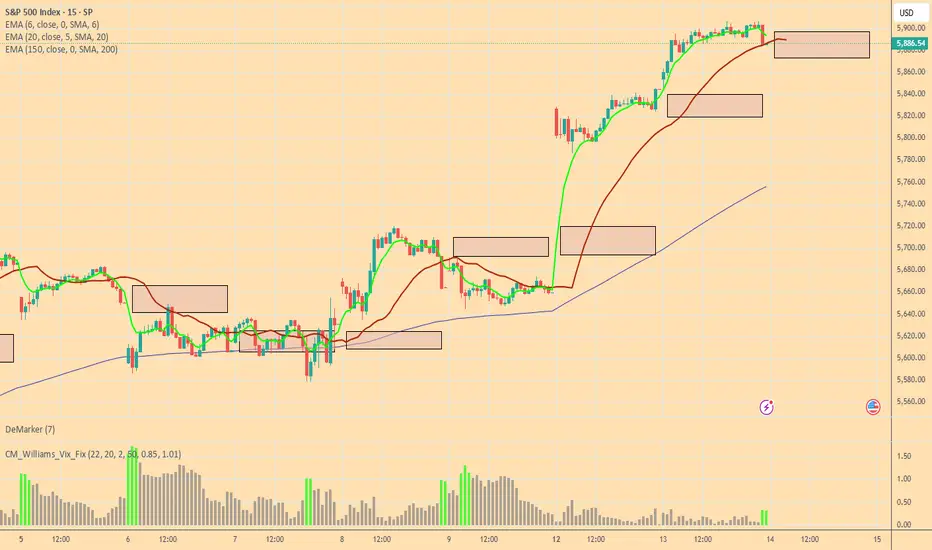
Bulls and Bears zone for 05-14-2025ETH session markets trending higher, could traders continue this week's rally or need to be cautious.
Levels to watch: 5912---5914
Bullish divergence is there but
Bullish divergence is there but
19-19.10 is Important to Sustain on
Monthly basis.
also there is a Very Important
Support around 16.30 - 17.20

ABCD still intact..Couple of Green candles above 20
would trigger more positivity.
Upside targets are intact 27-28 &
then 30+
Should not break 17 now.

EURUSD - at Resistance: Will it drop to 1.11300?OANDA:EURUSD price is now at a strong resistance level, this is an area where it has struggled to break through in the past and reversed to the downside. It's also where sellers have stepped in before, so it’s worth keeping an eye on, especially for anyone considering short trades.
If we start seeing signs that the price is getting rejected here: like long wicks, bearish candles, or buyers starting to lose momentum, I think we could see a move down toward the 1.11300 level. But if price breaks through this zone clearly, that might dismiss the bearish idea and suggest even more upside will continue.
This area is pretty important and could give us a better idea of where price is headed next.
Just sharing my thoughts on support and resistance, this isn’t financial advice. Always confirm your setups and manage your risk wisely.

BTC 15M APEX ENTRY Confirmed by 1H TrendThis 15-minute Apex Entry aligned with the 1H trend, avoiding fakeouts and confirming direction.
The Tenoris Apex Suite uses real-time support/resistance detection and multi-timeframe logic to identify breakout entries with zero lag.
I use this method to focus only on trades that align across key timeframes.
Not financial advice – just sharing how I trade.
For access, see profile bio.

No Payout but..
Though NO PAYOUT, but Very Good Result.
If 31.50 is Sustained, we may witness 34-35
tomorrow.

EURCAD no3 view, bearish continuation still to expect
OANDA:EURCAD last two analysis on EURCAD doing, going good, will be attached, having now one more update and new view.
Price at end is break RAISING WEDGE and BEARISH FLAG, pushing strong bearish, strong volumem and momentum is gathered and still here having strong bearish expectations.
SUP zone: 1.57200
RES zone: 1.53000, 1.51600

BTCUSD – Multi-TF Bearish SFP & Fib Retrace Before ATH Rebound
Bearish SFP printed on 4H / 8H / 12H / 1D at $103 345 – $104 985 after a parabolic ~$94 k → $104 k run and multiple rejections at $104 k–$106 k resistance.
Trump tariff-cut announcement sparked a sharp spike into resistance that was quickly sold off, confirming heavy supply at $104 k – $106 k.
Baseline plan: drop to 0.786 Fib ~$102 586, then 0.618 Fib ~$100 613, before a push toward the ATH ~$109 588.
Trade Setups
Short – SFP Breakdown
Trigger: 4H close below $103 345
Entry: ≈ $103 300 on retest
SL: $105 500 (above swing high)
TP1: 0.786 Fib ≈ $102 586 RR ≈ 0.7
TP2: 0.618 Fib ≈ $100 613 RR ≈ 2.6
Long – Fib Rebound
Trigger: Bullish reversal at 0.618 Fib / FVG cluster ≈ $100 613
SL: $99 300 (below FVG)
TP1: SFP top / range high ≈ $104 145 RR ≈ 2.7
TP2: ATH ≈ $109 588 RR ≈ 6.8

Bullish Momentum
Closing above Trendline around 133 - 134
would keep it Bullish.
Upside targets can be around 150-160.
However, breaking 131 will bring more
selling pressure towards 113 - 115.

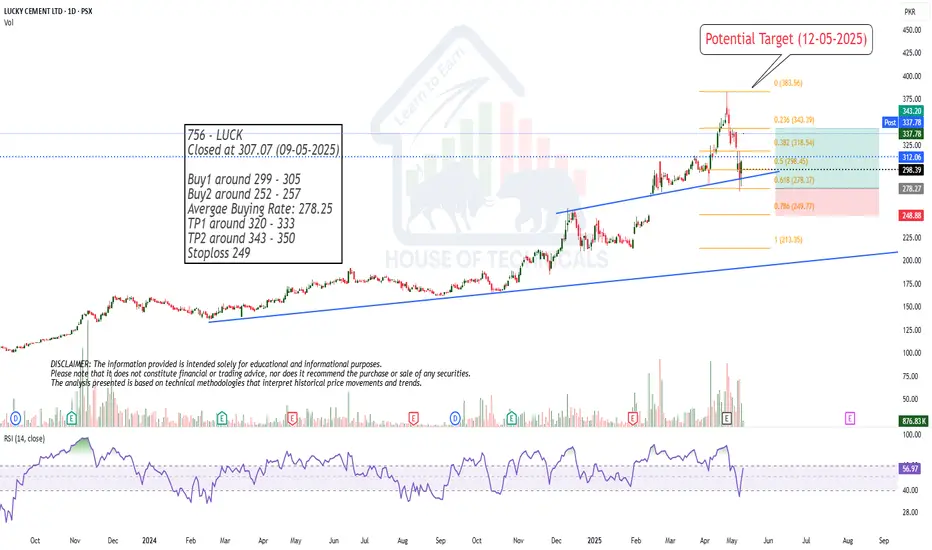
Still Potential to Move Up.It still has the Potential to Move Further Up.
It was Capped today with Huge Volumes.
Potential Target is around 380+
SUI - Leveraging Fibonacci & Elliott for Precision TradesSUI’s movement is rapid, sharp swings—both up and down. In volatile conditions like this, we aim 0.702–0.786 fib retracements (and occasionally 0.886 in harmonic contexts) for high‑probability entries. Below is a clear, Elliott-focused breakdown of the current setup and both long and short trade plans.
Before diving into the charts, let’s cover the basics of Elliott Wave Theory. Elliott Wave Theory provides a roadmap for market psychology by dividing price action into two distinct phases:
1. Impulse Phase (Waves 1–5)
Wave 1: The spark that ignites a new trend as early adopters push prices beyond the prior range.
Wave 2: A corrective pullback that tests the strength of the emerging trend, often retracing 38–61.8%.
Wave 3: The powerhouse wave—typically the longest and most dynamic—driven by broad market participation and often extending to key Fibonacci levels (1.618, 2.618).
Wave 4: A consolidating correction that digests gains and builds the base for the final thrust; it must not overlap Wave 1 territory in a classic impulse.
Wave 5: The final leg of the advance, often fueled by last bursts of optimism and weaker hands.
2. Corrective Phase (Waves A–B–C)
Wave A: Initial counter-trend reaction as profit-taking begins.
Wave B: A deceptive retracement back toward the trend, frequently trapping traders.
Wave C: The concluding leg of the correction, which typically tests or breaks the low of Wave A before the next cycle begins.
Key Points:
Impulse waves showcase momentum and structural clarity, often aligning with Fibonacci extensions.
Corrective waves follow Fibonacci retracements (38.2%, 50%, 61.8%), offering optimal entry points.
Wave 3 is seldom the shortest; Wave 4’s complexity sets the stage for Wave 5’s final push.
In the current SUI structure:
Wave 1 ignited the initial rally.
Wave 2 delivered a healthy retracement, a pullback close to the 0.618 fib, setting the stage for stronger momentum.
Wave 3 roared to a powerful peak topped at the 2.618 extension ($3.875)
Now, we’re deep into Wave 4, likely an ABC corrective pattern. This pause is critical—it gathers energy before the final push of Wave 5. Below is a clear breakdown of each wave, big-picture confluences, and trade setups.
🚀 Elliott Wave Overview
1. Wave 1 & Wave 2
Wave 1: Quick surge from $2.4175 → $2.75, setting initial momentum.
Wave 2: Pulled back close to the 0.618 fib, creating a solid launchpad.
2. Wave 3: The Power Move
Peak: Hit the 2.618 extension of Wave 1→2 and aligned with the –2 extension of Wave 1.
Significance: In strong bull markets, a run to the 2.618 extension often precedes a meaningful pullback. Here, Wave 3’s exhaustion suggests a retrace toward the 38.2% Fib of that advance—our ideal Wave 4 entry zone.
3. Wave 4: The Correction
All eyes on the $3.17 level—the projected 1:1 extension of A→B and 0.382 fib retracement of Wave 3. This confluence zone is yet to be tested and could offer an ideal Wave 4 entry.
ABC Pattern: Currently working on Wave C.
4. Wave 5: The Finale
Target Zone: $4.00–$4.35, with strong focus at $4.31
Extension Levels:
1.133 → $3.9695 aligns with the 0.618 fib retracement.
1.272 → $4.0683 is close to the weekly resistance level.
1.412 → $4.1678 alings with the 0.666 fib retracement.
1.618 → $4.3142 alings with the key swing high.
🔑 Key Confluence Levels
Golden Pocket: $3.9739–$4.1492 (90-day retrace).
Speed Fan 0.618: Support around $3.15.
Fair Value Gap:
Psychological: $3.00 major support.
📈 Long Trade Setup
Entry Ladder: $3.25–$3.111 (stack orders to DCA)
Stop‑Loss: $3.07 (just below the 0.786 Fib low)
Profit Targets:
Fib 1.133 at $3.9795 ($4 psychological & partial take‑profit)
Fib 1.272 at $4.0683
Fib 1.412 at $4.1678
Fib 1.618 at $4.3142
Risk:Reward: ~6:1+ (average entry around $3.20 → SL at $3.07 → TP1 at $3.9795)
📉 Short Trade Setup
Entry Zone: $4.00–$4.35 (sweet spot at weekly level/yearly open)
Confirmation: Bearish reversal candle or volume spike down
Stop‑Loss: Above $4.35
Target: $3.77 (near Wave 3 high turned support)
Risk:Reward: ~2:1 (varies with DCA entry)
⚙️ Summary & Game Plan
Primary Bias: Long in the $3.25–$3.111 zone—stack into the 0.382-0.412 fib retracement entries with tight SL, aiming for the $4.00–$4.30 upside zone.
Alternate Bias: Short on a clear rejection within $4.00–$4.35, targeting $3.77 or lower.
Risk Management: Keep stops tight to maximize R:R.
Patience & Confirmation: Wait for price to reach these zones and show reversal signals (price action, volume, patterns) before committing.
All set—now let SUI’s swings unveil the opportunities. Sit tight, follow your plan, and let patience pay its dividend.
Happy Trading!
____________________________________
If you found this helpful, leave a like and comment below! Got requests for the next technical analysis? Let me know.

NZDJPY LONGHey everyone we looking for a long NZDJPY, we were having a uptrend for an quiet a while so this is what i see and why i will taking a buy
1) break and retest to daily support and reject few times
2) reject from a 50% Fib level
3) break our counter trend line on 4h which shows us buyer is taking over
4) shift from bearish to bullish market after break of structure on1h
5) reject Daily and 4h 50 EMA
6) engulfing bullish on 4h
Im aiming 1:2 risk to reward Ratio

Risk aversion in China-US negotiations cools down!Gold closed with an "inverted hammer" positive line this week. The upper shadow line was mainly due to the continued stimulation of gold's safe-haven properties by the news at the beginning of the week. However, the tariff war with previous lessons helped the gold price to hit a historical high of 3500. The reaction of gold prices to this news this week was not as enthusiastic as before, which also led to the stop of the rise at 3439. The announcement of the interest rate decision in the second half of the week was in line with expectations. The gold price plunged 170 points in two days and stabilized above the 3300 mark as of yesterday's closing. Based on the previous evening star combination and this week's inverted hammer, it is believed that the gold price will continue to fall next week and will close below the real time, that is, below 3306.
From the perspective of daily K, this week is generally a trend of rising and falling, and a slight rebound follows after the decline at the end of the week. Weekly Review We continue with the analysis of the second half of the week. From the perspective of the gold price trend since the high point of 3500, the first wave of decline has been considered to be over. The rebound from 3200 to 3439 did not exceed the previous high, so we will continue to analyze the second wave of decline, and strictly implement this idea in the operation. Now the overall trend of gold prices is also the same. Next week's operation will focus on the key suppression position of 3378 near the end of the week. If it cannot stand firm in the first half of the week, there is still a lot of room for further decline.
From the four-hour level, the triangle convergence pattern we analyzed is still there. Unexpectedly, there was a false break of the lower track in the Asian session on Friday. Next week, we still need to continue to pay attention to the support of this position. In general, next week, we will first pay attention to the operation of the range from 3378 to 3274, and wait for the break before I will re-analyze the structure. Once again, I would like to remind you that the news market is repeated, and the base of gold prices is too large, so the intraday volatility has also increased. It is also common to go up and down more than 100 points in a single day. Everyone needs to pay attention to the risk control of their positions.
In the short term, if we move to the hourly level, we can analyze the last wave of structure. The gold price rebounded after breaking through 3288 in the Asian session on Friday. After this action, the gold price rebounded quickly. Let’s not talk about who has the upper hand. From the last wave of rebound, the continuation is insufficient. If it is a restart of the bulls, the European and American sessions also need to cross the previous downward high point of 3368 to confirm. However, the European session was sideways throughout, and the US session also slightly continued the rebound trend and closed hastily. Therefore, at the opening of next week, it is necessary to continue to watch the gold price to test the support of the low point of the Asian session on Friday. In general, the operation ideas for next week are mainly high-altitude, and low-long also look at the rebound short-term.

SOL Analysis Deep Dive: Identifying Optimal Entry and Exit ZonesYesterday, SOL gave a sharp downside shakeout, dropping from the weekly open at $147.98 (perfectly retested) down to the 0.5 Fib retracement of the swing at $140.25. Here’s a structured breakdown of the key levels, trade setups, and R:R profiles for both longs and shorts:
🔑 Key Levels & Confluences
1. Higher-Timeframe Opens
Weekly Open & Retest: $147.98 – pivoted price before the drop
Monthly & Prior-Day Open Cluster: $147.98–$146.31 – strong support confluence zone
2. Fibonacci Support Zones
0.5 Fib at $140.25 – primary mean-reversion entry
0.786 Fib (smaller wave) at $138.78 – secondary, deeper support
3. Order Block
Daily Bullish Order Block at $139.87 – just below 0.5 Fib, adds extra support
4. Volume-Weighted Average Price
Anchored VWAP (from ATH $295.83) at ~$166.45 – key upside resistance
5. Market Profile Value Areas (10-Day Range)
Value Area High (VAH) at ~$153.00 – overhead resistance confluence
Value Area Low (VAL) at ~$145.75 – underpins support
📈 Long Trade Setups
1. 0.5/0.786 Fib + Daily Bullish Order Block
Entry: $141-138.78
Stop-Loss: $137.5
Target: $165 (anchored VWAP / Fib zones)
R:R ≈ 9:1
2. Higher-Timeframe Open Cluster
Entry Zone: $147.98–$146.31(monthly/weekly open)
Stop-Loss: $142.5
Target: $165
R:R ≈ 3:1
• Why these levels? The 0.5 Fib is a classic mean-reversion zone, bolstered by the daily order block. The $147–146 zone ties together multiple opens (weekly, monthly, prior-day), offering a solid demand area if price retraces back up.
📉 Short Trade Setup
Trigger: Rejection / swing-failure around $153.4
Entry: $153.4
Stop-Loss: $154.3
Target: Weekly/Monthly open (~$147)
R:R ≈ 6:1
• Low-risk short: A clean rejection at the recent high lets you define risk tightly above the swing, aiming to capture the retrace back to the opens.
🎯 Summary & Game Plan
Primary bias: Look for long entries at the 0.5 Fib ($140.25) or the open-cluster zone ($147–146), with targets toward the anchored VWAP at ~$166.
Alternate bias: A short on clear rejection from $153.4, targeting the opens as support.
Risk management: Keep stops tight (SL below $137.5 or above $154.3) to maximize R:R on your favored setups.
Volume & Price Action: Confirm entries with an uptick in volume or bullish price structure (for longs) or swift failure patterns (for shorts).
Now it’s a waiting game! Let price revisit these zones, watch for confirmation signals, and then scale into your chosen side. Good luck! Don't chase, let the charts come to you!
____________________________________
If you found this helpful, leave a like and comment below! Got requests for the next technical analysis? Let me know.

ETH is fighting in a strong resistance zone!Hello everyone, I invite you to review the current situation on ETH. When we enter the one-day interval, we can see how the ETH price came out on top from a strong downward trend.
Here we can see how the current bounce brought the movement closer to a very strong resistance zone from $ 2,090 to $ 2,310, in which we can currently observe a fight for further upward movement. Only when the price comes out on top, it can go towards resistance at $ 2,740, and then move towards strong resistance at $ 3,070.
Looking the other way, we can see that when the trend reverses, we first have support at $ 1,837, then a very strong support zone from $ 1,610 to $ 1,404 is visible, however, if this zone is broken, we can see a quick decline to the support area at $ 1,071.
On the RSI indicator we can see how strong the ETH price movement is visible intensively on the indicator and here we can see how we are approaching the upper limit, which could potentially slow down the movement or give a temporary relief.

USD/CAD could decrease to C$1.35The US dollar has weakened recently against other major currencies including the euro, pound and yen. While it may not have grabbed the headlines, there’s another currency we can add to that list: the Canadian dollar.
The Canadian dollar – which was trading at around C$1.45 per US dollar at the end of January – may continue to strengthen against its southerly neighbour in the near term, potentially reaching C$1.35 per US dollar. Let’s examine why.
The area between C$1.38 and C$1.39 has previously served as a resistance zone for USD/CAD, marking significant tops in 2022, 2023 and 2024. Each time, this area ended the dollar’s gains and led to a renewed period of Canadian dollar strength. The pattern changed in October 2024, when – after multiple failed attempts to break through resistance – USD/CAD finally pushed to a new high of C$1.45. Now, as USD/CAD declines from that peak, the old resistance area of C$1.38 to C$1.39 is providing support.
If USD/CAD falls below support at C$1.38, it could decline towards C$1.347, partly because there are no meaningful levels of support to slow such a move. A falling bear flag pattern also seems to be forming, suggesting that a breakdown may be imminent, potentially supporting a drop to around C$1.35. Meanwhile, the completion of the diamond reversal top that formed from December 2024 to March 2025 could imply a return to the pattern’s origin near C$1.35.
The USD/CAD chart pattern also shows a high degree of symmetry between the left and right sides. In other words, the decline on the right side is occurring at a similar pace to the earlier rise on the left. Completing this symmetrical pattern might suggest a return to the starting point around C$1.35.
Of course, if support at C$1.38 holds and the Canadian dollar does not strengthen further, a swift rise for the US dollar back towards C$1.41 cannot be ruled out.
Written by Michael J. Kramer, founder of Mott Capital Management
Disclaimer: CMC Markets is an execution-only service provider. The material (whether or not it states any opinions) is for general information purposes only and does not take into account your personal circumstances or objectives. Nothing in this material is (or should be considered to be) financial, investment or other advice on which reliance should be placed.
No opinion given in the material constitutes a recommendation by CMC Markets or the author that any particular investment, security, transaction, or investment strategy is suitable for any specific person. The material has not been prepared in accordance with legal requirements designed to promote the independence of investment research. Although we are not specifically prevented from dealing before providing this material, we do not seek to take advantage of the material prior to its dissemination.

Hidden Bullish Divergence +Hidden Bullish Divergence +
Closing above 298 is a +ve sign.
Immediate Support can be around 283 - 287.
Breaking 272 may bring more
selling pressure towards 246 - 250.

at an Important Support
25.40 - 26 is an Important Support level.
25 should be the SL.
Upside targets can be around 27 - 28 initially.

Support & Resistance
R1 around 95900 - 97100
R2 around 101500 - 101900
S1 around 92400 - 92500
S2 around 88500 - 88900

Strengthen your trading strategy? How about a statistical entryFor those watching or trading the USD/JPY pair: the spread of 0.007–0.0072 on the Yen futures is still in play
We're 30 days out from expiry, and there are no clear reasons to brake a rally in the futures contract (which would mean a drop in USD/JPY).
Now, a quick word on Expected Range (ER) and its boundaries.
As we’ve seen, price didn’t quite reach the 2 ER level before bouncing back up. Quick note here — price doesn’t owe us anything. It doesn’t have to hit any statistically calculated levels just because we’re watching them.
But if it *had* reached that 2 ER boundary, it would’ve been a killer entry setup. Why? Because as a reminder, 2 ER marks about a 95% probability that price won’t break through — meaning a strong chance of a bounce.
P/S
For more detailed insights, don’t forget to check out our website and leverage the extensive original analysis from our team to enhance your trading performance! 💪💼

Hidden Bullish Divergence will play?as mentioned during market
timings, 36.50 was important to
sustain. It could not and hit the
Lower Lock at 36.03
Next Support is around 34.50 - 34.62
Now it is Important to Sustain 36.50 - 36.70
on Weekly basis.
Monthly Support is around 35.
One +ve sign: Hidden bullish divergence has
also appeared.
