XAUUSD : ROAD TO 3K
GOOD LUCK ALL
**My trading strategy is not intended to be a signal. It's a process of learning about market structure and sharpening my trading my skills also for my trade journal**
Thanks a lot for your support
Supportandresitance

Gold can break support level and continue to declineHello traders, I want share with you my opinion about Gold. By observing the chart, we can see that some days ago price rebounded from the support line of the upward channel and rose to the 2550 support level, which soon broke it. After this, the price tried to grow and some time traded higher, after which it made a correction movement to the support line of the channel, which is located inside the support zone. Then price turned around and continued to rise to the current support level, which coincided with one more support zone, and when Gold reached this level, it at once broke it. Next, the price some time traded near this level inside the support area and a not long time ago rose to the resistance line of the upward channel. But soon, Gold rolled down and in a short time declined to support the area, so, I think that Gold can make a move up and then continue to decline next. Also, I expect that XAU will break the support level and fall to the support line of the channel, therefore I set my TP at 2615, which coincides with this line. Please share this idea with your friends and click Boost 🚀

EURJPY : TRADE IDEAWaiting for trendline to break.
**My trading strategy is not intended to be a signal. It's a process of learning about market structure and sharpening my trading my skills also for my trade journal**
Thanks a lot for your support

GBPJPY : TRADE IDEACup and handle chart pattern
I like to see 193.502 breakout from the previous high and then retracement before entering the market.
**My trading strategy is not intended to be a signal. It's a process of learning about market structure and sharpening my trading my skills also for my trade journal**
Thanks a lot for your support

XAUUSD SELL NOW!XAUUSD is now under strong selling pressure!
Support line :- 2683
Resistance line :-2630
ENTRY PRICE :- 2660 (BUY IMMEDIATELY)
TAKE PROFIT :- 2630
STOP LOSS :- 2675

Entry Types Simplified: The Essential Guide for New Traders!Key Structures and Formations:
Ascending Channel:
The price has been moving within this channel for a while. An ascending channel indicates an uptrend but also signals that the price is forming higher highs and higher lows, which can later break either direction.
Bull Flag:
A classic continuation pattern where after a strong bullish move (flagpole), the price consolidated before continuing upwards. This was a great entry point for traders watching for bullish momentum.
Failed Flag:
It appears there was a bull flag that failed to continue upwards and instead reversed direction. This type of failure is a strong indication for traders to reconsider their long positions or take partial profits. Often when a flag fails, it can lead to an aggressive move in the opposite direction.
Zones:
4HR, 1HR, 15M LQZ (Liquidity Zones):
These zones mark areas where liquidity is expected to be high, which means these are key levels to watch for price reactions.
The 4HR LQZ around 2,622 and the 1HR LQZ around 2,639 are critical areas for price retracement or reversals, particularly in a trending market.
Current Price Action:
The price is currently hovering near the 15M LQZ (2,655.443), which could act as a short-term support/resistance level. Watching how the price reacts to this zone will provide insight into the next move.
If the price continues to drop, the 1HR LQZ around 2,639 may provide support. If that fails, the next likely target is the 4HR LQZ near 2,622.
Recommendations Based on Confluence:
Check for Multi-Touch Confirmation: If the price interacts with the 4HR or 1HR LQZ zones multiple times and forms a base, this could serve as strong confirmation of a potential reversal or continuation.
Comprehensive Patterns: The failed flag within the larger ascending channel provides a great example of how smaller patterns (failed flag) can give clues about larger moves (channel break).
Follow the Trinity Rule: As per the Trinity Rule, wait for multiple confirmations across different structures before entering a trade. The liquidity zones and patterns within patterns provide a good basis for this.

HBAR ready to make a new Higher High?Is #HBARUSDT ready to make a higher high?
Here’s how this trade could unfold:
When the daily candle closes above the resistance line at 0.0596, we will have an official higher high.
The first target (wave 1) is around the 200 EMA at 0.0729.
After a retest of the resistance line (wave 2), which will then become the support line, the next target (wave 3) is between the 1 and 1.6 Fibonacci levels at 0.0929 - 0.1115.
We may then see a retracement (wave 4) to the 0.382 Fibonacci level at 0.0994.
The final leg (wave 5) will push to a new high above the top of wave 3.
REMARKS:
• It is important to emphasize that any information or content you encounter here is not intended as financial advice. We want to make it clear that we are not authorized or qualified to provide personalized investment advice. Our content, including ideas, opinions, views, predictions, forecasts, commentaries, suggestions, or stock picks, should be viewed strictly as informational, entertaining, or educational material.
• We emphasize that you should not construe the information provided here as personal investment advice or as a recommendation to take specific investment actions. It is crucial to conduct your own research, consider your individual financial circumstances, and consult with a qualified financial professional before making any investment decisions.
• While we aim to provide accurate and reliable information, we cannot guarantee the absence of errors or inaccuracies. Therefore, it is recommended to independently verify any information provided and exercise your own judgment when using it for decision-making purposes.
• Please be aware that any actions you take based on the information found here are done so at your own risk. We disclaim any liability for the consequences of your actions or decisions stemming from the information presented.
• Our intention is to provide helpful information that can contribute to your overall understanding and assist you in making better-informed decisions. However, it is essential to exercise caution, seek professional advice, and take responsibility for your investment choices.
Cheers and have fun.
° Be Patient – Don’t panic – Trade Emotionless.
° Never lose a winning trade.

XAUUSD : WAITINGThe price of gold is rising every ten years.
2000 ATH in 2011;
2020 ATH in 2074;
2023 ATH in 25XX
If level 2543-46 is rejected, I plan to long USD until the US election around 2413.75 & 2277.17, and then hunt for opportunities to buy gold.
**My trading strategy is not intended to be a signal. It's a process of learning about market structure and sharpening my trading my skills also for my trade journal**
Thanks a lot for your support

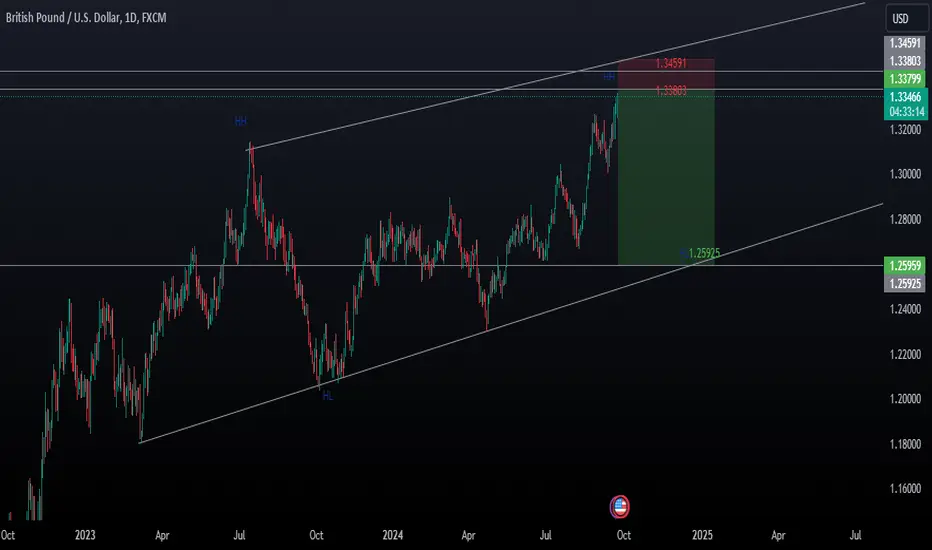
GBPUSD : SWING TRADE IDEA
I want to go long USD starting around 1.3380 and 1.34590, fundamentally similar to the eurusd fed cut last week.
1.25925 is my first aim.
**My trading strategy is not intended to be a signal. It's a process of learning about market structure and sharpening my trading my skills also for my trade journal**
Thanks a lot for your support
Bank of Baroda - Swing Opportunity~ Largest bank from Industrial state of Gujarat
~ P/E -> 6.49
~ EPS growth 5Years -> 54.6 %
~ Price to book value -> 1.03
~ Dividend Yield -> 3.15 %
~ ROE 5Yr -> 9.87 %
Strong Financial position with outstanding Financial performance.
Please note this idea is to spread awareness and NOT a buy recommendation.
Do your own research before making any financial commitments.

“Gold prices have been on a strong upward trajectory”In the U.S., the New York Fed Empire State manufacturing index for September rose from -4.7 to 11.5, indicating that the manufacturing sector has returned to growth territory. This data marked the highest level since April 2022. Despite this strong economic signal, the recovery in U.S. dollar assets remained limited. As a result, gold prices saw an upward movement, reaching the $2,585 level.
From a technical perspective, if prices remain consistently above the 2585 level, an increase to 2600 and then to 2650 could occur. On the downside, if the price falls below the 2570 support level, a pullback could extend to 2535 and then to 2482.

“The EUR/USD target is 1.11500”Last week, the ECB cut its interest rate by 25 basis points, in line with market expectations. ECB President Lagarde did not make any commitments for October but indicated that rates are on a downward path. As a result, pricing in favor of the Euro strengthened, with the EUR/USD pair reaching the 1.1130 level. As the new week began, the pair faced mild selling pressure but maintained prices above the 1.11 level.
From a technical perspective, if the upward trend continues and the 1.1150 resistance is broken, the next resistance levels to watch are 1.1190 and 1.1275. On the downside, if pricing drops below the 1.1115 level, 1.1045 and 1.10 could act as important support levels for further declines.

EURUSD showing downward momentum now!EURUSD showing downward momentum now!
SUPPORT point is at 1.06746
RESISTANCE point is at 1.11337
ENTRY :- 1.11229
TAKE PROFIT :- 1.09037
STOP LOSS :- 1.12708

EURUSD showing downward momentum now!EURUSD showing downward momentum now!
SUPPORT point is at 1.06746
RESISTANCE point is at 1.11337
ENTRY :- 1.11229
TAKE PROFIT :- 1.09037
STOP LOSS :- 1.12708

Bitcoin Fails to Break the 60K ThresholdThe dollar's accelerated losses due to Fed expectations had only a limited impact on Bitcoin's rise. U.S. spot Bitcoin ETFs recorded their highest daily inflows in nearly two months. However, as the U.S. elections approach and Kamala Harris performed better than Donald Trump in the latest TV debate, cryptocurrencies, led by Bitcoin, lost value.
From a technical perspective, if Bitcoin breaks below the 57,330 level, a further decline toward the 55,800 and then 54,000 support levels could occur. On the upside, if it surpasses the 60,000 resistance level, the 63,000 and then 65,000 resistance levels could be tested.

The Dollar Index Accelerates Its Decline!The dollar index has been losing strength recently, falling below the 100.50 level. Following the ECB's decision to cut interest rates, expectations for a rate cut by the Fed have also increased. According to money market pricing, there is a 51% probability that the Fed will cut interest rates by 25 basis points this week, and a 49% probability of a 50 basis point cut. This has pushed the dollar index below the 100.50 level.
Technically, if the index falls below the 100.45 level, the 100.30 and 100.00 levels can be considered support. However, if it recovers and moves above the 100.45 level, resistance can be observed at the 100.70 and 100.90 levels.

The key to starting a trade is support and resistance points
Hello, traders.
If you "Follow", you can always get new information quickly.
Please also click "Boost".
Have a nice day today.
-------------------------------------
As you study candles, you will learn about trend reversal sections.
Therefore, rather than learning the shapes or patterns of candles, when you study them, you will be able to see the support and resistance points and sections made up of the selling area and trend reversal sections in a big picture.
Therefore, rather than trying to memorize the shapes or arrangements of candles, it is important to see whether support and resistance points and sections are formed when such shapes, arrangements, and patterns appear.
The same goes for other studies related to charts.
-
As you study candles, you will find that what you have studied appears in the sections where candles are gathered.
These areas are drawn as horizontal lines to indicate support and resistance points.
However, objective information is needed to conduct trading on the horizontal lines drawn like this.
Otherwise, even the support and resistance points you drew will likely become useless lines if you conduct barrack trading because you don't trust them.
Be careful because your psychological state will interfere with analyzing the chart.
-
The easiest way to obtain this objective information is the Heikin Ashi chart and the Renko chart.
The Heikin Ashi chart and the Renko chart help you check the trend because they show fewer fakes and sweeps.
(Heikin Ashi chart)
(Renko chart)
Among these, you can immediately see that the Renko chart is a bit easier to find support and resistance points.
-
You can think of the points near the end of the blocks on the Renko chart as having strong support and resistance points.
Therefore, among the horizontal lines drawn on the chart above, the 2800.0 and 4000.0 points are the end points of three blocks, so they can be seen as strong support and resistance points.
If you change the Renko chart to a regular candle chart, you can clearly see that it will form support and resistance points or sections.
However, since the Renko chart changes the price in blocks, it is difficult to trade at this point.
Therefore, the Heikin Ashi chart or Renko chart is good to use when analyzing the chart, but it is difficult to trade.
-
To compensate for this, we created a horizontal line at the price position using indicators (StochRSI, OBV, CCI, RSI) that have been used for a long time.
The horizontal line connected to the current candle position plays the role of the current support and resistance point.
And, since the longer the horizontal line, the stronger the support and resistance role, you can see that it plays the role of support and resistance even if it is not connected to the current candle.
-
The support and resistance points drawn on the Heikin Ashi chart or Renko chart are difficult to use for trading, but you can easily check the support and resistance section by looking at only the 1D chart.
However, in order to display support and resistance points with a general candle chart, support and resistance points must be displayed on the 1M, 1W, and 1D charts.
And, the order of charts with strong support and resistance is 1M > 1W > 1D charts.
-
When you look at the 1M, 1W, and 1D charts using the HA-MS indicator, horizontal lines like the above are displayed.
You can display them by changing the line type or line thickness to make them easier to see and then proceed with trading.
----------------------------------------------------------------
The above content corresponds to the method of finding support and resistance points included in general chart-related books.
Of course, it is different from the explanation in the chart-related book, but I explained how to use indicators to more clearly indicate support and resistance points.
-
Even if you trade with the support and resistance points above, it will not work well when you actually trade.
This is because you are not familiar with the most important trading strategy in trading.
In conclusion, the most important thing is to create a trading strategy, rather than finding the support and resistance points explained above, looking at the trend line, or looking at indicators.
However, it is very difficult to create a trading strategy that fits your investment style from the beginning.
So, you should practice creating a trading strategy that suits you while trading based on the information of the objective chart.
In order to trade, you need to decide on the following three things:
1. Investment period
2. Investment size
3. Trading method and profit realization method
The above three things must be determined.
No. 1 and 2 are determined according to your investment style.
Therefore, it is recommended not to change No. 1 and 2 after you start trading.
3. Based on the information of the actual chart, the buy section, sell section, and stop loss point are determined.
In addition, the profit realization method can be determined according to the investment period.
The profit realization method is:
1. How to get cash profit
2. How to increase the coin (token) corresponding to the profit
There are methods 1 and 2 above.
-
In order to create a trading strategy, it is important to display all the information you want on the chart before starting the transaction.
If you do not, and then display lines on the chart after starting the transaction, psychological factors will be added and displayed, so the possibility of not trusting the lines drawn after starting the transaction increases.
To prevent this, it does not matter if you use the indicator added to the HA-MS indicator.
The reason is because it is objective information.
You should increase profits or reduce losses by adjusting the investment ratio while conducting the transaction using this objective information.
-
Have a good time.
Thank you.
--------------------------------------------------

SPY In-depth Technical AnalysisA detailed technical analysis with Key Levels of support and resistance, expectations on the price action and trend.
Do your analysis and research as well while trading with these 3 simple tricks.
Identify entry, get in the trade, get green, get out.
Rinse Lather Repeat. Stay positive and Strong

Chart Analysis: Establishing Trading Strategies
---------------------------------
Hello, traders.
If you "Follow", you can always get new information quickly.
Please click "Boost" as well.
Have a good day today.
-------------------------------------
When you start studying charts, the first thing you learn is about candles.
However, you start studying about the Open, Close, High, and Low of candles.
When you start studying about the Moving Average, you start to think that you understand the charts.
However, when you actually start trading with the Moving Average, you realize that nothing works properly.
So, you start studying other indicators.
-
The above is based on my experience. When you study various charts, you may think you know them, but when you actually start trading, you realize that they don't apply at all.
Where on earth did I go wrong?... What I learned after a long time is that I was wrong from the very beginning.
-
In other words, I realized that my subsequent chart studies were not done properly because I lacked understanding of candles.
When you start studying candles, you study candles of various shapes and patterns.
At this time, you should not be too obsessed with the names of candle shapes or patterns or the conditions that occur and try to memorize them.
It is important to read it repeatedly several times until you can grasp the concept of the arrangements formed by the combination of candle shapes or patterns, that is, the support and resistance points.
Eventually, when the candle shapes or patterns are combined, you can find the volume profile section formed around it, that is, the section where trading volume occurs.
By drawing and marking the support and resistance points you find in this way on 1M, 1W, and 1D charts, you can create a trading strategy on the charts you mainly trade.
That's all the experts in chart analysis say.
In the end, everything is about looking at the combination of candles that make up the chart, finding the corresponding support and resistance points, and trading according to your trading strategy.
A trading strategy is to create a response strategy at the corresponding support and resistance points based on the three things above:
1. Investment period
2. Investment size
3. Trading method and profit realization method
However, since most books do not include trading strategies, you will only learn about the timing of trading and closing of trading using various indicators.
Because of this, there are many cases where you cannot respond to the volatility that occurs after starting trading and end up losing money.
Even so, it is difficult to specifically define the contents of trading strategies.
This is because the investment period, investment size, and trading method are different depending on the individual's investment style.
Therefore, what I can tell you is that you need to set the buy, sell, and stop loss points according to the support and resistance points obtained through chart analysis and wait for a while.
Due to price volatility, you may not touch the buy, sell, and stop loss points or may move past them.
You should learn how to create a trading strategy by modifying the way you respond to these things according to your investment style.
-
One important thing here is that you should mark the support and resistance points in advance through chart analysis before starting trading.
Otherwise, if you start trading and then mark support and resistance points, psychological factors will come into play, which will likely lead to an unexpected transaction.
Don't forget this, and you should practice marking support and resistance points in advance before starting a transaction.
Also, you should avoid analyzing charts after listening to various articles, news, or community content.
The reason is that psychological factors can come into play.
-
I think trading is a response to the movement of prices that fluctuate in real time.
Therefore, waiting and determination are necessary.
If you wait too long or do not make a decision and pass it by, there is a high possibility that you will suffer losses or make little profit, so you need something to refer to when waiting or making a decision.
That is the support and resistance points I mentioned above.
-
However, support and resistance points alone do not solve everything.
Therefore, you should add trend lines and various indicators to ask for a method of responding to price fluctuations.
However, since the trend line is formed by a diagonal line, there is a lack of countermeasure strategies using the trend line.
Therefore, the trend line is used to literally find out what the current trend is.
-
Therefore, when it deviates from the trend line, the movement at the support and resistance points is checked and the corresponding response is made.
When trading with a chart consisting of the above two support and resistance points or only the trend line, there are often cases where the transaction cannot be properly conducted due to fakes or sweeps.
Therefore, in order to counter these fakes or sweeps, various indicators are added to the chart.
The most commonly used of these is the price moving average.
Even if you add the price moving average, you realize that it is a curve, just like the trend line, and is therefore not suitable for countermeasure strategies.
So, the price moving average is also used to check the trend, just like the trend line.
-
In that regard, the indicator I recommend is the StochRSI indicator.
The default settings for the StochRSI indicator are 14, 7, 3, 3 (RSI, Stoch, K, D).
The value of the Signal line (EMA) of the StochRSI indicator is 7.
If the StochRSI indicator rises in the oversold zone and maintains the state of StochRSI > StochRSI EMA, it is a buying period.
On the other hand, if the StochRSI indicator falls in the overbought zone and maintains the state of StochRSI < StochRSI EMA, it is a selling period.
However, you should trade depending on whether there is support or resistance at the support and resistance points formed at that location.
Even if there is movement in the StochRSI indicator, it is recommended not to trade if you do not have support and resistance points drawn on the 1M, 1W, and 1D charts.
The reason is that you may feel psychologically anxious, so there is a possibility that the trade will proceed incorrectly.
-
If you can trade with only what I mentioned above and make an average profit, it is because you have established a trading strategy according to your investment style.
-
We need objective information to establish a trading strategy according to your investment style.
We think that this is the only way to minimize the psychological factors that arise when starting a trade.
If you can add various indicators to the chart to obtain objective information and receive support and resistance point information according to them, you can create a trading strategy according to them at any time.
To do this, we used the StochRSI, OBV, CCI, and RSI indicators to display support and resistance points on the price candle part.
And, we added the StochRSI and BW indicators as auxiliary indicators.
The StochRSI indicator added as an auxiliary indicator is not the StochRSI indicator provided by default, but an indicator with a modified formula, so you can share the chart and use it or copy and paste the TS-BW UP indicator to your own chart and use it.
There is no problem using the basic StochRSI indicator.
However, there is a slight difference from what I said, so there may be a slight problem in understanding.
-
As above, since the support and resistance points of the 1M, 1W, and 1D charts are drawn on the chart to create a trading strategy, my chart is very confusing and not easy to understand when you first look at it.
And, since there are many indicators that I have not explained, it may be even more difficult to see the chart.
Therefore, to resolve the difficult parts, share the chart, hide the indicators added to the chart, and activate them one by one while looking at them, and you will be able to understand the chart.
If you share the chart, you can use it normally, so you can check the chart from various angles.
-
Have a good time.
Thank you.
--------------------------------------------------

SPY Daily Chart Analysis: Approaching Key Resistance at $564Looking at the SPY daily chart, the price has recovered well from its recent pullback and is now approaching a significant resistance level around $564.
Key Levels:
Resistance at $564: The green dashed line highlights this key resistance zone. SPY has tested this level multiple times, and we’re nearing another test. Each time the price approached this zone, it faced rejection, making it a critical level to break for continued upside.
Support at $552.49: This is the immediate support zone, and it’s holding strong. Any pullback towards this level would be a natural correction but as long as we stay above it, the bulls remain in control.
What I Expect:
Potential Breakout: If SPY manages to break and hold above $564, we could see a significant rally, possibly testing higher resistance levels around $570. However, failure to break this resistance might lead to another pullback, with $552 acting as the first major support.
Sideways Action:
There’s also the chance that SPY could consolidate in the $552 - $564 range before making a decisive move in either direction. This would create a buildup of momentum before the next big breakout or breakdown.
Final Thoughts:
We’re at a critical juncture. If the bulls can push through $564, we might see a continuation of the larger uptrend. However, resistance here has been strong, so I’ll be watching closely for either a breakout or a rejection at this level. Stay cautious and watch for clear confirmation before making your move.

Ready for ALL TIME HIGH Again...NSE:HEROMOTOCO trade at 5800 level. Stock trade in Uptrend Channel, and ready for cross its own all time high level, So you can watch for an upside move...

READY FOR ROUNDING BOTTOM BRRAKOUT...NSE:ABFRL trade at 325 level. Stock chart shows that its make a Rounding Bottom pattern on weekly time frame and ready for give a breakout. So You can watch for an Upside Move at 400-450 level...

Nasdaq Thoughts 12-Sept-2024Kindly see my Nasdaq thoughts for today. These videos are aimed at making you compare charts with mine if you are a price acton trader and use my thoughts to improve your skill. They are not meant as signals even if they seem like they are. I want you to learn and be great
