Ethereum Name Service ENS Coin Price Prediction🔥 Price on the 4H chart might come at these support area and we might get a potential bounce🔥
Potential bounce areas for Buying 18.40 and 15.61
👉 Follow me for More Real Time Opportunities.
Share your Thoughts if you have any?
Supportandresitance

Ethereum Classic ETC Coin Price Prediction🔥 Price on the DAILY chart might come at these support area and we might get a potential bounce🔥
Potential bounce areas for Buying 27.30 and 25.22
👉 Follow me for More Real Time Opportunities.
Share your Thoughts if you have any?

LINK/USDT 4H ChartI invite you to review the LINK chart taking into account the four-hour interval. Here we will start by defining, using the blue lines, the upward trend channel from which the price broke out at the bottom, but we can see a quick return and a fight to return to the channel. At this point, it is also worth marking the local downward trend line in yellow, which the price has broken with an upward movement.
Looking at the current situation, we will spread the Fib Retracement grid, thanks to which we can confirm the place of return to the channel, as the first significant resistance at the level of $14.28, then we have a visible second resistance at the level of $15.57, and then located at the upper border of the upward trend channel , a strong resistance zone from $16.50 to $17.67.
Please look at the EMA Cross 10 and 30 indicator as we can see the red ema cross 10 line attempting to cross the green ema cross 30, potentially indicating a return to the local uptrend. However, it is worth being careful whether this is just a false breakout and the price will start to reverse.
In such a situation, we will unfold the fib retracement sheet again to determine the supports. And here you can see support at the level of $13.79, and then it is worth marking the support zone from $12.74 to $12.19, if this zone is broken, we can see the price return to around $10.59.
Now it is worth switching to the RSI indicator, which shows an upward trend line that gives rise on the chart, with room for new movements, but after switching to the STOCh indicator, we see that a downward trend has begun, which may, however, result in a price correction.

SOL/USDT 4H Chart ReviewI invite you to review the SOL chart in the USDT pair. We will start by defining the yellow line as an upward trend line from which the price has broken out at the bottom, creating an ongoing downward trend channel in which we are approaching the upper border.
Going further, we can move on to marking support areas when we start a larger correction. And here the first support is at the price of $89.78, but further we can define a very strong support zone from $80 to $67.
Looking the other way, once again after unfolding the fib retracement saitka, we see that the price has reached the resistance level at $100.73, only when it overcomes it and exits the upper channel, will it move towards the resistance zone from $118 to $126, which is held price before moving towards $151.
Please look at the RSI indicator, which has returned to the middle of the range, making it difficult to indicate the direction, while the STOCH indicator shows a downward movement with room for the price to recover more.

ETH/USDT 4HInterval ChartI invite you to review the ETH pair to USDT chart by looking at the analysis performed in the last video. And here we can see that the price has broken through the designated resistances, and is currently struggling to stay above the resistance zone from $2,353 to $2,430, only when it positively tests it will it be able to make another upward move.
Now we will move on to unfolding the Fib Retracement grid, thanks to which we will move the previously determined support areas, and here we can see a clear support at the level of $2,278, and then a support zone from $2,228 to $2,166.
However, if the price maintains the previous resistance zone, we will be able to see an attempt to increase towards the next very strong resistance level at $2,541.
Moreover, in the current movement we can see how a local upward trend channel is forming, which we can define with the help of blue lines.
Now we will again pay attention to the RSI indicator, which shows a visible recovery, but there is still room to the upper limit, which may result in an increase in price, in this case, however, the STOCH indicator shows a movement above the upper limit, which could affect the current recovery, but it is clear that there is a lot room for further recovery of the indicator.

BTC Long-Term analysis 4HHello everyone, I invite you to check the current situation on BTC in the USDT pair, taking into account the four-hour interval. First, we will use blue lines to mark the local upward trend channel in which the BTC price is struggling to stay in the channel. At this point, however, it is worth emphasizing that yesterday's dynamic price movements were caused by false information about the SEC's approval of the Spot ETF for BTC. The announcement was made on the X platform through a hacker hacking the SEC's official account.
Next, it is worth turning on the EMA Cross 10 and 30 indicator, which shows that the upward trend is still maintained, but it is worth keeping the red line in mind, because when it crosses the green line from above, it will confirm a potential return to the downward trend.
Now we can move on to marking the support areas, and for this purpose we will spread the trend based fib extension saitke, thanks to which we can see that the current decline has been maintained by the support at the level of $44,701, and then it is worth defining the support zone from $43,814 to $42,665, but if the zone is once broken, we can see a decline to the support level of $39,422.
Looking the other way, using a grid in a similar way, we can determine places of potential resistance that can effectively reject the price. And here we can see the first resistance that rejected the increases at $47,137, then we have visible resistance around $49,000, and then we can mark the zone from $50,119 to $51,702, which is before an attempt at further increases to the new ATH.
Please pay attention to the RSI indicator because you can see that it behaves similarly to the STOCH indicator - both of them show a recovery with room for a potentially larger recovery that could occur in the event of a possible decision regarding spot etf btc.

SKALE SKL Coin Price Prediction🔥 Price on the 4H chart might come at these support area and we might get a potential bounce🔥
Potential bounce areas for Buying 0.06882 and 0.05814
👉 Follow me for More Real Time Opportunities.
Share your Thoughts if you have any?

Request REQ Coin Price Prediction🔥 Price on the 4H chart might come at these support area and we might get a potential bounce🔥
Potential bounce areas for Buying 0.0952 and 0.0814
👉 Follow me for More Real Time Opportunities.
Share your Thoughts if you have any?

ETH/USDT 4H Interval ChartETH paired to USDT on a 4-hour time frame. As you can see, the price has broken out of the local downtrend line and is currently staying above the uptrend line.
Let's start by determining the support line and as you can see, the first support is $2,250, the second support is at $2,182, and then there is a strong support zone from $2,133 to $2,072.
Looking the other way, we can see resistance again at $2,292, and then we have a strong resistance zone from $2,353 to $2,430.
When we look at the RSI indicator, we see a rebound with room for a larger decline, and a similar situation can be seen on the STOCH indicator.


Marlin POND Coin Price Prediction🔥 Price on the 4H chart might come at these support area and we might get a potential bounce🔥
Potential bounce areas for Buying 0.01430 and 0.01287
👉 Follow me for More Real Time Opportunities.
Share your Thoughts if you have any?

MATIC/USDT 4HIntervalI invite you to review the chart of MATIC in pair with USDT. First, we will use the blue lines to mark the upward trend channel in which the price is fighting at the lower border.
Let's move on to determining the support, and for this purpose we will unfold the trend based fib extension grid, thanks to which we can see a strong support at the level of $0.76, however, if the support is broken and the price leaves the current channel lower, it may result in a price drop close to the height of the channel, which could bring the price to a very strong support zone from $0.61 to $0.53.
Looking the other way, we see that the level of $0.86 has effectively reduced the price, only when we go higher, the next resistance is at the level of $0.95, and then we have a visible strong resistance zone from $1.01 to $1.08. At this point, it is worth defining the local downtrend line, which confirms the $0.95 level, as an important resistance.
It is worth looking at the RSI indicator, which shows a movement in the lower part of the range, which gives room for possible increases, and what is more, the situation looks similar on the STOCH indicator, but it is worth remembering that we are still in a downward trend and a lot depends on the behavior of the BTC price.

Navigating Support and Resistance with Renko ChartsToday we continue our deep dive into support and resistance levels and explore how traders can effectively utilize Renko charts and Donchian channels to identify these price zones. Renko charts, known for their simplicity and ability to filter out market noise, provide a unique perspective on price movement. We'll discuss how Renko charts work and demonstrate their effectiveness in pinpointing support and resistance levels with the help of Donchian channels. Donchian channels are a popular technical analysis tool that maps out the highest highs and lowest lows over a given period.
By combining the insights from Renko charts and Donchian channels, traders gain a comprehensive approach to detecting key support and resistance areas in any market condition. Whether you're a novice trader or an experienced professional, we hope this video aids anyone seeking to enhance their ability to define support and resistance for any asset.

ETH/USDT 1HInterval ChartHello everyone, I invite you to check the situation of ETH in pair with USDT, also on a one-hour interval. First, we can use the dark blue lines to mark the upward trend channel, from which we can see how the price came out from the bottom and created a local downward trend channel here.
Now let's move on to marking the support places. We will use the Fib Retracement tool to mark supports, and as you can see, the first support is at the price of $2174, then there is a support zone from $2143 to $2101, which keeps the price from falling to the support level of $1981.
Looking the other way, we can similarly mark places where the price should encounter resistance on the way up. And here we have the first very strong resistance at the price of $2,314, which is at the so-called golden point of 0.618 Fib, and then there is a very strong resistance zone from $2,371 to $2,446.
When we turn on EMA Cross 50 and 200, we can see that they indicate the continuation of the local downtrend. Looking at the RSI indicator, there is still room for a price increase, but the potential is limited by the STOCH indicator, which clearly shows overheating, which resulted in a slight recovery and there is still room for the price to go lower.

BTC/USDT 1HInterval Chart ReviewHello everyone, I invite you to review the current situation on BTC in the USDT pair, taking into account the one-hour interval. We will start by defining the upward trend channel with the blue lines in which we are approaching the upper limit, and what is more, we can determine the local downward trend lines from which the price came out on top.
Now we can move on to marking support areas in case the price starts to reverse. And here we can see that the support at the level of $43,388 effectively maintains the price, then we have a second support at the level of $42,171, and when the price goes lower, the support zone from $41,299 to $40,199 protects us from very large declines.
Looking the other way, we can determine resistance locations in a similar way using the trend based fib extension tool. First, we will mark the significant resistance at the level of $44,887, with the golden fib point of 0.618, which the price is struggling to maintain. If the positive level is maintained, we may see an attempt to attack towards a very strong resistance zone from $45,557 to $46,411, which keeps the price from rising to around $48,000.
Please pay attention to the RSI indicator, because despite the dynamic growth there is still room for an upward movement, the STOCH indicator shows a clear break above the upper limit, which resulted in a slight rebound, but it is worth being careful because the price may go lower.

Yield Guild Games YGG Coin Price Prediction🔥 Price on the 4H chart might come at these support area and we might get a potential bounce🔥
Potential bounce areas for Buying 0.4591 and 0.4184
👉 Follow me for More Real Time Opportunities.
Share your Thoughts if you have any?

Stacks STX Coin Price Prediction🔥 Price on the 4H chart might come at these support area and we might get a potential bounce🔥
Potential bounce areas for Buying 1.7499 and 1.5043
👉 Follow me for More Real Time Opportunities.
Share your Thoughts if you have any?

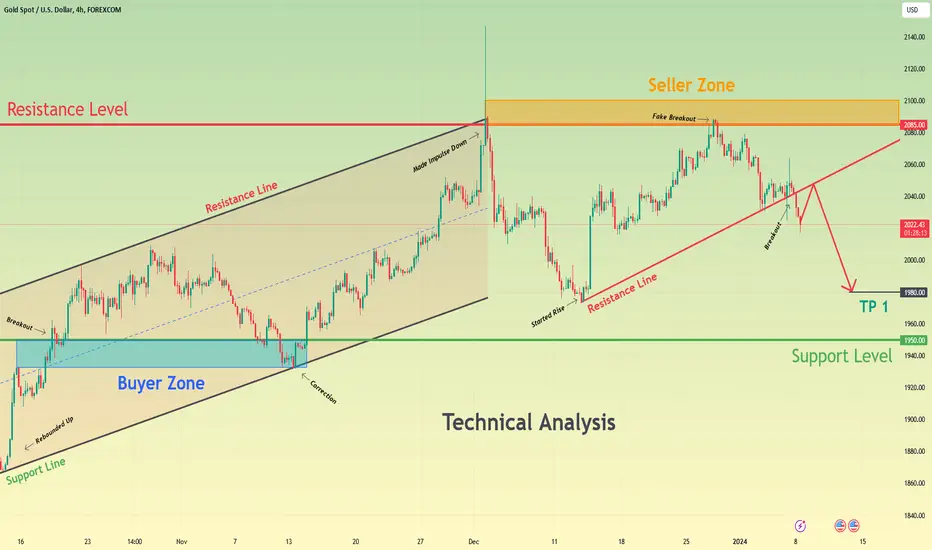
Gold can make retest of resistance line and continue to declineHello traders, I want share with you my opinion about Gold. Observing the chart, we can see that the price a few days ago started to trades in an upward channel, where it first rebounded from the support line and made impulse up to the resistance line, breaking the support level, which coincided with the buyer zone. After this movement, Gold made a correction to the buyer zone, after which it continued to move up in the channel to the 2085 resistance level. When the price reached this level, it rebounded and made a strong downward impulse to support line, thereby exiting from the channel. After this movement, XAU started to rise near this line, and in a short time, it rose to the resistance level again and even made a fake breakout to the seller zone, after which the price rebounded down to the support line. Also recently, Gold broke this line, and at the moment it trades below. In my opinion, Gold can make a retest of the resistance line and then continue to decline to the support level. For this case, I set my target at the 1980 points, which coincided near with 1950 support level. Please share this idea with your friends and click Boost 🚀
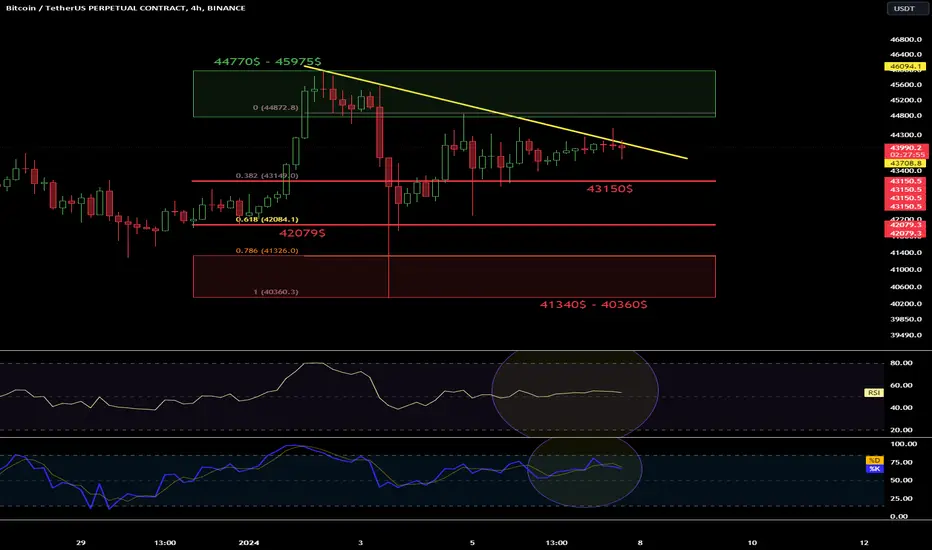
BTC/USDT 4HInterval ChartHello everyone, let's take a look at the BTC to USDT chart on a 4-hour time frame. As you can see, the price is fighting against the local downtrend line.
However, when we unfold the fib retracement grid, we can see that the price is being rejected by a strong resistance zone from $44,770 to $45,957, which is keeping the price from moving towards $48,000.
Looking the other way, there is support at $43,150, second at $42,079, and then a strong support zone from $41,340 to $40,360.
On the RSI indicator, we are moving in the upper part of the range, while the STOCH indicator is in the upper part at the upper limit, which may translate into a price drop.
GMT Coin Price Prediction🔥 Price on the 4H chart might come at these support area and we might get a potential bounce🔥
Potential bounce areas for Buying 0.3757 and 0.3183
👉 Follow me for More Real Time Opportunities.
Share your Thoughts if you have any?

Review and plan for 8th January 2024Nifty future and banknifty future analysis and intraday plan in kannada.
This video is for information/education purpose only. you are 100% responsible for any actions you take by reading/viewing this post.
please consult your financial advisor before taking any action.
----Vinaykumar hiremath, CMT

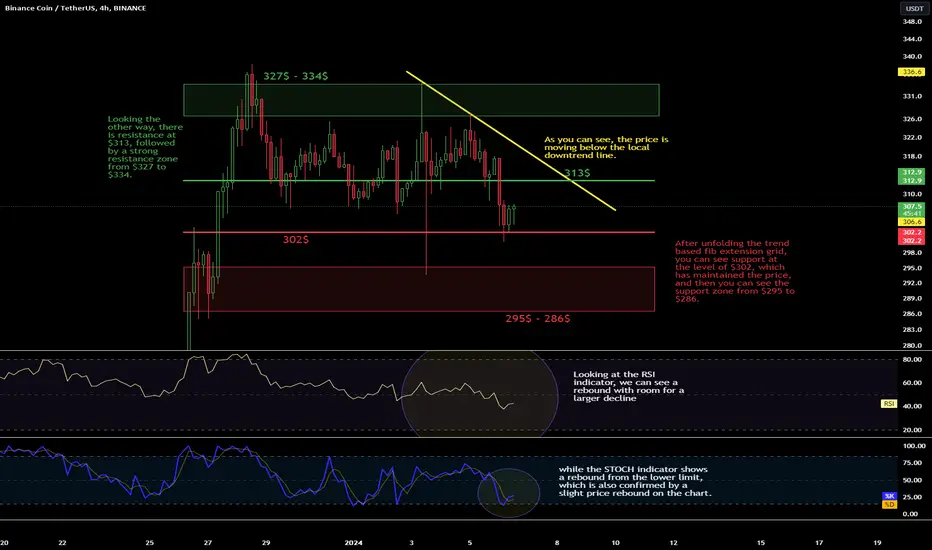
BNB/USDT 4HInterval Chart support and resistanceHello everyone, let's take a look at the BNB to USDT chart on a four-hour time frame. As you can see, the price is moving below the local downtrend line.
After unfolding the trend based fib extension grid, you can see support at the level of $302, which has maintained the price, and then you can see the support zone from $295 to $286.
Looking the other way, there is resistance at $313, followed by a strong resistance zone from $327 to $334.
Looking at the RSI indicator, we can see a rebound with room for a larger decline, while the STOCH indicator shows a rebound from the lower limit, which is also confirmed by a slight price rebound on the chart.
Powerledger POWR Coin Price Prediction🔥 Price on the 4H chart might come at these support area and we might get a potential bounce🔥
Potential bounce areas for Buying 0.4581 and 0.4171
👉 Follow me for More Real Time Opportunities.
Share your Thoughts if you have any?
