AMD to Retest SupportAMD has been in a descending price channel since November of 2024 with clear support and resistance established. On Monday we saw an attempt to breakout however it was rejected at the establish resistance line. Given the rejection and the significant drop that followed I think we will likely see AMD drop to slightly below $80 in the short term and retest the established support line.
Supportandresitance

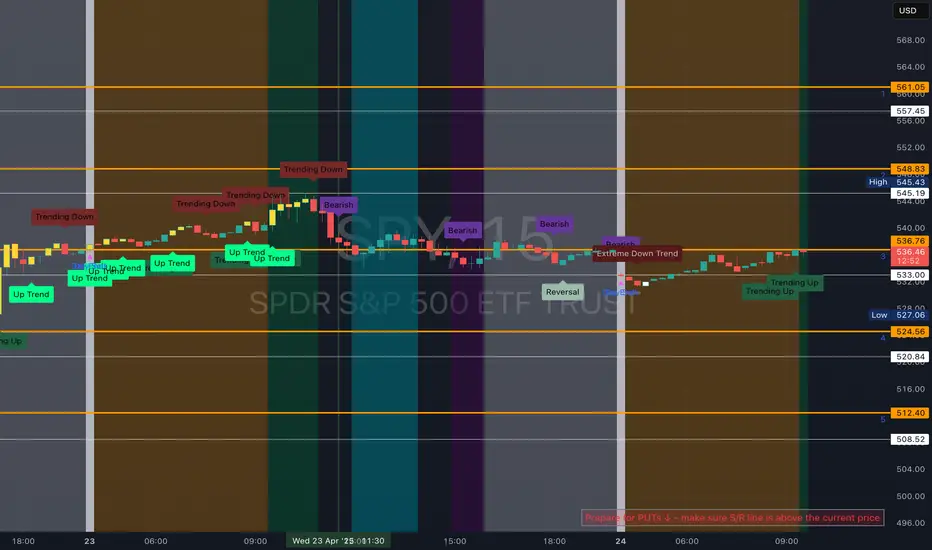
SPY - support & resistant areas for today April 24 2025These are Support and Resistance lines for today, April 24, 2025, and will not be valid for the next day. Mark these in your chart by clicking grab this below.
Yellow Lines: Heavily S/R areas, price action will start when closing in on these.
White Lines: Are SL, TP or Mid Level Support and Resistance Areas, these are traded if consolidation take place on them.
BTC Next Move - Bulltrap or Take-off?In todays overview, we will discuss the price action of BTC and what we could expect in the short-term.
What will we discuss?
- Bitcoin approaching key resistance
- Daily trendline break - But no higher high yet
- Stochastic RSI overbought on the daily timeframe
- Defining the daily range
- Downside targets within the range
- Final thoughts
-----------------------------------------------------------------------------------------------
Bitcoin Approaching Key Resistance
Bitcoin is now pressing up against a significant resistance zone in the $88,000 to $89,000 range. This area is dense with liquidity, and many stop-loss orders have likely accumulated just above the previous local wick. It's not uncommon in these scenarios for price action to briefly push higher, grabbing that liquidity and triggering those stops, before reversing direction. A short-term stop run followed by a move to the downside wouldn’t be surprising and would align with typical market behavior in these conditions.
-----------------------------------------------------------------------------------------------
Daily Trendline Break – But No Higher High Yet
On the daily chart, BTC has managed to break above a descending trendline that had previously capped price action. While that initial breakout was a promising sign for bulls, price has since been consolidating outside the trendline without yet printing a higher high. Until that happens, the overall market structure remains bearish on this timeframe. A confirmed higher high would be needed to shift the daily trend back to bullish.
-----------------------------------------------------------------------------------------------
Stochastic RSI Overbought on Daily Timeframe
The Stochastic RSI on the daily chart has been in overbought territory for more than a week, which is typically unsustainable for long periods. This kind of prolonged overbought reading often precedes a pullback. The key question is not if a correction will happen, but how deep it will go. Ideally for bulls, a minor pullback followed by a higher high would be constructive and could signal the beginning of a stronger upward move. But until then, caution is warranted.
-----------------------------------------------------------------------------------------------
Defining the Daily Range
Currently, Bitcoin is trading within a well-defined range between $75,000 and $88,000. This is the key zone that traders should be paying attention to. As long as price remains within this bracket, we are in a ranging market, not a trending one.
-----------------------------------------------------------------------------------------------
Downside Targets Within the Range
If price does get rejected at the resistance zone, downside targets to watch include support levels at $84,000, $80,000, and $75,000. These levels could provide bounce opportunities within the range. There’s no need to speculate on price moving significantly below $75,000 unless that level is cleanly broken. Similarly, upside targets beyond $89,000 shouldn’t be considered until we see a proper breakout and continuation.
-----------------------------------------------------------------------------------------------
Final Thoughts
We should treat the current market as range-bound until proven otherwise. That means respecting the range: moves into resistance zones near FWB:88K – GETTEX:89K are potential selling opportunities, while dips into support around $75K–$80K may be areas to look for buying setups. Until either support or resistance gives way, expect this chop to continue, and trade accordingly.
-----------------------------------------------------------------------------------------------
Thanks for your support.
- Make sure to follow me so you don't miss out on the next analysis!
- Drop a like and leave a comment!

XAUUSD buy opportunity targeting 3400XAUUSD buy opportunity targeting 3400
1. A golden opportunity emerges as XAUUSD eyes a bullish breakout.
2. Current market dynamics strongly favor long positions in gold.
3. Investor sentiment shifts amid global economic uncertainties.
4. Safe-haven demand fuels upward momentum in precious metals.
5. Technical indicators signal strong support and bullish continuation.
6. The 3400 target aligns with historical resistance and Fibonacci extensions.
7. Central bank policies and inflation concerns bolster gold's appeal.
8. Volatility in fiat currencies drives capital toward tangible assets.
9. Momentum traders are positioning early ahead of the breakout.
10. A strategic buy now could yield significant returns as gold ascends.

LEAP: GBPUSD Week 17 Swing Zone/LevelsLast week saw a good pinch on market pips. Aim to continue as always.
Price swing levels are set; either a or b, price action directs.
Levels/zones are calculated based on previous week H/L

XAUUSD TRADE IDEAhi all
this my trade plan until end of this month
good luck
**My trading strategy is not intended to be a signal. It's a process of learning about market structure and sharpening my trading my skills also for my trade journal**
Thanks a lot for your support

US500 BULLISH SYMMETRICAL TRIANGLEhi
Fundamental view
The **US500 index** dropped due to several key factors affecting the U.S. stock market:
📉 **Tech Stock Decline** – Technology stocks faced heavy pressure, especially after **Nvidia** plunged **6.9%** due to U.S. restrictions on AI chip exports to China. Other stocks like **AMD (-7.3%)** and **Micron Technology (-2.4%)** also fell.
💰 **Federal Reserve Uncertainty** – Remarks from **Fed Chair Jerome Powell** raised concerns in the market. Powell warned that new tariffs could trigger higher inflation and slow economic growth, making investors uncertain about interest rate policies.
🛍️ **Surge in Retail Sales** – Retail sales jumped **1.4%** in March as consumers rushed to buy before new tariffs took effect. This highlights economic uncertainty, pushing investors to sell their stocks.
Overall, a mix of trade tensions, uncertain monetary policy, and a tech stock sell-off caused the **US500 index to drop 120.93 points (-2.24%)** on **April 16, 2025**.
Technical view
Yes, the **bullish symmetrical triangle** pattern is often a strong signal for upward price movement. When the price moves within this pattern, it usually indicates a **tightening volatility** before a **breakout**, which can present a good market entry opportunity.
🔍 **Breakout Confirmation**
1️⃣ Increased trading volume when price breaks above the **upper trendline**.
2️⃣ A closing candle above the **triangle resistance** for a valid signal.
3️⃣ Price targets can be measured using the pattern’s initial height as a projection.
📈 **Potential Price Movement**
If the breakout happens, the price could surge toward the next **resistance level**. However, if the breakout fails and price moves below support, the pattern could turn **bearish**.
Warren Buffett famously said, “Be greedy when others are fearful.”
good luck
**My trading strategy is not intended to be a signal. It's a process of learning about market structure and sharpening my trading my skills also for my trade journal**
Thanks a lot for your support

BTC POTENTIAL TRIPLE TOP PATTERNhi
From the previous chart, the price successfully broke through the upper trendline and started to rise. This could indicate that bullish momentum is taking over. Waiting for the price to break the upper trendline is a solid strategy for confirming bullish momentum. However, there is a potential triple top pattern forming, which could indicate that the price may face rejection at a key resistance level 86056.35
If the triple top pattern becomes more apparent and the price fails to break above resistance, it could signal the start of a bearish move. In this scenario, trading volume and price action around the resistance zone are crucial to observe. If volume declines and selling pressure increases, the price may drop further.
good luck
**My trading strategy is not intended to be a signal. It's a process of learning about market structure and sharpening my trading my skills also for my trade journal**
Thanks a lot for your support

GBPUSD TRADE IDEAhi all
this my trade plan until end of this month
good luck
**My trading strategy is not intended to be a signal. It's a process of learning about market structure and sharpening my trading my skills also for my trade journal**
Thanks a lot for your support

BTC TRADE IDEAhi all
Potential Triple Top Pattern
good luck
**My trading strategy is not intended to be a signal. It's a process of learning about market structure and sharpening my trading my skills also for my trade journal**
Thanks a lot for your support

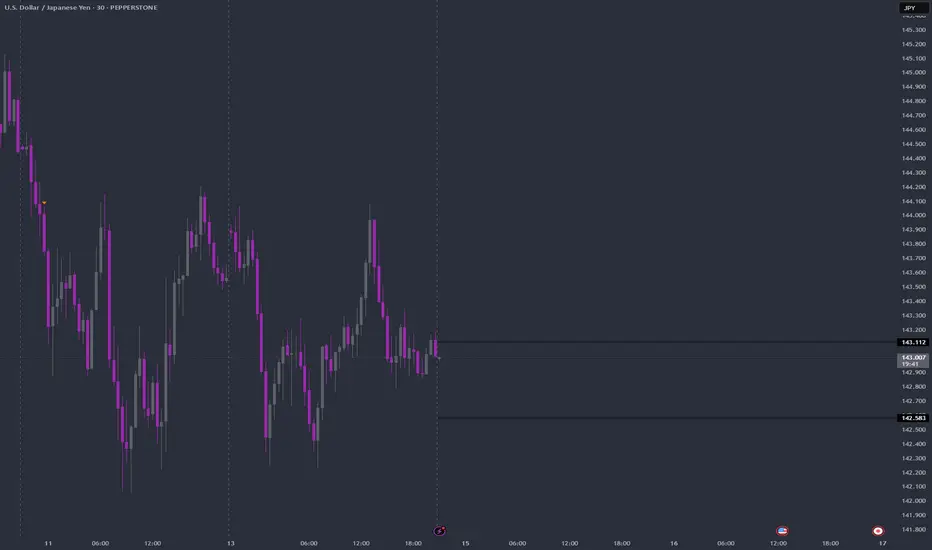
18-04-25 USDJPY Pivot LevelSimple and yet effective. Price did retrace from upper pivot level yesterday.
Today the upper trend should continue with bounce off lower pivot of 142.194, though most banks are on holiday

16-04-25 USDJPY Pivot Levela or b?. Most Likely a.
USDJPY in a slide.
These levels are my take on predetermined values by Market based on previous day High and Low.
As always price action determines trades

14-04-25 USDJPY Pivot LevelHi team,
USDJPY pivot levels are set.
Watch out for break or bounce at these levels
Macro resistance became support BTCUSD 4hBTC 4h broke through the long term resistance. Has already retested and is currently on the way up. This line is now support.
Will it break through the second long term support line which became resistance or will we go down again? Time will tell.

SPY Trade Review – Potential Pop and Flop SetupI’m tracking a potential pop and flop scenario forming on SPY. There’s a setup for a possible 5.5% move higher, followed by the opportunity for a larger short of up to 15% toward final downside targets.
SPY and its key influencers, including the Magnificent Seven , are currently rebounding off significant support levels. This could allow for continued upside before running into major resistance.
As highlighted in the chart, we may see a further push higher of approximately 5.5% , taking us into the weekly/daily high support lost zone at $564 . If this level acts as firm resistance and price reverses, a break below $549.83 (our trigger for adding short exposure) could lead to a significant selloff.
Downside targets include:
- Target 1: $502
- Target 2: $476.30 (a potential new local low)
A daily or weekly close above $564.52 would invalidate this short setup.
This is a high time frame setup , but I’ve shown it on the 4-hour chart for greater clarity. Now we wait and see!


BNB Bulls Must Defend This LevelBNB is currently trading near a key support and resistance zone, a historically significant area that has acted as both supply and demand over the past few years. After reaching its all-time high (ATH) near $793, price has been gradually correcting, and is now approaching a critical point.
The 50-week EMA (Exponential Moving Average) is acting as dynamic support, and so far has played a strong role in providing bounce zones during corrections. This EMA is currently being tested once again, and price action around it will be crucial.
Just below this lies a major horizontal support zone around $415–$430, which previously served as a breakout base in 2023. If this area holds, BNB could see a rebound attempt.

Solana’s Critical Support at $120 - Will It Hold or Break?Solana has been respecting its $120 support level for over a year, consistently bouncing back every time it tested this zone. However, the price is now once again hovering around this crucial level after a small bounce a couple of weeks ago. The key question remains: will Solana hold this support and rally again, or is a major breakdown coming?
Weakening Support: A Bearish Signal?
When a price level is tested repeatedly, it often weakens as buyers at that level get exhausted. The most recent bounce from $120 was notably weak, indicating that buying pressure might be fading. This could be an early warning sign that sellers are gaining control, increasing the probability of a breakdown.
The $75 Scenario: What If Support Fails?
If Solana fails to hold $120, the next major support level sits around $75—a price zone where significant demand previously emerged. A breakdown could trigger a sharp move lower as stop-losses get triggered and bearish momentum accelerates.
Key Factors to Watch:
• Volume & Strength of the Current Test – Is buying volume picking up, or are sellers in control?
• Market Sentiment & Macro Trends – Broader crypto market trends, Bitcoin’s movement, and macroeconomic factors could influence Solana’s direction.
• False Breakouts & Traps – Sometimes, a brief break below support is a shakeout before a strong reversal. A reclaim of $120 after a breakdown could signal a bullish trap for shorts.
Final Thoughts
While $120 has been a strong floor for Solana, repeated tests make it more fragile. If buyers fail to step in with conviction, a drop toward $75 becomes a real possibility. However, if bulls defend this level strongly, we could see another bounce, potentially setting up a reversal.
Thanks for your support.
- Make sure to follow me so you don't miss out on the next analysis!
- Drop a like and leave a comment!

Gold at the Edge! Rebound or Breakdown?Hi Traders! 🚀 XAU/USD is testing a key trendline support—will it bounce or break?
🔹 Scenarios:
📈 Buy if it breaks above $3,010, with a stop loss at $3,008 and targets at $3,020 and $3,057.
📉 Sell if it breaks below $3,008, with a stop loss at $3,012 and targets at $3,000 and $2,985.
📊 RSI near oversold—potential bounce ahead! Keep an eye on the price action.
📢 Stay alert to economic news! High-impact events could bring volatility.
🔥 Smash that like button and show some energy! Let’s trade like pros! 🚀
⚠️ Disclaimer: This analysis is for educational purposes only and does not constitute financial advice. Trade at your own risk.

GBPUSD Week 13 Swing Zone/LevelsYour next trade could be the beginning of your success in Forex.
We’ve been performing exceptionally well so far, identifying key swing levels as always.
- Stop Loss (SL): Set between 10-15 pips from the 5-minute candle entry.
- Dynamic Take Profit (DTP): Adjusted based on price reaction to swing levels.
Let’s capitalize on the momentum!

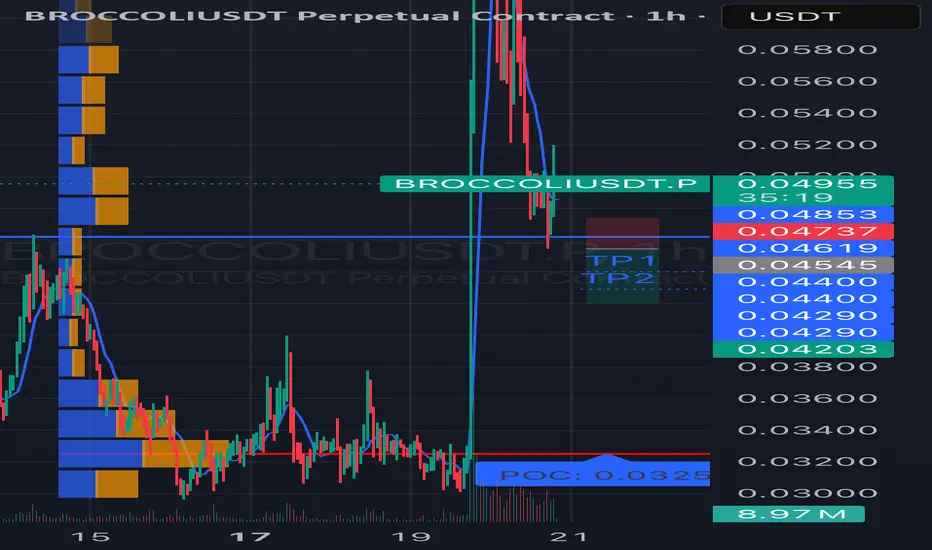
#BROCCOLIUSDT is showing bearish potential SHORT BYBIT:BROCCOLIUSDT.P from $0.04545
🛡 Stop Loss: $0.04737
🕒 Timeframe: 1H
⚡️ Overview:
➡️ BYBIT:BROCCOLIUSDT.P is showing bearish momentum on the 1-hour timeframe after a significant drop from $0.06000 to the current consolidation zone of $0.4203–$0.4885.
➡️ The price recently tested the $0.04545 level (a possible retest of a broken support, now acting as resistance), which could serve as an entry point for a short.
➡️ The volume profile on the left shows strong buyer interest at $0.0325 (POC), which acts as a key support level. However, the lack of significant buying volume at current levels suggests potential for further downside.
➡️ The price structure remains bearish: lower highs and lows are forming after the drop.
➡️ The RSI (14) indicator on the 1H timeframe is presumably around 45 (based on price action), indicating neutral momentum with room for a downward move.
🎯 Take Profit Targets:
💎 TP 1: $0.04400
💎 TP 2: $0.04290
💎 TP 3: $0.04203
⚡️Plan:
➡️ Entry: Sell below $0.04545 after the 1-hour candle closes below this level to confirm the rejection from resistance.
➡️ Stop Loss: Set at $0.04737, which provides a 7% risk from the entry point and protects against a potential breakout.
➡️ Risk/Reward Ratio: From 1:2 (for TP1) to 1:5 (for TP3), making this trade attractive from a risk management perspective.
➡️ After the drop, the price has stabilized, indicating possible consolidation or accumulation.
➡️ Resistance zone: $0.04885 (upper boundary of the current range).
Technical Indicators:
➡️ The chart shows candles in red and green, reflecting bearish and bullish movements.
➡️ After the sharp decline, the price has formed lower highs and lows, but in recent hours, there’s an attempt at recovery.
📢 A price rejection below $0.04545 with increasing selling volume increases the likelihood of reaching the targets.
📢 The $0.04400 and $0.04290 levels may act as areas for partial profit-taking, so monitor price action in these zones.
📢 Risks: If the price breaks above $0.04885, it could signal a false breakdown and a potential reversal to the upside. In this case, consider reassessing the position.
📊 The decline in BYBIT:BROCCOLIUSDT.P aligns with cautious sentiment in the crypto market.
📊 As of March 20, 2025, BYBIT:BTCUSDT.P is trading around $90,000, showing signs of consolidation, which may pressure altcoins like BYBIT:BROCCOLIUSDT.P
BYBIT:BROCCOLIUSDT.P is showing bearish potential on the 1H timeframe.
⚡️A confirmed rejection below $0.04545 is your signal to act!
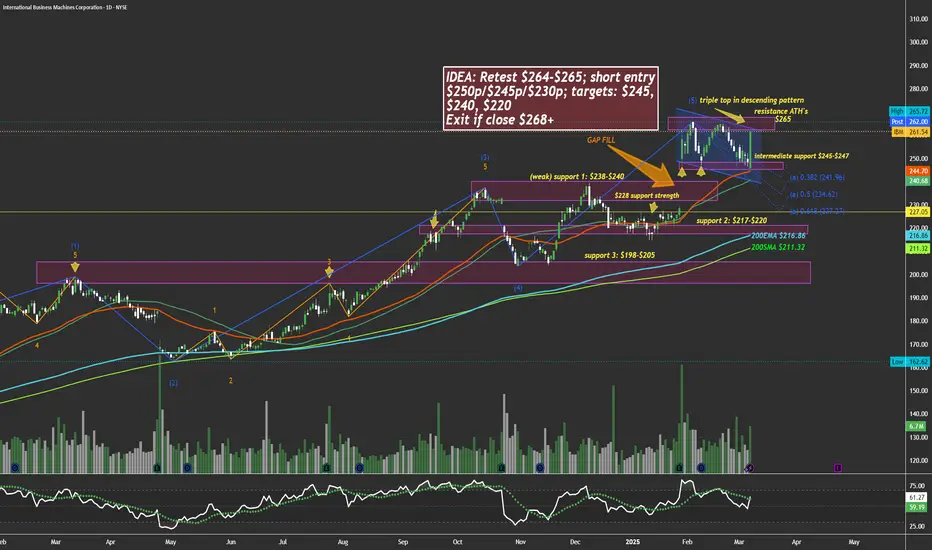
$IBM too hot, due for a chillHi, constructed a chart here showing many levels. I personally think NYSE:IBM will face some downside weeks to come. My trade plan is written in the idea box. The two lines that aren't labeled are 50ema and 50sma.
WSL
Charting the Path Forward: Key Levels to WatchPrevious Analysis: Successful Bullish Breakout
In our previous analysis, we identified a Falling Wedge pattern accompanied by bullish divergence, forecasting a breakout above 147.807. The price hit our target, confirming the bullish momentum and reaching key Fibonacci levels.
What’s Next:
Upon analyzing the chart, we observe that price has found support at 147.535 after a pullback during the American session. We anticipate the price to reach our first target, and after consolidation and a possible pullback, we expect to hit our second target near the upper line of the channel.
However, if the price declines from the first target and breaches support at 147.535, the next key support level is at 146.306.
Remember to follow your risk management strategies to protect your capital.
