BTC/USDT 1HInterval CHart Short-TermHello everyone, let's take a look at the BTC to USDT chart on a one hour time frame. As you can see, the price has fallen below the local uptrend line.
Let's start by determining the support line and after unfolding the Trend Based Fib Extension grid, you can see the support zone from $37,685 to $37,474, where the price is located, but further there may be a decline to around $36,866.
Looking the other way, there is resistance at $37,985, then there is a resistance zone from $38,176 to $38,362, and then resistance at $38,628.
Looking at the CHOP indicator, we can see that there is still some energy left for the move, the RSI indicator shows a rebound but there is room for the price to go a little lower, while the STOCH indicator is moving in the lower part, but the sharp rebound did not result in a price increase, which may result in a larger correction. .
Supportandresitance

BNB/USDT 4H ChartHello everyone, let's take a look at the BNB to USDT chart on a 4-hour time frame. As you can see, the price has fallen below the local uptrend line.
Let's start by determining the support line and after unfolding the Fib Retracement grid, you can see a strong support zone from $229 to $217, and then there should be support at $202.
Looking the other way, there is resistance at $253, and then there is a resistance zone from $262 to $272.
Looking at the CHOP indicator, we see that there is a lot of energy for the move, the RSI indicator shows a slight upward movement with room for price declines again, while the STOCH indicator rose to the upper part of the range despite a slight price movement.

ETH/USDT 4HInterval Chart Hello everyone, let's take a look at the ETH to USDT chart on a 4-hour time frame. As you can see, the price is moving above the local downtrend line.
When we unfold the trend based fib extension grid, we see that the price is held by the support at $2,040, while we still have a support zone from $2,008 to $1,985.
Looking the other way, you can see that the price is declining through the resistance zone from $2,078 to $2,102, and then we can define the second zone from $2,141 to $2,168.
Looking at the CHOP indicator, we see that there is still energy to make a move, on the RSI indicator we are moving in the upper part of the range, while the STOCH indicator is moving at the upper limit, which may result in a greater price recovery.

BTC/USDT 4HInterval Chart Hello everyone, let's take a look at the BTC to USDT chart on a 4-hour time frame. As you can see, the price is moving below the local uptrend line.
When we unfold the trend based fib extension tool, we will see support at the level of $36,285, and it is worth defining the support zone from $35,716 to $35,465.
Looking the other way, you can see that the price is bouncing off the resistance at $36,751 and then has a resistance zone from $37,391 to $37,873.
Looking at the CHOP indicator, we see that there is energy for further movement, on the RSI indicator we have returned to the middle, which makes it difficult to determine the direction, while the STOCH indicator indicates a trend reversal, which may result in a further price increase.

ETH/USDT Short-Term 4H ChartHello everyone, let's take a look at the ETH to USDT chart on a 4-hour time frame. As you can see, the price broke below the local upward trend line.
When we unfold the trend based fib extension grid, we see support at the level of $1,952, while we still have a very strong support zone from $1,921 to $1,881.
Looking the other way, the price again has resistance at $2012, and then we have a resistance zone from $2051 to $2078.
Looking at the CHOP indicator, we see that the energy is gaining strength, the RSI indicator, despite the recovery, still has room for a decline, and the STOCH indicator shows a downward movement with room for a larger correction.

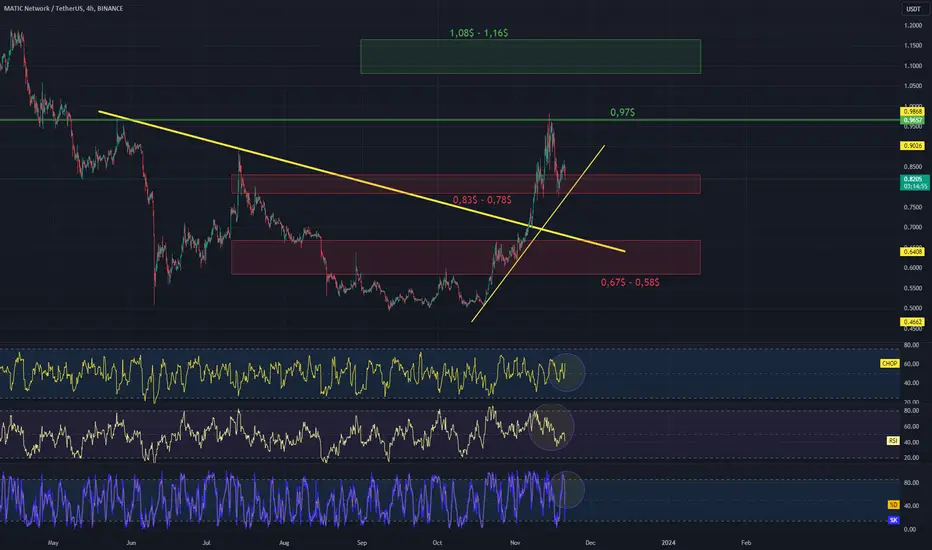
MATIC/USDT 4HInterval Chart Hello everyone, I invite you to review the MATIC chart also at a four-hour interval. As we can see, the price has overcome a strong downward trend line, and is currently moving in an upward trend, staying on the trend line.
In this situation, we will start by checking the resistance levels and here we can notice that the price has been rejected from the resistance level of $0.97, only when it is overcome will we have an open path towards the resistance zone from $1.08 to $1.16, which should lock the price against a larger increase.
Looking the other way, we can similarly determine support areas and here we can see that the price remains in the first support zone from $0.83 to $0.78, while when this zone is broken, we can see the price return to the second zone from $0.67 to $0.58.
The CHOP index indicates that there is still energy for further moves, the RSI indicator remains in a downward trend with room for the price to go lower, also when we look at the STOCH indicator we can see a strong rebound with room for the price to go slightly lower.
ETH/USDT 4HInterval Chart Hello everyone, I invite you to review the ETH pair to USDT chart, taking into account the four-hour interval. We will start by identifying with the blue lines the local downtrend channel where the price is approaching the upper limit again.
However, when we turn on the moving averages Ema Cross 10 and 30, we can see the confirmation of the return to the local upward trend.
Now let's move on to marking the support places. We will use the Fib Retracement tool to mark supports, and as you can see, the price has again broken out above the support at $2,028, if we fall lower again we can see a return to the support zone from $1,960 to $1,911.
Looking the other way, we can similarly mark places where the price should encounter resistance on the way up. And here we can see the fight against the resistance level at $2048, only when the price stays above it and leaves the downtrend channel will we see an attack on the resistance zone from $2087 to $2137.
The CHOP index indicates that most of the energy is used, on the RSI indicator we have returned to the upper part of the range with room for growth, but on the STOCH indicator we are moving above the upper limit, which may translate into a price recovery.

BTC Short-Term Chart 30MIntervalHello everyone, let's take a look at the BTC to USDT chart on a short time frame of 30 minutes. As you can see, the price is moving above the local uptrend line.
When we break down the Trend Based Fib Extension, we see support at the level of $36,757, and then we have a strong support zone from $35,752 to $35,222.
Looking the other way, you can see that the price is ahead of a strong resistance zone from $37,505 to $38,050, and further resistance may appear at $38,730.
Looking at the CHOP indicator, we see that there is still some energy left, the RSI indicator returns to the middle of the range, which creates room for a move in both directions, but the STOCH indicator shows that the upper limit has been exceeded, which should slow down the current increase and give a small price correction.

ETH 1HInterval Chart Short-TermHello everyone, let's take a look at the ETH to USDT chart on a one hour time frame. As you can see, the price came out at the top of the indicated triangle.
When we unfold the Trend Based Fib Extension grid, we can determine the support level at $1948, and then we have a support zone from $1928 to $1913.
Looking the other way, we see that the price is approaching the resistance zone from $1984 to $1995, and then must overcome the resistance at $2010 before further increases.
Looking at the CHOP indicator, we see that there is energy to continue the movement, the RSI indicator, despite the increase, has room for the price to go further, while the STOCH indicator has exceeded the upper limit, which may result in a correction in the coming hours.

BTC/USDT 1HInterval ChartHello everyone, let's take a look at the BTC to USDT chart on a one hour time frame. As you can see, the price moved sideways from the local downtrend line.
When we unfold the Fib Retracement grid, we see a support zone from $36,361 to $35,976, then there is support at $35,432, and then at $34,742.
Looking the other way, we have a visible resistance zone from $36,724 to $37,021, and then a strong zone from $37,421 to $37,958.
Looking at the CHOP indicator, we see that energy is being collected again, the RSI indicator shows an upward trend, and despite there being room for further growth, when we look at the STOCH indicator, we can see that we are rapidly approaching the upper limit, which may limit further increases.

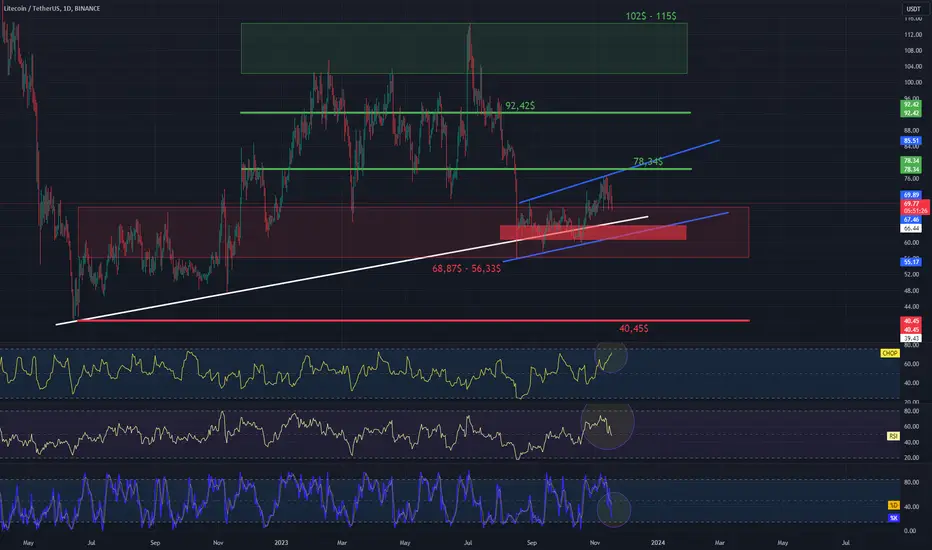
LTC/USDT 1DInterval ChartI invite you to review the chart of LTC in pair with USDT, this time taking into account the one-day time frame. Let's start by defining with the white line the upward trend that holds the price, and then using the blue lines we can mark the local channel of the upward trend in which we are currently located.
When we unfold the FIb Retracement grid, we can see that the price is based on a strong support zone from $68.87 to $56.33, but at this point let's also check for smaller movement and here the zone covering the trend lines and the lower border of the ongoing channel will be important. However, when the price breaks below the current channel and support zone, we may see a drop to the very strong support level of $40.45.
Looking the other way, we can see that the upper border of the channel is also the first place of significant resistance for the price at $78.34, the next important resistance is at $92.42, and then the price must overcome the strong resistance zone from $102 up to $115.
Please look at the CHOP index, which indicates that we have a lot of energy for the upcoming move, the RSI indicator is in the process of recovering, and there is a lot of room for further declines, similarly, the STOCH indicator shows a strong downward movement, which may drag the valuation to a lower level.
ETH to USDT chart analysis on a 4H intervalHello everyone, I invite you to a detailed review of the ETH pair to USDT chart, also on a four-hour interval. First, we will use the blue lines to mark the upward trend channel in which the price has dynamically moved upwards, moving along the local upward trend line, from which it has currently broken downwards. And here we will again define the current downtrend channel, where we have approached the lower border of the channel, using blue lines.
Now let's move on to marking the support places. We will use Fib Retracement tools to mark the supports, and as you can see, the price is fighting in the support zone from $1,939 to $1,895, if it comes out of it and breaks out of the channel, then we have support at $1,829 and then around $1,745.
Looking the other way, we can similarly mark places where the price should encounter resistance on the way up. And here the first resistance is at $1996, then we have the second resistance at $2048, and then the price must face a very strong resistance zone from $2088 to $2136.
When we turn on EMA Cross 10 and 30, we can notice the place where the indicator showed a return to the local downtrend in which we are currently staying.
The CHOP index indicates that there is energy for a continuation of the move, the RSI indicator shows that we are in a downward trend, with room for the price to go lower, but at this point it is worth looking at the STOCH indicator, which has clearly exceeded the lower limit, which may result in a slowdown in the correction and give an upward movement.

BTC/USDT 4HInterval Chart ReviewHello everyone, I invite you to every Friday cryptocurrency review. Let's start by checking the current situation on the BTC to USDT pair, taking into account the four-hour interval. First, we will use blue lines to mark the local downward trend channel to which the price has returned.
In order to check the support areas, we will use the Trend Based Fib Extension tool, and after unfolding the grid we can see that the price is based on the support zone from $36,023 to $35,492, but when the zone does not maintain the price, we can see a drop to the support level of $34,808 .
Looking the other way, we can determine resistance areas in a similar way. First, the price must again overcome the resistance at $36,721, only then will we move towards the strong resistance zone from $37,470 to $38,001.
Please pay attention to the CHOP index, which indicates that there is energy for further movements, on the RSI indicator there is still room for the price to go lower, while on the STOCH indicator we are approaching the lower limit, but there is still some room for further downward movements.

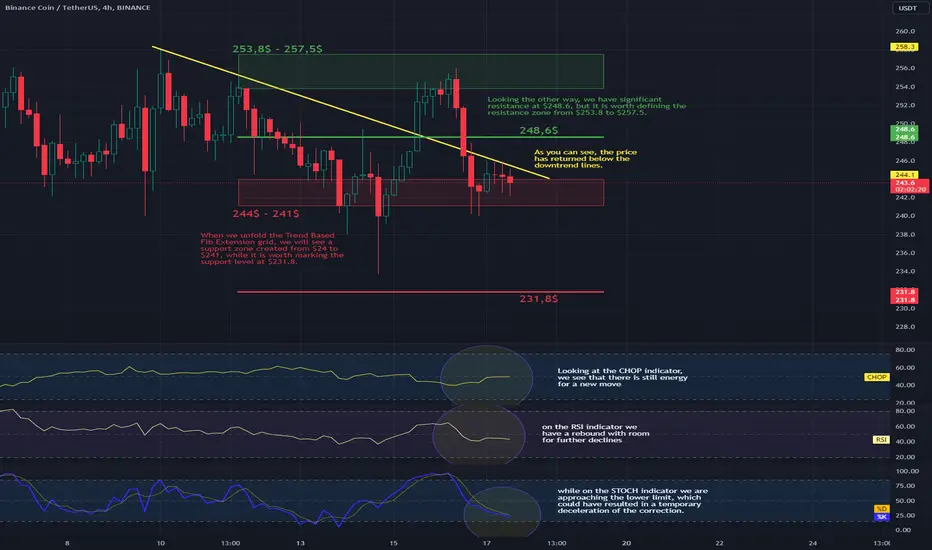
BNB/USDT 4HInterval ChartHello everyone, let's take a look at the BNB to USDT chart on a 4-hour time frame. As you can see, the price has returned below the downtrend lines.
When we unfold the Trend Based Fib Extension grid, we will see a support zone created from $24 to $241, while it is worth marking the support level at $231.8.
Looking the other way, we have significant resistance at $248.6, but it is worth defining the resistance zone from $253.8 to $257.5.
Looking at the CHOP indicator, we see that there is still energy for a new move, on the RSI indicator we have a rebound with room for further declines, while on the STOCH indicator we are approaching the lower limit, which could have resulted in a temporary deceleration of the correction.
BTC 4hInterval ChartHello everyone, let's take a look at the BTC to USDT chart on a 4-hour time frame. As you can see, the price has returned below the local downtrend line.
When we unfold the Trend based Fib Extension tool, we can see that the price is approaching the support level of $35,977, and then we have a strong support zone from $35,431 to $34,748.
Looking the other way, the resistance level is again the $37,300 level, and then the price will move towards the zone from $38,069 to $38,608, before which the price is rejected.
Looking at the CHOP indicator, we see that there is some energy for the move, the RSI indicator, similarly to the STOCH indicator, shows a current rebound, but there is also room for further price decline.

EURUSD APPROACHES THE RESISTANCEThe EUR/USD currency pair recently experienced a notable bearish movement as it broke through a significant support level and trendline, signaling a downward trend. The price subsequently reached a key monthly support level, from which it initiated a retracement.
This retracement is currently in progress and is aimed at reaching the 50% Fibonacci retracement level(1.0900). The overall trajectory for the week remains bullish, with the price expected to continue its retracement toward the 50% Fibonacci level.
We can use the slight pullback to add buy positions with the initial target at 1.08100.

ETH/USDT 4H Chart Hello everyone, let's take a look at the ETH to USDT chart on a four-hour time frame. As you can see, the price managed to stay on the local downtrend line.
When we unfold the trend based fib extension grid, we see that the strong support at $1,960 has maintained the price and is still support, but we may still see a decline to the support level at $1,850.
Looking the other way, you can see the current resistance zone from $2,088 to $2,135, and then there is visible resistance at $2,247.
The CHOP indicator shows that there is still energy that can be used to drop the price, the RSI indicator shows a slight rebound, but with room for the price to fall lower, and the STOCH indicator shows a rebound from the lower limit, which may result in a slightly larger price increase in the current movement. .

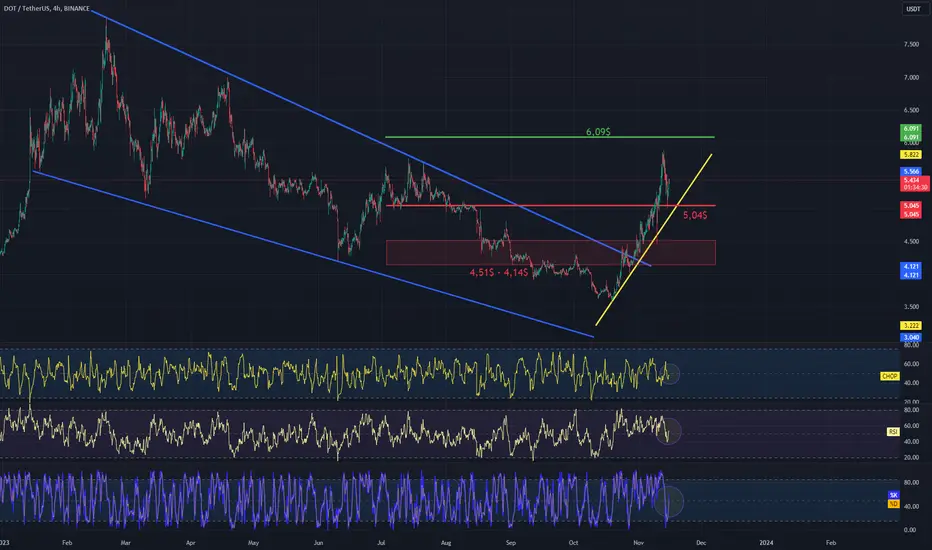
DOT/USDT 4H Interval ChartI invite you to review the chart of DOT in pair with USDT. First, we will use the blue lines to mark the downward trend channel from which the price emerged with dynamic upward movements, moving along the locally created upward trend line.
Going further, we can move on to marking support areas when we start a larger correction. however, here we have significant support at the level of $5.04, which has kept the price from further declines for now, only after it is broken, we can see the price return to the support zone from $4.51 to $4.14.
Looking the other way, for now, an important level for further increases is the resistance at the price of $6.09; only after it is overcome and positively tested will we be able to see attempts at further increases in the DOT price.
Please look at the CHOP index, which indicates that there is still energy to make a move, the RSI indicator shows a visible rebound, adding the STOCH indicator, which shows a reflection from the lower end of the range and visible room for growth, we can see a continuation of the upward movement before the upcoming correction.
MKR/USDT 4HInterval ChartHello everyone, I invite you to review the MKR chart on a four-hour interval. Let's start with the blue lines marking the upward trend channel, in which the price has locally entered a falling triangle formation, but currently we can see an attempt to exit the ongoing triangle at the top and an attempt to return to the previously prevailing upward channel.
When we unfold the Fib Retracement grid, we can see that the recent price decline was maintained by a strong support zone from $1,236 to $1,124, but now the price has returned higher, above the visible support at $1,396.
Looking the other way, we can similarly determine the resistance areas that the price must face. And here we see that the price is currently fighting the resistance at $1,451, only when it breaks above it will it move again towards the strong resistance zone at $1,566 to $1,654.
The CHOP index indicates that there is more and more energy for the move, the RSI indicator is growing again after a slight recovery, while the STOCH indicator exceeds the upper limit, which may slow down the current upward movement or result in a new rebound.

BTC 1HInterval Short-TermHello everyone, I invite you to check the current situation on BTC in the USDT pair, taking into account the one-hour interval. First, we will use the blue lines to mark the local channel of the upward trend, in which the price tried to break out at the bottom, but quickly returned to the ongoing channel.
Going further, we will use the Fib Retracement tool, and here we can see that the price decline was maintained by a strong support zone from $34923 to $34090, but now that the price has quickly rebounded, we should keep in mind the support at $36096, where the price can currently resist.
Looking the other way, we will similarly check the current resistance points that BTC will have to face again in further increases. And here you can see that the first significant resistance should appear at the level of $36,777, and then the price will be able to move towards a strong resistance zone from the level of $37,326 to the level of $38,026.
When we turn on the EMA Cross 10 and 30 indicator, we can see that the red ema corss 10 line is approaching the intersection of the green ema cross 30 line from below, which will potentially confirm the return to the local uptrend.
Please pay attention to the CHOP index, which indicates that there is still some energy left for movement, the RSI indicator shows a dynamic increase with room for the price to go higher, but the STOCH index exceeded the upper limit, which may result in a local price recovery.

#GBPCHF buying opportunityHello dear traders and friends, let's take a look at this chart and explore the potential buying opportunity.
As observed in the chart, we have a clear bullish market structure. Therefore, as long as the price remains above our horizontal arrow, which marks the 1-hour timeframe low in the market, as well as the previous day's low, we are interested in taking long positions.
In addition to the market structure, other confluences include the price being above the 1-hour and 4-hour timeframe EMAs, and above the 4-hour timeframe bullish trendline. This recent bearish move could also be viewed as a pullback to the bullish trendline, as indicated in the chart.
With the market structure in our favor and supported by a cluster of bullish confluences, we have sufficient confidence to open a long position in this pair.
I'll place my stop-loss just below the arrow line because if the price is able to go lower than that, it would signify a break in the structure to the downside.
If you've found this analysis helpful, please take a moment to like, comment, or share your thoughts with me.

Small timeframe Short on Gold.I think price will come back down to retest the projected area just under the take profit (1934.50). Then I think we'll see a continuance to the upside (around 1953).
This is just my opinion, not trading advice. Let me know what you guys think if you come across this! -- Again this is a short term trade. If it hits SL so be it. That comes with the game.
💎

BTC/USDT Short-Term Chart 1HHello everyone, let's take a look at the BTC to USDT chart on a one hour time frame. As you can see, the price is struggling to stay in the local horizontal trend channel.
After unfolding the trend based fib extension grid, you can see a support zone just below the side trend channel from $26,113 to $35,711, and further decline may stop the support at $25,220.
Looking the other way, a resistance zone has formed from $36,568 to $36,784, followed by a strong zone from $37,324 to $37,725.
Looking at the CHOP indicator, we see that there is still energy for a decline, and the RSI indicator, similarly to the STOCH indicator, also shows room for a deepening downward move.
